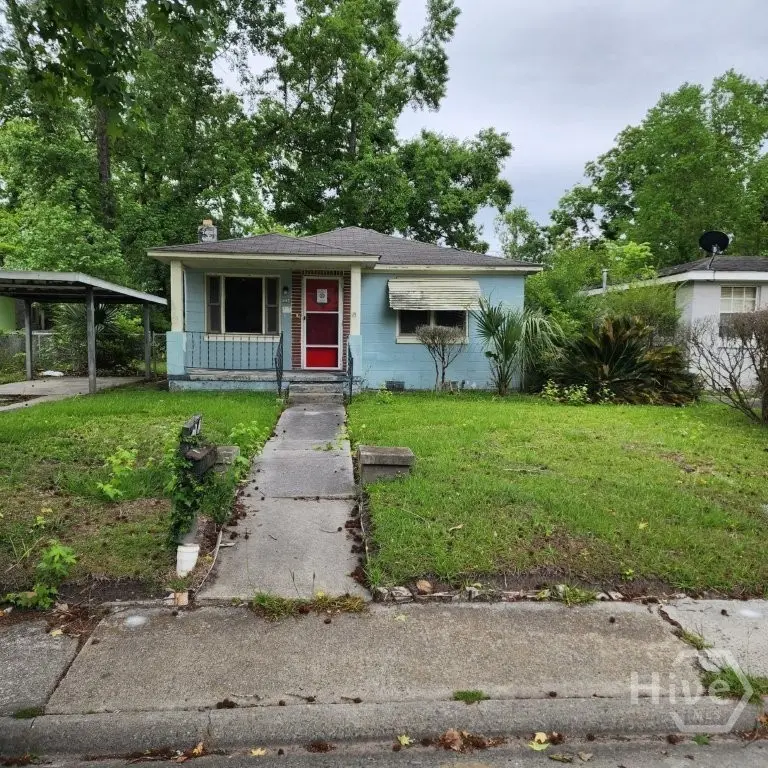
908 Bowden St · Savannah, GA
Flood risk 1/10 · Minimal
- FEMA flood zone
- X (unshaded)
- Chance of flooding over 30 yrs
- 0.0%
- Est. flood insurance / yr
- $507 – $1,088
Fire risk 3/10 · Minor
- Est. fire insurance / yr
- $963 – $1,789
Heat risk 9/10 · Severe
- Hot days now (above 109°F)
- 7 days/yr
- Hot days in 30 yrs
- 18 days/yr
Wind risk 9/10 · Severe
- Chance of severe wind over 30 yrs
- 99.0%
Air-quality risk 5/10 · Moderate
- Unhealthy air days now
- 7 days/yr
- Unhealthy air days in 30 yrs
- 8 days/yr
Risk factors via First Street. Map © Google.
Why this score? — see what drove the B+ grade
The composite is a weighted blend of 9 inputs, each scored 0–100. Each bar is that input's sub-score; the figure is the points it added to the 100-point composite (weight × sub-score).
- Cash flow +30.0/30.0
- ARV discount +15.0/15.0
- 1% rule +10.0/10.0
- DSCR +10.0/10.0
- Livability +4.3/5.0
- Rent growth +2.5/5.0
- Condition / age +2.5/5.0
- Schools +2.0/10.0
- Appreciation +0.0/10.0
$105,000
🖨 Deal sheet 📄 Offer letter ✓ Due diligence
Listing remarks MLS
Well Cared for 3Bed 1bath Bungalow near Downtown Savannah. Hardwood Floors, newer electrical service.
Key facts
- Masonry exterior
- 4,704 sq ft lot
- Garage
Tags
Property features AI
Finance
- HOA & community: Park nearby; Curbs in community
Exterior
- Parking: Attached garage; Carport (1 space); Off-street parking; On-street parking
- Utilities: Public water; Public sewer; 220V electric service; Cable available; Underground utilities
- Home design: Single-family residence; One story; No shared/common walls
- Construction: Block construction; Raised block foundation
- Exterior features: Front porch; Shed(s); Chain-link fenced yard; Fenced lot; City lot on an interior, level parcel; Asphalt-paved public road with curb
Interior
- Kitchen: Oven; Range
- Bathrooms: 1 full bathroom
- Heating & cooling: Electric heating; Other heating; Electric cooling with window unit(s)
- Interior features: Electric water heater; No basement
- Laundry & utility: Washer and dryer; Laundry located in kitchen
Neighborhood map
What this means for you Summary
Snapshot
- This is a 3-bed/1.0-bath single-family listed at $105k.
Deal economics
- At list price, monthly cash flow is $707 ($8k/yr) — positive.
- The deal already cash-flows at list — no discount required.
- Meets the 1% rule at list price ($2k rent vs $105k).
- Recommended offer: $102k (3.0% below list) — sets the bar for market timing.
- Cap rate 14.4% vs local median 4.0% in Savannah — top-decile yield for the area; either an underpriced asset or a hidden risk that comps aren't pricing in. Stress-test before assuming the spread holds.
Location & tenants
- Location reads 86/100 on livability (#1 in GA, #397 nationally) — a professional / high-income tenant draw. Strengths: crime A+, amenities A+, commute A+; Watch: employment D, schools F.
- Savannah-Chatham County (urban): math 20% / reading 26% proficiency, ranked #134 of 174 in GA (top 77%) — low school quality limits family demand, transient renter base, plan for 1-2y turnover.
- Market conditions: 76 active listings in the ZIP; 40 comparable units currently listed for rent nearby; rentals at typical pace (median 24d on market — plan ~3-4 weeks tenant-placement turnaround); 42% of comp listings sitting > 30 days — soft ceiling on asking rent; lower-income renter base — watch delinquency; 2,694 units permitted in Chatham County in 2024 (973 in 5+ unit buildings).
- At $1,822/mo this rent would consume 59% of the median local household income ($37k/yr) (locally 613% of renters already pay >50% of income on rent) — very limited rent-growth headroom before tenants either downsize or default.
Forward outlook
- Local home prices are declining (-3.0%/yr); year-one equity from $726 of loan paydown is wiped out by about $3k of value loss. Plan a longer hold.
- Chatham County population projected at +33% by 2050 — long-run rental-demand tailwind backs the buy-and-hold thesis.
- At projected returns (-3.0% appreciation + 3.0% rent growth), your $29k cash investment doubles in ~5 years — after that, you're playing with house money.
Negotiation context
- It's been on market 35 days — a 3% lower offer ($102k) is reasonable based on typical stale-listing flexibility.
- 2 sale attempts since 13y ago with the ask held roughly flat each time — persistent listings suggest the price (not the market) is what's stuck; bring a comps-based counter.
- Current owner paid $25k; list at $105k implies a 320% gain — meaningful room to come down on a strong offer.
Risks & watch-outs
- Watch-outs: built in 1955 — expect roof / HVAC / electrical / plumbing capex.
- Climate carrying-cost: severe wind risk, 99% chance of damaging wind over 30y; extreme-heat days projected 7→18/yr by 2055 (HVAC capex compounding) — expect insurance premiums to compound above CPI over the hold.
Questions for the listing agent
- It's been on market 35 days. Have you received any prior offers? Is the seller open to a 3% concession, seller financing, or rate buy-down credit?
- Built in 1955 — when were the roof, HVAC, electrical panel, plumbing, and water heater last replaced?
- Is there a deadline driving the sale (1031 exchange, divorce, estate, relocation)? That informs how much negotiation room exists.
- Schools are F-rated, which usually means shorter tenancies and higher turnover. Who's the typical renter profile here, and what's been the actual vacancy rate?
- What's the average days-on-market for RENTAL listings here right now (not sales)? A rising rental-DOM trend means longer vacancies and softer asking-rent achievability than the comps imply.
- What's the recent tenant-quality profile in this submarket — average credit score on applications, eviction rate, late-payment / NSF rate, and stable-employment percentage? A property-management company in the area should have these aggregated.
- How much new for-sale + rental construction is in the pipeline within 1–3 miles? Heavy new supply typically softens prices + rents 12–24 months out; constrained supply supports both.
Investment metrics
- 1% rule
- 1.73% ✓
- Cap rate
- 14.38%
- Cash-on-cash
- 28.87%
- DSCR
- 2.28
- GRM
- 4.8
CMA / ARV
- ARV (median comp)
- $145,546
- List price
- $105,000
- Delta
- -27.86%
- Verdict
- UNDERPRICED
- Comps
- 20 within 1.0 mi
Show comp detail 12 sales within ~0.75 mi
| Address | Dist | Beds/Ba | Sqft | Sold | Price | $/sf | Match |
|---|---|---|---|---|---|---|---|
| 1219 Elliott Ave | 0.12mi | 2/1.0 (-1) | 972 (+1%) | 8mo | $160,000 | $165 | 81 |
| 914 Bowden St | 0.02mi | 3/1.5 | 1,008 (+5%) | 12mo | $125,000 | $124 | 79 |
| 917 Elliott Ave | 0.05mi | 2/1.0 (-1) | 978 (+2%) | 16mo | $95,000 | $97 | 76 |
| 1025 Elliott Ave | 0.05mi | 2/2.0 (-1) | 900 (-6%) | 5mo | $115,000 | $128 | 74 |
| 1006 Lynah St | 0.25mi | 3/1.0 | 1,008 (+5%) | 8mo | $100,000 | $99 | 73 |
| 816 Lynah St | 0.25mi | 3/1.0 | 1,024 (+7%) | 17mo | $155,000 | $151 | 63 |
| 105 Pitt St | 0.20mi | 3/1.0 | 1,102 (+15%) | 4mo | $35,000 | $32 | 63 |
| 818 Allen Ave | 0.09mi | 2/1.0 (-1) | 836 (-13%) | 8mo | $135,000 | $161 | 62 |
| 1519 Cloverdale Dr | 0.57mi | 3/1.0 | 925 (-4%) | 17mo | $214,000 | $231 | 53 |
| 1402 Cloverdale Dr | 0.41mi | 3/1.0 | 825 (-14%) | 6mo | $219,900 | $267 | 53 |
| 1504 Audubon Dr | 0.45mi | 3/1.0 | 825 (-14%) | 11mo | $235,900 | $286 | 46 |
| 1600 Sylvester Dr | 0.62mi | 3/2.0 | 1,100 (+15%) | 1mo | $98,000 | $89 | 42 |
Match score weights: distance 35% · size 25% · config 20% · recency 20%. Top-matched comps best support the ARV.
Projected returns pro-forma
-3.0% appreciation · 3.0% rent growth · sell at horizon
- IRR
- 23.2%
- Equity multiple
- 1.95×
- Total profit
- $28,070
- Equity at exit
- $15,656
- IRR
- 31.2%
- Equity multiple
- 3.81×
- Total profit
- $82,584
- Equity at exit
- $9,078
Cash invested: $29,400 (down + closing). Projections, not guarantees.
Landlord ↔ Tenant lean methodology
- Overall (STATE)
- 90 Strongly Landlord-Friendly
- State Georgia
- 90 Strongly Landlord-Friendly · R+3
- County
- — inherits STATE
- City
- — inherits STATE
ZIP-level market 31415
- Home prices YoY
- -21.4%
- Active inventory
- 76
- Price-to-rent
- 4.8×
Monthly cashflow live
- Estimated rent
- $1,822 high interval (Pro) →
- Mortgage (P&I)
- −$551
- Tax from tax record
- −$137 /mo · $1,649/yr
- Insurance
- −$44
- HOA
- −$0
- Vacancy / Maint / Mgmt
- −$383
- Net cashflow
- $707
Break-even live
UW: 25.0% down · 7.5% · 30yr · 1.5% tax · 5.0% vac · 8.0% maint · 8.0% mgmt
Financing live
Cash to close
- Down payment
- $26,250
- Closing costs
- $3,150
- Reserves months
- —
- Total cash needed
- —
Loan-product check · same deal, 3 products live
Conventional
25% down · 7.5% · 30yr
- Down + closing
- —
- Monthly P&I
- —
- Monthly cashflow
- —
- DSCR
- —
- Eligible?
- —
Personal DTI + credit; lowest rate.
DSCR
20% down · 8.5% · 30yr
- Down + closing
- —
- Monthly P&I
- —
- Monthly cashflow
- —
- DSCR
- —
- Eligible?
- —
No personal income docs; deal must DSCR.
Hard money
10% down · 12.0% · 12mo
- Down + closing
- —
- Monthly P&I
- —
- Monthly cashflow
- —
- DSCR
- —
- Eligible?
- —
Short-term bridge; refi at stabilization.
Rent comps 40 comps
| Address | Beds | Baths | Sqft | Rent | $/sqft | DOM | Units | Dist |
|---|---|---|---|---|---|---|---|---|
| 905 Elliott Ave Savannah, GA | 2.0 | 2.0 | 1032 | $1,800 | $1.74 | 43d | 1 | 0.06mi |
| 911 Crosby St Savannah, GA | 3.0 | 2.0 | 1116 | $2,000 | $1.79 | 43d | 1 | 0.13mi |
| 17 Dutton St Savannah, GA | 3.0 | 1.0 | 990 | $1,650 | $1.67 | 13d | 1 | 0.35mi |
| 1437 Audubon Dr Savannah, GA | 3.0 | 1.0 | 925 | $1,575 | $1.70 | 43d | 1 | 0.46mi |
| 1013 Carroll St Savannah, GA | 2.0 | 1.5 | 768 | $1,400 | $1.82 | 43d | 1 | 0.48mi |
| 1019 W 35th St Unit B Savannah, GA | 3.0 | 2.0 | 1071 | $2,199 | $2.05 | 13d | 1 | 0.75mi |
| 1402 Comer St Savannah, GA | 2.0 | 1.0 | 690 | $1,200 | $1.74 | 43d | 1 | 0.78mi |
| 1024 W 39th St Savannah, GA | 2.0 | 1.0 | 860 | $1,399 | $1.63 | 23d | 1 | 0.80mi |
| 1402 New Castle St Savannah, GA | 2.0 | 1.0 | 928 | $1,500 | $1.62 | 43d | 1 | 0.82mi |
| 206 Ferrill St Savannah, GA | 3.0 | 1.0 | 936 | $1,450 | $1.55 | 13d | 1 | 0.86mi |
| 1416 Chester St Savannah, GA | 3.0 | 1.0 | 960 | $1,600 | $1.67 | 23d | 1 | 0.89mi |
| 40 Eagle St Savannah, GA | 1.0–2.0 | 1.0 | 841 | $1,331 | $1.58 | 23d | 6 | 0.92mi |
| 540 Selma St Savannah, GA | 2.0–5.0 | 2.0–5.0 | 790 | $1,112 | $1.41 | 23d | 1 | 0.92mi |
| 2108 Bulloch St Savannah, GA | 2.0 | 1.0 | 638 | $1,095 | $1.72 | 23d | 1 | 0.93mi |
| 1011 W 40th St Savannah, GA | 3.0 | 2.0 | 1125 | $1,995 | $1.77 | 13d | 1 | 0.96mi |
| 1415 Richards St Savannah, GA | 2.0 | 1.0 | 672 | $1,200 | $1.79 | 43d | 1 | 0.97mi |
| 1109 W 41st St Savannah, GA | 3.0 | 1.0 | 960 | $1,620 | $1.69 | 43d | 1 | 0.97mi |
| 1419 Richards St Savannah, GA | 2.0 | 1.0 | 672 | $1,200 | $1.79 | 43d | 1 | 0.97mi |
| 1421 Richards St Savannah, GA | 2.0 | 1.0 | 672 | $1,275 | $1.90 | 43d | 1 | 0.98mi |
| 1423 Richards St Savannah, GA | 2.0 | 1.0 | 672 | $1,275 | $1.90 | 43d | 1 | 0.98mi |
| 620 W 36th St Unit B Savannah, GA | 3.0 | 1.0 | 812 | $1,650 | $2.03 | 43d | 1 | 0.98mi |
| 2123 Harden St Savannah, GA | 2.0 | 1.0 | 1000 | $1,550 | $1.55 | 23d | 1 | 0.98mi |
| 2203 Harden St Unit A Savannah, GA | 3.0 | 1.0 | 900 | $2,100 | $2.33 | 13d | 1 | 0.99mi |
| 2221 Harden St Savannah, GA | 3.0 | 1.0 | 1000 | $1,550 | $1.55 | 43d | 1 | 1.01mi |
| 1325 Exley St Savannah, GA | 2.0–3.0 | 1.0–2.5 | 1193 | $1,432 | $1.20 | 21d | 6 | 1.01mi |
| 528 Selma St Unit B Savannah, GA | 2.0 | 2.0 | 974 | $2,625 | $2.70 | 13d | 1 | 1.02mi |
| 417 W 32nd St Unit B Savannah, GA | 3.0 | 3.0 | 972 | $2,600 | $2.67 | 43d | 1 | 1.03mi |
| 508 Kline St Savannah, GA | 2.0 | 2.0 | 900 | $2,000 | $2.22 | 13d | 1 | 1.03mi |
| 513 W 35th St Savannah, GA | 2.0 | 1.0 | 930 | $1,450 | $1.56 | 13d | 1 | 1.04mi |
| 513 W 35th St Unit A LOWER Savannah, GA | 2.0 | 1.0 | 930 | $1,350 | $1.45 | 13d | 1 | 1.04mi |
| 615 Montgomery St Savannah, GA | 1.0–2.0 | 1.0–2.0 | 902 | $3,164 | $3.51 | 13d | 18 | 1.04mi |
| 620 W 38th St Unit B Savannah, GA | 2.0 | 1.0 | 1076 | $1,600 | $1.49 | 43d | 1 | 1.04mi |
| 226 Fell St Savannah, GA | 3.0 | 1.0 | 1025 | $1,695 | $1.65 | 21d | 1 | 1.06mi |
| 323 W 31st St #2 Savannah, GA | 2.0 | 1.0 | 850 | $1,850 | $2.18 | 13d | 1 | 1.07mi |
| 1418 Montgomery St Savannah, GA | 2.0 | 1.0–2.0 | 576 | $1,900 | $3.30 | 13d | 13 | 1.07mi |
| 321 W 31st St Unit 1 Savannah, GA | 2.0 | 1.0 | 800 | $1,900 | $2.38 | 13d | 1 | 1.07mi |
| 319 W 31st St Savannah, GA | 2.0 | 1.0 | 756 | $1,800 | $2.38 | 43d | 1 | 1.08mi |
| 301 W Henry St Unit B Savannah, GA | 2.0 | 1.0 | 1100 | $2,100 | $1.91 | 23d | 1 | 1.09mi |
| 1005 W Victory Dr Savannah, GA | 3.0 | 2.0 | 1056 | $1,950 | $1.85 | 23d | 1 | 1.10mi |
| 2705 Stevens St Savannah, GA | 3.0 | 1.0 | 900 | $1,585 | $1.76 | 43d | 1 | 1.12mi |
Listing history 19 events
-
2026-06-18days on market $105,000 Active 35 DOM
-
2026-06-17days on market $105,000 Active 34 DOM
-
2026-06-16days on market $105,000 Active 33 DOM
-
2026-06-15days on market $105,000 Active 32 DOM
-
2026-06-14days on market $105,000 Active 30 DOM
-
2026-06-13days on market $105,000 Active 29 DOM
-
2026-06-10days on market $105,000 Active 27 DOM
-
2026-06-09days on market $105,000 Active 26 DOM
-
2026-06-08days on market $105,000 Active 25 DOM
-
2026-06-07days on market $105,000 Active 24 DOM
-
2026-06-05days on market $105,000 Active 21 DOM
-
2026-06-03days on market $105,000 Active 20 DOM
-
2026-06-02days on market $105,000 Active 19 DOM
-
2026-06-01days on market $105,000 Active 18 DOM
-
2026-05-31days on market $105,000 Active 17 DOM
-
2026-05-30days on market $105,000 Active 16 DOM
-
2026-05-13$105,000 Active 713-char remark
-
2013-10-11soldstatus $25,000 101-char remark
Show marketing remark (101 chars)
Well Cared for 3Bed 1bath Bungalow near Downtown Savannah. Hardwood Floors, newer electrical service.
-
2013-07-30$35,000 101-char remark
Show marketing remark (101 chars)
Well Cared for 3Bed 1bath Bungalow near Downtown Savannah. Hardwood Floors, newer electrical service.
ⓘ Source: listings_history table (triggers on properties + properties_extension) + one-shot
backfill from property_details.listing_events for pre-trigger history.
Tax reassessment forecast GA · Resets to sale price
- Current annual tax
- $1,649 · $137/mo
- Projected year-2 tax
- $1,649 · $137/mo
- Expected delta
- $0/yr ($0/mo · 0.0%)
ⓘ Screening estimate from a state-policy table — verify with the county assessor before closing.
Climate risk First Street
- Flood 1/10 Low FEMA zone X (unshaded) · 0% chance over 30 yrs
- Wildfire 3/10 Moderate
- Heat 9/10 Extreme 7 d/yr ≥109°F today · 18 d/yr by 30 yrs out
- Wind 9/10 Extreme 99% chance of damaging wind over 30 yrs
- Air quality 5/10 Major 7 unhealthy d/yr today · 8 by 30 yrs out
Nearby sold comps map
Loading sold comps map…
Walkable amenities ~0.75 mi
Loading nearby amenities…
Taxation est. · year 1
- Rental income
- $21,861
- − Mortgage interest
- −$5,882
- − Property taxes
- −$1,649
- − Insurance
- −$525
- − Repairs & maintenance
- −$1,749
- − Management
- −$1,749
- − Depreciation
- −$3,055
- Taxable income
- $7,253
- Est. tax owed @ 24.0%
- −$1,741
- After-tax cash flow
- $6,748/yr
For passive investors: Depreciation is non-cash, so a rental often shows a tax loss while cash-flowing — sheltering income. Rental losses are passive: they offset passive income freely, and up to $25,000/yr can offset ordinary (W-2) income if you actively participate and your MAGI is under $100k (phasing out to $0 by $150k); unused losses carry forward. On sale, claimed depreciation is recaptured at up to 25%, and gains may owe capital-gains tax (a 1031 exchange can defer both). Figures are a year-1 estimate at your 24.0% rate — not tax advice; consult a CPA.
Schools (NCES district)
- District
- Savannah-Chatham County
- NCES district ID
- 1301020
- Math proficiency
- 20% ▼ -11.00%
- Reading proficiency
- 26% ▼ -5.00%
- Median HH income
- $47,443
- Composite
- 20.14/100
- National rank
- #8639
- State rank
- #134 of 174 in GA
Livability — Savannah
- Score
- 86/100
- State rank
- #1
- US rank
- #397
Category grades
Schools grade is shown separately in the Schools card above.
Census & demographics
- Census place
- Savannah, GA
- County
- Chatham County · 271,602 people
- City population
- 216,564
- Metro
- Savannah, GA
- Population (ZIP)
- 11,082
- Household income
- $37,109
- Rent vs Own
- Severe rent burden
- 613.0
Population outlook (Chatham County) Hauer SSP2
- Today (2025)
- 332,584 people
- By 2030
- 355,508 · +6.9%
- By 2040
- 400,030 · +20.3%
- By 2050
- 443,019 · +33.2%
- By 2075
- 534,579 · +60.7%
- By 2100
- 583,863 · +75.6%
Race, ethnicity, and origin ACS 2023
- Neighborhood character
- Predominantly Black (89%)
- Race & ethnicity
- Black 89% White 5% Hispanic / Latino 5% Two or more races 3%
- Foreign-born
- 2% · Canada
- Languages at home
- 95% English-only · Spanish 4%
Political lean MEDSL · Chatham
- 2024 margin
- D (+18.0) · D 58.6% · R 40.6%
- 2008→2024 swing
- +3.6pp toward D · 2008: 14.4pp · 2024: 18.0pp
- All cycles
- 2024: D+18.0 2020: D+18.8 2016: D+14.5 2012: D+12.0 2008: D+14.4
Not yet ingested
- Civics
- —
Market trends
- HPI YoY
- ▼ -55.36%
- Current HPI
- 203.0696
- Rent YoY
- —
- Metro
- Savannah, GA
- State GDP YoY
- ▲ 2.66%
- F500 in state
- 28
Industry mix (Fortune 500 HQ in GA)
| Industry | F500 HQs | Revenue |
|---|---|---|
| Paper / Packaging | 2 | $29B |
|
||
| Retail | 1 | $160B |
|
||
| Transportation / Logistics | 1 | $91B |
|
||
| Airlines | 1 | $62B |
|
||
| Consumer Goods | 1 | $47B |
|
||
| Utilities | 1 | $25B |
|
||
Price history
+200.0% since first listed3 events — show timeline
- 2026-05-13 Listed $105,000 Hive MLS
- 2013-10-11 Sold (MLS) $25,000 Hive MLS
- 2013-07-30 Listed $35,000 Hive MLS
Property tax history
+11.7%/yrLatest (2025): $1,649 · -16.7% YoY. Source: county tax records.
Cash-flow waterfall
monthlySold comps — $/sqft
last 12 mo · ≤1 miLoading sold comps…