 Duplex
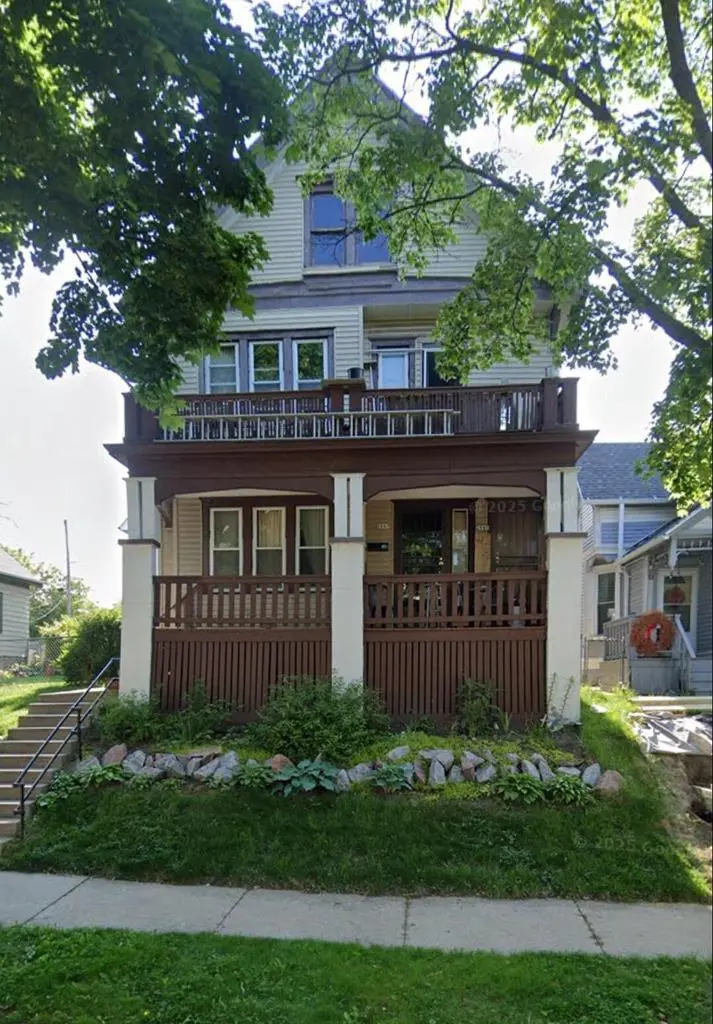
2845 N Richards St #2847 · Milwaukee, WI
Flood risk 1/10 · Minimal
- FEMA flood zone
- X (unshaded)
- Chance of flooding over 30 yrs
- 0.0%
- Est. flood insurance / yr
- $473 – $860
Fire risk 1/10 · Minimal
- Est. fire insurance / yr
- $636 – $1,182
Heat risk 2/10 · Minimal
- Hot days now (above 98°F)
- 7 days/yr
- Hot days in 30 yrs
- 13 days/yr
Wind risk 2/10 · Minimal
- Chance of severe wind over 30 yrs
- —
Air-quality risk 3/10 · Minor
- Unhealthy air days now
- 3 days/yr
- Unhealthy air days in 30 yrs
- 4 days/yr
Risk factors via First Street. Map © Google.
Why this score? — see what drove the C+ grade
The composite is a weighted blend of 9 inputs, each scored 0–100. Each bar is that input's sub-score; the figure is the points it added to the 100-point composite (weight × sub-score).
- Cash flow +30.0/30.0
- DSCR +10.0/10.0
- 1% rule +8.5/10.0
- Livability +4.0/5.0
- Rent growth +3.8/5.0
- Condition / age +2.8/5.0
- Schools +1.2/10.0
- ARV discount +0.0/15.0
- Appreciation +0.0/10.0
$179,900
🖨 Deal sheet 📄 Offer letter ✓ Due diligence
Multi-family units
County records classify this as Multi-Family (2-4 Unit). Listing-text estimate: 2 units. confirmed
Listing remarks MLS
Don't walk! Run! This is it! This is a partially renovated duplex on the popular east side of a highly sought after location in Milwaukee. Lots of updates have been made, but could use a little more to build some sweat equity. It's still going to be a sound investment for the right buyer no matter who buys the property. Room sizes have been estimated and not verified by the Broker. If you're looking for an investment property not far from downtown, look no further! This is the one! Don't let this one get away! Make your appointment to see this one today!
Key facts
- 1,742 sq ft lot
- 2 garage spots
- Built 1915
Neighborhood map
What this means for you Summary
Snapshot
- This is a 2 × 2-bed/1.0-bath units multifamily listed at $180k. Condition is rated average.
Deal economics
- At list price, monthly cash flow is $677 ($8k/yr) — positive. Per door: $339/mo.
- The deal already cash-flows at list — no discount required.
- Meets the 1% rule at list price ($2k rent vs $180k).
- Recommended offer: $175k (3.0% below list) — sets the bar for market timing.
- Cap rate 10.8% vs local median 5.1% in Milwaukee — top-decile yield for the area; either an underpriced asset or a hidden risk that comps aren't pricing in. Stress-test before assuming the spread holds.
Location & tenants
- Location reads 81/100 on livability (#55 in WI, #1,534 nationally) — a professional / high-income tenant draw. Strengths: amenities A+, commute A+, cost of living A+; Watch: employment D+, schools F, crime F.
- Milwaukee School District (urban): math 10% / reading 18% proficiency, ranked #337 of 342 in WI (top 98%) — low school quality limits family demand, transient renter base, plan for 1-2y turnover; 77% free/reduced lunch — lower-income household profile, screen leases tightly.
- Market conditions: Rents rising fast (+5.0%/yr); 129 active listings in the ZIP; 28 comparable units currently listed for rent nearby; rentals at typical pace (median 24d on market — plan ~3-4 weeks tenant-placement turnaround); 1,017 units permitted in Milwaukee County in 2024 (803 in 5+ unit buildings).
- At $2,431/mo this rent would consume 62% of the median local household income ($47k/yr) (locally 2397% of renters already pay >50% of income on rent) — very limited rent-growth headroom before tenants either downsize or default.
Forward outlook
- Local home prices are declining (-3.0%/yr); year-one equity from $1k of loan paydown is wiped out by about $5k of value loss. Plan a longer hold.
- Milwaukee County population projected at +4% by 2050 — modest demand growth; plan on rents tracking national, not racing it.
- At projected returns (-3.0% appreciation + 5.0% rent growth), your $50k cash investment doubles in ~7 years — after that, you're playing with house money.
Negotiation context
- It's been on market 34 days — a 3% lower offer ($175k) is reasonable based on typical stale-listing flexibility.
Risks & watch-outs
- Watch-outs: built in 1915 — expect roof / HVAC / electrical / plumbing capex.
Questions for the listing agent
- It's been on market 34 days. Have you received any prior offers? Is the seller open to a 3% concession, seller financing, or rate buy-down credit?
- Can we see the unit-by-unit rent roll, current vacancy, and any below-market leases? What's the average tenancy length?
- What capital expenditures (roof, boiler, parking lot, exteriors) have been made in the last 5 years, and what's planned in the next 2?
- Built in 1915 — when were the roof, HVAC, electrical panel, plumbing, and water heater last replaced?
- Is there a deadline driving the sale (1031 exchange, divorce, estate, relocation)? That informs how much negotiation room exists.
- Schools are F-rated, which usually means shorter tenancies and higher turnover. Who's the typical renter profile here, and what's been the actual vacancy rate?
- Crime grade is F in this area — have there been break-ins, vandalism, or insurance claims at this property in the last 3 years? What carrier currently insures it and at what premium?
- What's the average days-on-market for RENTAL listings here right now (not sales)? A rising rental-DOM trend means longer vacancies and softer asking-rent achievability than the comps imply.
- What's the recent tenant-quality profile in this submarket — average credit score on applications, eviction rate, late-payment / NSF rate, and stable-employment percentage? A property-management company in the area should have these aggregated.
- How much new apartment / multifamily construction is in the pipeline within 1–3 miles? Heavy new supply (>2% of stock underway) typically softens rents 12–24 months out; light construction supports rent growth.
Investment metrics
- 1% rule
- 1.35% ✓
- Cap rate
- 10.81%
- Cash-on-cash
- 16.13%
- DSCR
- 1.72
- GRM
- 6.2
CMA / ARV
- ARV (median comp)
- $136,792
- List price
- $179,900
- Delta
- 31.51%
- Verdict
- OVERPRICED
- Comps
- 20 within 1.0 mi
Show comp detail 12 sales within ~0.75 mi
| Address | Dist | Beds/Ba | Sqft | Sold | Price | $/sf | Match |
|---|---|---|---|---|---|---|---|
| 2940 N Holton St #2942 | 0.19mi | 4/2.0 | 2,032 (-3%) | 0mo | $195,000 | $96 | 86 |
| 2768 N Palmer St #2770 | 0.11mi | 4/2.0 | 2,211 (+6%) | 3mo | $174,415 | $79 | 83 |
| 220 E Clarke St | 0.31mi | 3/2.0 (-1) | 2,077 (-1%) | 3mo | $180,000 | $87 | 77 |
| 2813 N Humboldt Blvd #2815 | 0.50mi | 4/2.0 | 2,152 (+3%) | 2mo | $276,000 | $128 | 71 |
| 2514 N Holton St #2516 | 0.44mi | 4/2.0 | 2,246 (+7%) | 1mo | $215,000 | $96 | 66 |
| 2812 N Fratney St #2814 | 0.34mi | 4/2.0 | 2,314 (+10%) | 2mo | $300,000 | $130 | 65 |
| 608 W Burleigh St #610 | 0.65mi | 4/2.0 | 2,174 (+4%) | 3mo | $112,000 | $52 | 61 |
| 2438 N Pierce St | 0.58mi | 5/3.0 (+1) | 2,032 (-3%) | 0mo | $265,000 | $130 | 58 |
| 2477 N 6th St | 0.70mi | 5/2.0 (+1) | 2,046 (-2%) | 1mo | $111,000 | $54 | 58 |
| 600 E Burleigh St | 0.38mi | 4/2.0 | 1,787 (-15%) | 1mo | $180,000 | $101 | 57 |
| 3358 N Richards St #3364 | 0.65mi | 4/2.0 | 1,858 (-11%) | 1mo | $95,000 | $51 | 50 |
| 3341 N 3rd St #3343 | 0.72mi | 4/2.0 | 2,292 (+10%) | 4mo | $109,000 | $48 | 48 |
Match score weights: distance 35% · size 25% · config 20% · recency 20%. Top-matched comps best support the ARV.
Projected returns pro-forma
-3.0% appreciation · 5.0% rent growth · sell at horizon
- IRR
- 9.4%
- Equity multiple
- 1.38×
- Total profit
- $19,008
- Equity at exit
- $26,824
- IRR
- 20.1%
- Equity multiple
- 2.86×
- Total profit
- $93,572
- Equity at exit
- $15,554
Cash invested: $50,372 (down + closing). Projections, not guarantees.
Landlord ↔ Tenant lean methodology
- Overall (STATE)
- 73 Landlord-Friendly
- State Wisconsin
- 73 Landlord-Friendly · R+2
- County
- — inherits STATE
- City
- — inherits STATE
ZIP-level market 53212
- Rents YoY
- 5.0%
- Active inventory
- 129
- Price-to-rent
- 12.3×
Monthly cashflow live
- Estimated rent
- $2,431 high interval (Pro) →
- Mortgage (P&I)
- −$943
- Tax est. 1.5%
- −$225 /mo · $2,698/yr
- Insurance
- −$75
- HOA
- −$0
- Vacancy / Maint / Mgmt
- −$511
- Net cashflow
- $677
Break-even live
2-unit breakdown (identical units grouped — click to expand)
| Units | Beds | Baths | Est. rent |
|---|---|---|---|
| 2× units | 2 | 1 | $2,430 |
| #1 | 2 | 1 | $1,215 |
| #2 | 2 | 1 | $1,215 |
| Total (2 units) | $2,431 | ||
UW: 25.0% down · 7.5% · 30yr · 1.5% tax · 5.0% vac · 8.0% maint · 8.0% mgmt
Financing live
Cash to close
- Down payment
- $44,975
- Closing costs
- $5,397
- Reserves months
- —
- Total cash needed
- —
Loan-product check · same deal, 3 products live
Conventional
25% down · 7.5% · 30yr
- Down + closing
- —
- Monthly P&I
- —
- Monthly cashflow
- —
- DSCR
- —
- Eligible?
- —
Personal DTI + credit; lowest rate.
DSCR
20% down · 8.5% · 30yr
- Down + closing
- —
- Monthly P&I
- —
- Monthly cashflow
- —
- DSCR
- —
- Eligible?
- —
No personal income docs; deal must DSCR.
Hard money
10% down · 12.0% · 12mo
- Down + closing
- —
- Monthly P&I
- —
- Monthly cashflow
- —
- DSCR
- —
- Eligible?
- —
Short-term bridge; refi at stabilization.
Rent comps 28 comps
| Address | Beds | Baths | Sqft | Rent | $/sqft | DOM | Units | Dist |
|---|---|---|---|---|---|---|---|---|
| 3042 N Palmer St #5 Milwaukee, WI | 3.0 | 1.0 | 1718 | $1,050 | $0.61 | 23d | 1 | 0.28mi |
| 2634 N Doctor M.L.K. Jr Dr Milwaukee, WI | 5.0 | 2.5 | 2512 | $3,700 | $1.47 | 43d | 1 | 0.38mi |
| 2772 N Bremen St #2774 Milwaukee, WI | 3.0 | 1.0 | 1500 | $1,795 | $1.20 | 43d | 1 | 0.41mi |
| 400 E Meinecke Ave #402 Milwaukee, WI | 3.0 | 1.0 | 1700 | $1,800 | $1.06 | 16d | 1 | 0.54mi |
| 312 E Townsend St Unit 312 Milwaukee, WI | 3.0 | 1.0 | 1400 | $1,250 | $0.89 | 23d | 1 | 0.72mi |
| 3420 N Vel R. Phillips Ave Unit 3422 Milwaukee, WI | 3.0 | 1.0 | 2756 | $1,195 | $0.43 | 43d | 1 | 0.83mi |
| 3420-22 N Vel R Phillips Ave Milwaukee, WI | 3.0 | 1.0 | 2756 | $1,195 | $0.43 | 43d | 1 | 0.83mi |
| 2012 N Buffum St Milwaukee, WI | 3.0 | 2.5 | 2200 | $2,695 | $1.23 | 43d | 1 | 0.92mi |
| 3131 N Bartlett Ave Unit 1 Milwaukee, WI | 4.0 | 1.0 | 1600 | $1,750 | $1.09 | 43d | 1 | 1.01mi |
| 1814 E Linnwood Ave Milwaukee, WI | 4.0 | 2.0 | 1800 | $3,100 | $1.72 | 43d | 1 | 1.07mi |
| 1014 E Land Pl Milwaukee, WI | 3.0 | 2.0 | 1900 | $2,000 | $1.05 | 4d | 1 | 1.11mi |
| 1902 E Linnwood Ave Unit 1902 04 Milwaukee, WI | 4.0 | 1.5 | 1599 | $2,400 | $1.50 | 17d | 1 | 1.11mi |
| 1902 E Linnwood Ave Unit 1902 05 Milwaukee, WI | 4.0 | 1.5 | 1599 | $2,400 | $1.50 | 4d | 1 | 1.11mi |
| 922 E Hamilton St Unit Lower Milwaukee, WI | 3.0 | 1.0 | 1900 | $1,550 | $0.82 | 23d | 1 | 1.13mi |
| 1025 E Land Pl Milwaukee, WI | 3.0 | 1.0 | 1560 | $1,750 | $1.12 | 23d | 1 | 1.14mi |
| 2959 N Murray Ave Milwaukee, WI | 3.0 | 1.0 | 1500 | $1,800 | $1.20 | 16d | 1 | 1.14mi |
| 1116 E Hamilton St Milwaukee, WI | 3.0 | 2.0 | 1400 | $1,750 | $1.25 | 17d | 1 | 1.19mi |
| 2937 N Frederick Ave Milwaukee, WI | 4.0 | 1.0 | 1700 | $1,925 | $1.13 | 4d | 1 | 1.19mi |
| 2579 N Frederick Ave Milwaukee, WI | 4.0 | 2.0 | 2400 | $2,095 | $0.87 | 4d | 1 | 1.22mi |
| 2706 N Frederick Ave Milwaukee, WI | 3.0 | 2.0 | 1500 | $2,000 | $1.33 | 17d | 1 | 1.23mi |
| 1703 N Astor St Milwaukee, WI | 4.0 | 2.0 | 1800 | $2,200 | $1.22 | 43d | 1 | 1.23mi |
| 2974 N Frederick Ave Milwaukee, WI | 4.0 | 2.0 | 1626 | $2,600 | $1.60 | 43d | 1 | 1.24mi |
| 2609 N Maryland Ave Milwaukee, WI | 4.0 | 2.5 | 1700 | $2,050 | $1.21 | 4d | 1 | 1.27mi |
| 2830 N Maryland Ave Unit 2828 Milwaukee, WI | 3.0 | 1.0 | 1675 | $1,995 | $1.19 | 17d | 1 | 1.28mi |
| 1551 N Water St Milwaukee, WI | 3.0 | 1.0–2.0 | 1074 | $3,395 | $3.16 | 2d | 52 | 1.35mi |
| 3015 N Prospect Ave Unit 3015 Prospect Milwaukee, WI | 3.0 | 1.0 | 1570 | $1,950 | $1.24 | 17d | 1 | 1.40mi |
| 2511 N Prospect Ave Unit 2511 19 Milwaukee, WI | 3.0 | 1.0 | 1658 | $1,980 | $1.19 | 17d | 1 | 1.44mi |
| 2534 N Prospect Ave Milwaukee, WI | 3.0 | 1.0 | 1500 | $2,095 | $1.40 | 43d | 1 | 1.44mi |
Listing history 1 events
-
2026-04-20$179,900 Active 560-char remark
Show marketing remark (560 chars)
Don't walk! Run! This is it! This is a partially renovated duplex on the popular east side of a highly sought after location in Milwaukee. Lots of updates have been made, but could use a little more to build some sweat equity. It's still going to be a sound investment for the right buyer no matter who buys the property. Room sizes have been estimated and not verified by the Broker. If you're looking for an investment property not far from downtown, look no further! This is the one! Don't let this one get away! Make your appointment to see this one today!
ⓘ Source: listings_history table (triggers on properties + properties_extension) + one-shot
backfill from property_details.listing_events for pre-trigger history.
Climate risk First Street
- Flood 1/10 Low FEMA zone X (unshaded) · 0% chance over 30 yrs
- Wildfire 1/10 Low
- Heat 2/10 Low 7 d/yr ≥98°F today · 13 d/yr by 30 yrs out
- Wind 2/10 Low
- Air quality 3/10 Moderate 3 unhealthy d/yr today · 4 by 30 yrs out
Nearby sold comps map
Loading sold comps map…
Walkable amenities ~0.75 mi
Loading nearby amenities…
Taxation est. · year 1
- Rental income
- $29,172
- − Mortgage interest
- −$10,077
- − Property taxes
- −$2,698
- − Insurance
- −$900
- − Repairs & maintenance
- −$2,334
- − Management
- −$2,334
- − Depreciation
- −$5,233
- Taxable income
- $5,596
- Est. tax owed @ 24.0%
- −$1,343
- After-tax cash flow
- $6,784/yr
For passive investors: Depreciation is non-cash, so a rental often shows a tax loss while cash-flowing — sheltering income. Rental losses are passive: they offset passive income freely, and up to $25,000/yr can offset ordinary (W-2) income if you actively participate and your MAGI is under $100k (phasing out to $0 by $150k); unused losses carry forward. On sale, claimed depreciation is recaptured at up to 25%, and gains may owe capital-gains tax (a 1031 exchange can defer both). Figures are a year-1 estimate at your 24.0% rate — not tax advice; consult a CPA.
Condition & rehab AI · 1 photo
A moderately renovated duplex with average condition, requiring exterior siding repair and landscaping maintenance to enhance its resale and rental value.
Repairs flagged
- Moderate Exterior siding — Weathered appearance
- Minor Landscaping — Some overgrown areas
Value-add opportunities
- Both Paint exterior siding — Enhances curb appeal and value
- Both Landscaping — Improves curb appeal and enhances property value
Renovation cost estimate screening
| Repair item | Severity | Est. cost |
|---|---|---|
| Exterior siding · Weathered appearance | Moderate | $3,000–15,000 |
| Landscaping · Some overgrown areas | Minor | $500–3,000 |
| Total estimated repair cost · 2 items | $3,500–18,000 |
Value-add ROI direction
- Both Paint exterior siding — Enhances curb appeal and value ↑
- Both Landscaping — Improves curb appeal and enhances property value ↑
ⓘ Cost ranges are severity-bucket heuristics (US national rule-of-thumb). Get contractor quotes + a written scope before underwriting a rehab budget.
Schools (NCES district)
- District
- Milwaukee School District
- NCES district ID
- 5509600
- Math proficiency
- 10% ▼ -5.00%
- Reading proficiency
- 18% ▬ 0.00%
- Median HH income
- $36,339
- Composite
- 11.61/100
- National rank
- #9696
- State rank
- #337 of 342 in WI
Livability — Milwaukee
- Score
- 81/100
- State rank
- #55
- US rank
- #1534
Category grades
Schools grade is shown separately in the Schools card above.
Census & demographics
- Census place
- Milwaukee, WI
- County
- Milwaukee County · 926,379 people
- City population
- 573,768
- Metro
- Milwaukee-Waukesha, WI
- Population (ZIP)
- 28,938
- Household income
- $47,298
- Rent vs Own
- Severe rent burden
- 2397.0
Population outlook (Milwaukee County) Hauer SSP2
- Today (2025)
- 995,758 people
- By 2030
- 1,009,124 · +1.3%
- By 2040
- 1,028,128 · +3.3%
- By 2050
- 1,040,066 · +4.4%
- By 2075
- 1,057,849 · +6.2%
- By 2100
- 1,039,774 · +4.4%
Race, ethnicity, and origin ACS 2023
- Neighborhood character
- Diverse neighborhood (Simpson 0.64)
- Race & ethnicity
- Black 48% White 35% Hispanic / Latino 12% Two or more races 9%
- Hispanic origin (detail)
- Mexican 4% Puerto Rican 6%
- Common ancestry
- Romanian 4% Portuguese 2% Italian 2%
- Foreign-born
- 2% · Canada
- Languages at home
- 92% English-only · Spanish 6%
Political lean MEDSL · Milwaukee
- 2024 margin
- Solid D (+38.5) · D 68.3% · R 29.8% · Other 1.8%
- 2008→2024 swing
- +2.7pp toward D · 2008: 35.9pp · 2024: 38.5pp
- All cycles
- 2024: D+38.5 2020: D+39.9 2016: D+37.5 2012: D+34.6 2008: D+35.9
Not yet ingested
- Civics
- —
Market trends
- HPI YoY
- ▼ -216.73%
- Current HPI
- 385.8225
- Rent YoY
- ▲ 5.00%
- Metro
- Milwaukee-Waukesha, WI
- State GDP YoY
- ▲ 2.10%
- F500 in state
- 20
Industry mix (Fortune 500 HQ in WI)
| Industry | F500 HQs | Revenue |
|---|---|---|
| Industrial Machinery | 4 | $23B |
|
||
| Industrial Technology | 2 | $36B |
|
||
| Insurance | 1 | $36B |
|
||
| Professional Services | 1 | $19B |
|
||
| Utilities | 1 | $9B |
|
||
| Consumer Goods | 1 | $3B |
|
||
Price history
1 event — show timeline
- 2026-04-20 Listed $179,900 METROMLS
Cash-flow waterfall
monthlySold comps — $/sqft
last 12 mo · ≤1 miLoading sold comps…