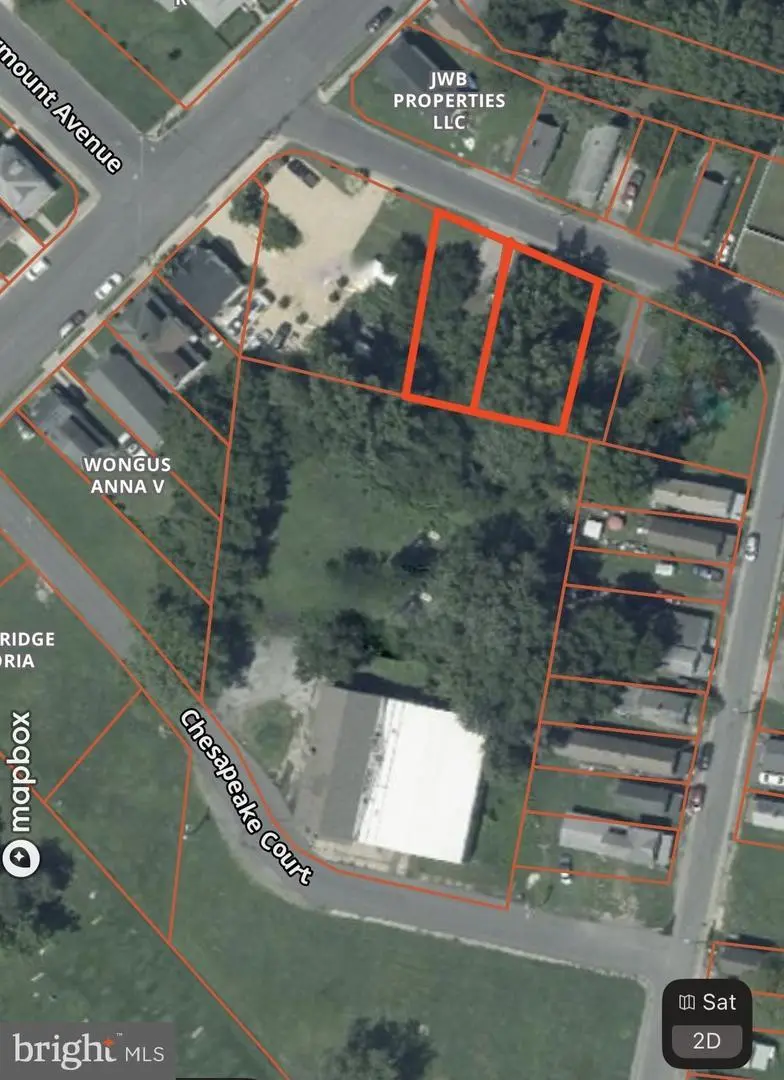
618 & 620 Cross St · Cambridge, MD
Flood risk 1/10 · Minimal
- FEMA flood zone
- X (unshaded)
- Chance of flooding over 30 yrs
- 0.0%
- Est. flood insurance / yr
- $507 – $1,088
Fire risk 2/10 · Minimal
- Est. fire insurance / yr
- $755 – $1,403
Heat risk 9/10 · Severe
- Hot days now (above 105°F)
- 7 days/yr
- Hot days in 30 yrs
- 16 days/yr
Wind risk 6/10 · Moderate
- Chance of severe wind over 30 yrs
- 73.0%
Air-quality risk 3/10 · Minor
- Unhealthy air days now
- 2 days/yr
- Unhealthy air days in 30 yrs
- 3 days/yr
Risk factors via First Street. Map © Google.
Why this score? — see what drove the B grade
The composite is a weighted blend of 9 inputs, each scored 0–100. Each bar is that input's sub-score; the figure is the points it added to the 100-point composite (weight × sub-score).
- Cash flow +30.0/30.0
- ARV discount +15.0/15.0
- 1% rule +10.0/10.0
- DSCR +10.0/10.0
- Livability +3.2/5.0
- Rent growth +2.5/5.0
- Condition / age +2.5/5.0
- Schools +1.5/10.0
- Appreciation +0.0/10.0
$54,900
🖨 Deal sheet 📄 Offer letter ✓ Due diligence
Listing remarks
Investment opportunity! 3 bedroom, 1 bath home in need of major renovation or possible tear down. Sale includes adjoining 620 Cross Street, a separate cleared buildable lot offering additional possibilities. Rehab the existing home, build a second home next door or enjoy the extra space for a larger yard. Great opportunity for investors, builders or anyone looking for their next project. * Enter at your own risk, portions of the flooring are rotten. Property is being sold strictly as-is. Buyer responsible for obtaining any required permits for renovation, improvements or removal of existing structure.
Key facts
- 6,400 sq ft lot
- Built 1930
- Listed 7 days
Property features AI
Finance
- Other: Fee simple ownership; Includes an additional parcel: 620 Cross Street (separate buildable lot)
Exterior
- Parking: Off-street parking
- Utilities: Public water; Public sewer; Electric service
- Home design: Detached property; Single-story entry with upper-level bedrooms
- Construction: Stick-built construction; Pillar/post/pier foundation; Storm windows
- Exterior features: Rear yard; Side yards; Porch(es)
Interior
- Kitchen: Country-style kitchen
- Bedrooms: One bedroom on the main level; Two bedrooms on the upper level
- Bathrooms: One full bathroom (on the main level)
- Heating & cooling: Electric baseboard heating; Electric hot water
- Interior features: Storm doors; Country-style kitchen; Dining area
Neighborhood map
What this means for you Summary
Snapshot
- This is a 3-bed/1.0-bath single-family listed at $55k.
Deal economics
- At list price, monthly cash flow is $1k ($12k/yr) — positive.
- The deal already cash-flows at list — no discount required.
- Meets the 1% rule at list price ($2k rent vs $55k).
- Cap rate 28.6% vs local median 4.2% in Cambridge — top-decile yield for the area; either an underpriced asset or a hidden risk that comps aren't pricing in. Stress-test before assuming the spread holds.
Location & tenants
- Location reads 65/100 on livability (#255 in MD) — a middle-class / working-renter tenant base. Strengths: cost of living A+, health & safety A+, housing B+; Watch: amenities D, schools F, crime F.
- Dorchester County Public Schools (rural): math 10% / reading 23% proficiency, ranked #23 of 24 in MD (top 96%) — low school quality limits family demand, transient renter base, plan for 1-2y turnover.
- Market conditions: 292 active listings in the ZIP; 81 units permitted in Dorchester County in 2024 (0 in 5+ unit buildings).
Forward outlook
- Local home prices are declining (-3.0%/yr); year-one equity from $380 of loan paydown is wiped out by about $2k of value loss. Plan a longer hold.
- Dorchester County population projected to shrink 10% by 2050 — rents likely to lag national; underwrite the cash flow, not the appreciation.
- At projected returns (-3.0% appreciation + 3.0% rent growth), your $15k cash investment doubles in ~2 years — after that, you're playing with house money.
Negotiation context
- Only 8 days on market — expect competitive offers; lowballing is unlikely to land.
- 2 sale attempts since 24y ago; this cycle's ask is 223% above the opening price — seller raised mid-cycle; expect resistance to lowballs.
- Current owner paid $15k; list at $55k implies a 266% gain — meaningful room to come down on a strong offer.
Risks & watch-outs
- Watch-outs: built in 1930 — expect roof / HVAC / electrical / plumbing capex.
- Climate carrying-cost: major wind risk, 73% chance of damaging wind over 30y; extreme-heat days projected 7→16/yr by 2055 (HVAC capex compounding) — expect insurance premiums to compound above CPI over the hold.
Questions for the listing agent
- Built in 1930 — when were the roof, HVAC, electrical panel, plumbing, and water heater last replaced?
- Is there a deadline driving the sale (1031 exchange, divorce, estate, relocation)? That informs how much negotiation room exists.
- Schools are F-rated, which usually means shorter tenancies and higher turnover. Who's the typical renter profile here, and what's been the actual vacancy rate?
- Crime grade is F in this area — have there been break-ins, vandalism, or insurance claims at this property in the last 3 years? What carrier currently insures it and at what premium?
- What's the average days-on-market for RENTAL listings here right now (not sales)? A rising rental-DOM trend means longer vacancies and softer asking-rent achievability than the comps imply.
- What's the recent tenant-quality profile in this submarket — average credit score on applications, eviction rate, late-payment / NSF rate, and stable-employment percentage? A property-management company in the area should have these aggregated.
- How much new for-sale + rental construction is in the pipeline within 1–3 miles? Heavy new supply typically softens prices + rents 12–24 months out; constrained supply supports both.
Investment metrics
- 1% rule
- 3.18% ✓
- Cap rate
- 28.60%
- Cash-on-cash
- 79.66%
- DSCR
- 4.54
- GRM
- 2.6
CMA / ARV
- ARV (on-the-fly)
- $95,892
- Comps found
- 12
Show comp detail 12 sales within ~0.75 mi
| Address | Dist | Beds/Ba | Sqft | Sold | Price | $/sf | Match |
|---|---|---|---|---|---|---|---|
| 622 Washington St | 0.23mi | 3/1.0 | 768 (+5%) | 3mo | $114,000 | $148 | 78 |
| 814 Center St | 0.28mi | 2/1.0 (-1) | 696 (-5%) | 1mo | $58,300 | $84 | 73 |
| 810 Center St | 0.27mi | 2/1.0 (-1) | 696 (-5%) | 2mo | $67,840 | $97 | 73 |
| 909 Pine St | 0.34mi | 2/1.0 (-1) | 672 (-8%) | 2mo | $64,900 | $97 | 64 |
| 810 Washington St | 0.32mi | 2/1.0 (-1) | 672 (-8%) | 4mo | $89,000 | $132 | 64 |
| 1105 Holland Ave | 0.58mi | 2/1.0 (-1) | 752 (+3%) | 1mo | $190,000 | $253 | 63 |
| 818 Washington St | 0.33mi | 2/1.0 (-1) | 672 (-8%) | 7mo | $80,000 | $119 | 60 |
| 601 Moores Ave | 0.34mi | 2/1.0 (-1) | 648 (-12%) | 2mo | $59,500 | $92 | 58 |
| 605 Robbins St | 0.31mi | 2/1.0 (-1) | 648 (-12%) | 5mo | $85,000 | $131 | 57 |
| 427 Camper St | 0.26mi | 2/1.0 (-1) | 624 (-15%) | 11mo | $77,000 | $123 | 49 |
| 411 Linden Ave | 0.40mi | 3/2.5 | 816 (+12%) | 14mo | $220,000 | $270 | 45 |
| 507 Burton Ave | 0.67mi | 2/1.0 (-1) | 816 (+12%) | 10mo | $200,000 | $245 | 36 |
Match score weights: distance 35% · size 25% · config 20% · recency 20%. Top-matched comps best support the ARV.
Projected returns pro-forma
-3.0% appreciation · 3.0% rent growth · sell at horizon
- IRR
- 79.8%
- Equity multiple
- 4.65×
- Total profit
- $56,112
- Equity at exit
- $8,186
- IRR
- 83.3%
- Equity multiple
- 9.63×
- Total profit
- $132,610
- Equity at exit
- $4,747
Cash invested: $15,372 (down + closing). Projections, not guarantees.
Landlord ↔ Tenant lean methodology
- Overall (STATE)
- 27 Tenant-Leaning
- State Maryland
- 27 Tenant-Leaning · D+14
- County
- — inherits STATE
- City
- — inherits STATE
ZIP-level market 21613
- Home prices YoY
- -25.1%
- Active inventory
- 292
- Price-to-rent
- 2.6×
Monthly cashflow live
- Estimated rent
- $1,748 medium interval (Pro) →
- Mortgage (P&I)
- −$288
- Tax from tax record
- −$50 /mo · $595/yr
- Insurance
- −$23
- HOA
- −$0
- Vacancy / Maint / Mgmt
- −$367
- Net cashflow
- $1,020
Break-even live
UW: 25.0% down · 7.5% · 30yr · 1.5% tax · 5.0% vac · 8.0% maint · 8.0% mgmt
Financing live
Cash to close
- Down payment
- $13,725
- Closing costs
- $1,647
- Reserves months
- —
- Total cash needed
- —
Loan-product check · same deal, 3 products live
Conventional
25% down · 7.5% · 30yr
- Down + closing
- —
- Monthly P&I
- —
- Monthly cashflow
- —
- DSCR
- —
- Eligible?
- —
Personal DTI + credit; lowest rate.
DSCR
20% down · 8.5% · 30yr
- Down + closing
- —
- Monthly P&I
- —
- Monthly cashflow
- —
- DSCR
- —
- Eligible?
- —
No personal income docs; deal must DSCR.
Hard money
10% down · 12.0% · 12mo
- Down + closing
- —
- Monthly P&I
- —
- Monthly cashflow
- —
- DSCR
- —
- Eligible?
- —
Short-term bridge; refi at stabilization.
Listing history 9 events
-
2026-06-18days on market $54,900 Active 8 DOM
-
2026-06-17days on market $54,900 Active 7 DOM
-
2026-06-16days on market $54,900 Active 6 DOM
-
2026-06-15days on market $54,900 Active 5 DOM
-
2026-06-13days on market $54,900 Active 3 DOM
-
2026-06-12status $54,900 Active 2 DOM
-
2026-06-09days on market $54,900 Coming Soon 2 DOM
-
2026-06-07remarks 608-char remark
-
2026-06-07$54,900 Coming Soon 1 DOM
ⓘ Source: listings_history table (triggers on properties + properties_extension) + one-shot
backfill from property_details.listing_events for pre-trigger history.
Tax reassessment forecast MD · Partial reset (capped growth)
- Current annual tax
- $595 · $50/mo
- Projected year-2 tax
- $597 · $50/mo
- Expected delta
- +$2/yr ($0/mo · 0.3%)
ⓘ Screening estimate from a state-policy table — verify with the county assessor before closing.
Climate risk First Street
- Flood 1/10 Low FEMA zone X (unshaded) · 0% chance over 30 yrs
- Wildfire 2/10 Low
- Heat 9/10 Extreme 7 d/yr ≥105°F today · 16 d/yr by 30 yrs out
- Wind 6/10 Major 73% chance of damaging wind over 30 yrs
- Air quality 3/10 Moderate 2 unhealthy d/yr today · 3 by 30 yrs out
Nearby sold comps map
Loading sold comps map…
Walkable amenities ~0.75 mi
Loading nearby amenities…
Taxation est. · year 1
- Rental income
- $20,975
- − Mortgage interest
- −$3,075
- − Property taxes
- −$595
- − Insurance
- −$274
- − Repairs & maintenance
- −$1,678
- − Management
- −$1,678
- − Depreciation
- −$1,597
- Taxable income
- $12,077
- Est. tax owed @ 24.0%
- −$2,898
- After-tax cash flow
- $9,347/yr
For passive investors: Depreciation is non-cash, so a rental often shows a tax loss while cash-flowing — sheltering income. Rental losses are passive: they offset passive income freely, and up to $25,000/yr can offset ordinary (W-2) income if you actively participate and your MAGI is under $100k (phasing out to $0 by $150k); unused losses carry forward. On sale, claimed depreciation is recaptured at up to 25%, and gains may owe capital-gains tax (a 1031 exchange can defer both). Figures are a year-1 estimate at your 24.0% rate — not tax advice; consult a CPA.
Schools (NCES district)
- District
- Dorchester County Public Schools
- NCES district ID
- 2400300
- Math proficiency
- 10% ▼ -14.00%
- Reading proficiency
- 23% ▼ -12.00%
- Median HH income
- $46,767
- Composite
- 14.65/100
- National rank
- #9404
- State rank
- #23 of 24 in MD
Livability — Cambridge
- Score
- 65/100
- State rank
- #255
- US rank
- #13046
Category grades
Schools grade is shown separately in the Schools card above.
Census & demographics
- Census place
- Cambridge, MD
- Population (ZIP)
- 18,167
Population outlook (Dorchester County) Hauer SSP2
- Today (2025)
- 31,699 people
- By 2030
- 31,054 · -2.0%
- By 2040
- 29,712 · -6.3%
- By 2050
- 28,618 · -9.7%
- By 2075
- 28,436 · -10.3%
- By 2100
- 28,937 · -8.7%
Race, ethnicity, and origin ACS 2023
- Neighborhood character
- Diverse neighborhood (Simpson 0.62)
- Race & ethnicity
- White 52% Black 33% Two or more races 10% Hispanic / Latino 6% Asian 2%
- Hispanic origin (detail)
- Puerto Rican 3%
- Common ancestry
- Romanian 1% Lithuanian 1% Italian 1%
- Foreign-born
- 4% · Canada
- Languages at home
- 95% English-only · Spanish 3% Other Indo-European 1% German/W. Germanic 1%
Political lean MEDSL · Dorchester
- 2024 margin
- R (+14.6) · D 41.6% · R 56.1% · Other 2.3%
- 2008→2024 swing
- -6.3pp toward R · 2008: -8.2pp · 2024: -14.6pp
- All cycles
- 2024: R+14.6 2020: R+11.9 2016: R+16.0 2012: R+6.6 2008: R+8.2
Not yet ingested
- Civics
- —
Market trends
- HPI YoY
- ▼ -91.03%
- Current HPI
- 271.1127
- Rent YoY
- —
- Metro
- —
- State GDP YoY
- ▲ 2.97%
- F500 in state
- 12
Industry mix (Fortune 500 HQ in MD)
| Industry | F500 HQs | Revenue |
|---|---|---|
| Aerospace / Defense | 1 | $71B |
|
||
| Utilities | 1 | $25B |
|
||
| Hotels | 1 | $24B |
|
||
| Consumer Goods | 1 | $7B |
|
||
| Real Estate | 1 | $6B |
|
||
| Chemicals | 1 | $2B |
|
||
Price history
+222.9% since first listed7 events — show timeline
- 2026-06-07 Coming Soon $54,900 BRIGHT MLS
- 2004-06-30 Sold (Public Records) $15,000 Public Records
- 2003-12-05 Sold (MLS) $15,000 MRIS
- 2003-10-28 Delisted — MRIS
- 2003-10-24 Listed $17,000 MRIS
- 2003-03-27 Delisted — MRIS
- 2002-04-08 Listed — MRIS
Property tax history
+4.3%/yrLatest (2025): $595 · +15.2% YoY. Source: county tax records.
Cash-flow waterfall
monthlySold comps — $/sqft
last 12 mo · ≤1 miLoading sold comps…