 Multi-family
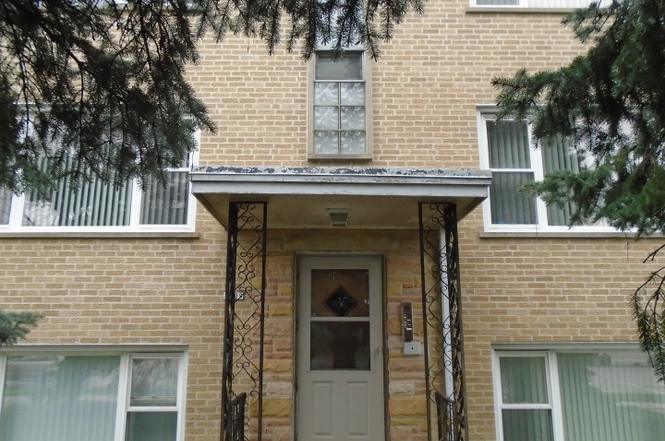
8509 N Milwaukee Ave · Niles, IL
Flood risk 1/10 · Minimal
- FEMA flood zone
- X (unshaded)
- Chance of flooding over 30 yrs
- 0.0%
- Est. flood insurance / yr
- $473 – $860
Fire risk 1/10 · Minimal
- Est. fire insurance / yr
- $804 – $1,492
Heat risk 3/10 · Minor
- Hot days now (above 99°F)
- 7 days/yr
- Hot days in 30 yrs
- 14 days/yr
Wind risk 2/10 · Minimal
- Chance of severe wind over 30 yrs
- 0.0%
Air-quality risk 4/10 · Minor
- Unhealthy air days now
- 6 days/yr
- Unhealthy air days in 30 yrs
- 7 days/yr
Risk factors via First Street. Map © Google.
Why this score? — see what drove the F grade
The composite is a weighted blend of 9 inputs, each scored 0–100. Each bar is that input's sub-score; the figure is the points it added to the 100-point composite (weight × sub-score).
- ARV discount +7.5/15.0
- Livability +4.2/5.0
- Schools +3.4/10.0
- Rent growth +2.5/5.0
- Condition / age +2.5/5.0
- Cash flow +0.7/30.0
- 1% rule +0.0/10.0
- DSCR +0.0/10.0
- Appreciation +0.0/10.0
$875,000
🖨 Deal sheet 📄 Offer letter ✓ Due diligence
Multi-family units
County records classify this as Multi-Family (5+ Unit). Listing-text estimate: 1 unit. estimate disagrees with records
5+ unit building — per-unit beds/baths from public records are typically unavailable; the breakdown below (if shown) is an estimate from the listing text.
Listing remarks
6 FLAT WITH ALL 1 BEDROOM UNITS. VERY LOW RENTS DUE TO LONG TERM TENANTS. NEW ROOF, NEWER WINDOWS AND RECENT TUCKPOINT. COPPER PLUMBING TOO. TENANTS PAY THEIR OWN COOKING GAS. GREAT RESIDENTIAL NEIGHBORHOOD WITH SINGLE FAMILY HOMES BEHIND THE BUILDING PLUS EXTRA PARKING ON MILWAUKEE. NILES FREE BUS SERVICE GREAT FOR TENANTS WHO DONT DRIVE. LONG TIME ELDERLY OWNER SELLING AS IS! Large down payment or cash. NO pro rata loans.
Key facts
- Built 1961
- Listed 73 days
Property features AI
Finance
- Other: Property listed as a multi-family (6 units); No conversion recorded
- Financial info: Gross income reported as $61,980 annually; Total monthly income reported as $5,165; Expense examples: water/sewer $1,942, electric $349, trash $1,160, insurance $4,195 (period not specified)
Exterior
- Utilities: Electric with circuit breakers
- Home design: Multi-family property (5+ units); Six total units; Hip roof
- Construction: Brick construction; Built before 1978
- Exterior features: Lot dimensions recorded as 5,875 (source: County Records); Zoned OTHER
Interior
- Kitchen: Six ranges in the building
- Bedrooms: One bedroom per unit (unit-level info)
- Bathrooms: One full bathroom per unit
- Heating & cooling: Central building heating; Wall sleeve cooling
- Interior features: Central building heat; Wall sleeve cooling
- Laundry & utility: One washer and one dryer in the building
Neighborhood map
What this means for you Summary
Snapshot
- This is a 12-bed/6.0-bath multifamily listed at $875k.
Deal economics
- At list price, monthly cash flow is $-4k ($-45k/yr) — negative.
- To cash-flow at today's rent, offer at most $350k (59.9% below list).
- To meet the 1% rule (rent ≥ 1% of price), the offer needs to be $338k (61.3% below list).
- Recommended offer: $338k (61.3% below list) — sets the bar for 1% rule.
- Cap rate 1.2% vs local median 4.4% in Niles — below-typical yield; the buyer is paying a premium for something (appreciation thesis, condition, location) that the cap rate doesn't capture.
Location & tenants
- Location reads 83/100 on livability (#53 in IL, #1,001 nationally) — a professional / high-income tenant draw. Strengths: commute A+, amenities A, housing A; Watch: schools C-, health & safety D+.
- Maine Township Hsd 207 (suburban): math 34% / reading 39% proficiency, ranked #143 of 620 in IL (top 23%) — families likely to look elsewhere, expect single-tenant / working-renter base with shorter leases.
- Market conditions: 30 active listings in the ZIP; solid renter incomes; 6,272 units permitted in Cook County in 2024 (4,658 in 5+ unit buildings).
- At $3,382/mo this rent would consume 54% of the median local household income ($76k/yr) (locally 747% of renters already pay >50% of income on rent) — very limited rent-growth headroom before tenants either downsize or default.
Forward outlook
- Local home prices are declining (-3.0%/yr); year-one equity from $6k of loan paydown is wiped out by about $26k of value loss. Plan a longer hold.
Negotiation context
- It's been on market 73 days — a 6% lower offer ($822k) is reasonable based on typical stale-listing flexibility.
Questions for the listing agent
- What do current leases actually rent for vs. the listed asking? Can we see a recent rent roll and the last 12 months of T-12 income?
- It's been on market 73 days. Have you received any prior offers? Is the seller open to a 61% concession, seller financing, or rate buy-down credit?
- Built in 1961 — when were the roof, HVAC, electrical panel, plumbing, and water heater last replaced?
- Why hasn't it sold? Are there any deal-killer items the seller is aware of (foundation, flood, title, zoning, code violations)?
- Is there a deadline driving the sale (1031 exchange, divorce, estate, relocation)? That informs how much negotiation room exists.
- The area grade is low — what's the realistic commute time and amenity access for the typical tenant pool here? Any planned neighborhood developments (good or bad) we should know about?
- What's the average days-on-market for RENTAL listings here right now (not sales)? A rising rental-DOM trend means longer vacancies and softer asking-rent achievability than the comps imply.
- What's the recent tenant-quality profile in this submarket — average credit score on applications, eviction rate, late-payment / NSF rate, and stable-employment percentage? A property-management company in the area should have these aggregated.
- How much new apartment / multifamily construction is in the pipeline within 1–3 miles? Heavy new supply (>2% of stock underway) typically softens rents 12–24 months out; light construction supports rent growth.
Investment metrics
- 1% rule
- 0.39% ✗
- Cap rate
- 1.16%
- Cash-on-cash
- -18.33%
- DSCR
- 0.18
- GRM
- 21.6
CMA / ARV
No comps found within radius.
Projected returns pro-forma
-3.0% appreciation · 3.0% rent growth · sell at horizon
- IRR
- -53.2%
- Equity multiple
- -0.55×
- Total profit
- $-379,816
- Equity at exit
- $130,465
- IRR
- —
- Equity multiple
- -1.60×
- Total profit
- $-636,470
- Equity at exit
- $75,654
Cash invested: $245,000 (down + closing). Projections, not guarantees.
Landlord ↔ Tenant lean methodology
- Overall (STATE)
- 43 Moderately Tenant-Leaning
- State Illinois
- 43 Moderately Tenant-Leaning · D+7
- County
- — inherits STATE
- City
- — inherits STATE
ZIP-level market 60714
- Active inventory
- 30
- Price-to-rent
- 21.6×
Monthly cashflow live
- Estimated rent
- $3,382 medium interval (Pro) →
- Mortgage (P&I)
- −$4,589
- Tax from tax record
- −$1,460 /mo · $17,524/yr
- Insurance
- −$365
- HOA
- −$0
- Vacancy / Maint / Mgmt
- −$710
- Net cashflow
- $-3,742
Break-even live
UW: 25.0% down · 7.5% · 30yr · 1.5% tax · 5.0% vac · 8.0% maint · 8.0% mgmt
Financing live
Cash to close
- Down payment
- $218,750
- Closing costs
- $26,250
- Reserves months
- —
- Total cash needed
- —
Loan-product check · same deal, 3 products live
Conventional
25% down · 7.5% · 30yr
- Down + closing
- —
- Monthly P&I
- —
- Monthly cashflow
- —
- DSCR
- —
- Eligible?
- —
Personal DTI + credit; lowest rate.
DSCR
20% down · 8.5% · 30yr
- Down + closing
- —
- Monthly P&I
- —
- Monthly cashflow
- —
- DSCR
- —
- Eligible?
- —
No personal income docs; deal must DSCR.
Hard money
10% down · 12.0% · 12mo
- Down + closing
- —
- Monthly P&I
- —
- Monthly cashflow
- —
- DSCR
- —
- Eligible?
- —
Short-term bridge; refi at stabilization.
Listing history 18 events
-
2026-06-18days on market $875,000 Active 73 DOM
-
2026-06-17status $875,000 Active 72 DOM
-
2026-06-17remarks 427-char remark
-
2026-06-17days on market $875,000 Contingent - Continue to Show 72 DOM
-
2026-06-16days on market $875,000 Contingent - Continue to Show 71 DOM
-
2026-06-16remarks 376-char remark
-
2026-06-15days on market $875,000 Contingent - Continue to Show 70 DOM
-
2026-06-13days on market $875,000 Contingent - Continue to Show 68 DOM
-
2026-06-13days on market $875,000 Contingent - Continue to Show 67 DOM
-
2026-06-09days on market $875,000 Contingent - Continue to Show 64 DOM
-
2026-06-08days on market $875,000 Contingent - Continue to Show 63 DOM
-
2026-06-07days on market $875,000 Contingent - Continue to Show 62 DOM
-
2026-06-04days on market $875,000 Contingent - Continue to Show 59 DOM
-
2026-06-03days on market $875,000 Contingent - Continue to Show 58 DOM
-
2026-06-02days on market $875,000 Contingent - Continue to Show 57 DOM
-
2026-06-01days on market $875,000 Contingent - Continue to Show 56 DOM
-
2026-05-31days on market $875,000 Contingent - Continue to Show 55 DOM
-
2026-04-11historical Contingent - Continue to Show
ⓘ Source: listings_history table (triggers on properties + properties_extension) + one-shot
backfill from property_details.listing_events for pre-trigger history.
Tax reassessment forecast IL · Partial reset (capped growth)
- Current annual tax
- $17,524 · $1,460/mo
- Projected year-2 tax
- $18,693 · $1,558/mo
- Expected delta
- +$1,169/yr (+$97/mo · 6.7%)
ⓘ Screening estimate from a state-policy table — verify with the county assessor before closing.
Climate risk First Street
- Flood 1/10 Low FEMA zone X (unshaded) · 0% chance over 30 yrs
- Wildfire 1/10 Low
- Heat 3/10 Moderate 7 d/yr ≥99°F today · 14 d/yr by 30 yrs out
- Wind 2/10 Low 0% chance of damaging wind over 30 yrs
- Air quality 4/10 Moderate 6 unhealthy d/yr today · 7 by 30 yrs out
Nearby sold comps map
Loading sold comps map…
Walkable amenities ~0.75 mi
Loading nearby amenities…
Taxation est. · year 1
- Rental income
- $40,586
- − Mortgage interest
- −$49,014
- − Property taxes
- −$17,524
- − Insurance
- −$4,375
- − Repairs & maintenance
- −$3,247
- − Management
- −$3,247
- − Depreciation
- −$25,455
- Taxable loss
- −$62,275
- Est. tax savings @ 24.0%
- +$14,946
- After-tax cash flow
- $-29,953/yr
For passive investors: Depreciation is non-cash, so a rental often shows a tax loss while cash-flowing — sheltering income. Rental losses are passive: they offset passive income freely, and up to $25,000/yr can offset ordinary (W-2) income if you actively participate and your MAGI is under $100k (phasing out to $0 by $150k); unused losses carry forward. On sale, claimed depreciation is recaptured at up to 25%, and gains may owe capital-gains tax (a 1031 exchange can defer both). Figures are a year-1 estimate at your 24.0% rate — not tax advice; consult a CPA.
Schools (NCES district)
- District
- Maine Township Hsd 207
- NCES district ID
- 1724090
- Math proficiency
- 34% ▼ -13.00%
- Reading proficiency
- 39% ▼ -7.00%
- Median HH income
- $79,034
- Composite
- 34.36/100
- National rank
- #5220
- State rank
- #143 of 620 in IL
Livability — Niles
- Score
- 83/100
- State rank
- #53
- US rank
- #1001
Category grades
Schools grade is shown separately in the Schools card above.
Census & demographics
- Census place
- Niles, IL
- County
- Cook County · 4,486,803 people
- City population
- 30,305
- Metro
- Chicago-Naperville-Elgin, IL-IN-WI
- Population (ZIP)
- 30,305
- Household income
- $75,800
- Rent vs Own
- Severe rent burden
- 747.0
Population outlook (Cook County) Hauer SSP2
- Today (2025)
- 5,347,519 people
- By 2030
- 5,357,703 · +0.2%
- By 2040
- 5,324,924 · -0.4%
- By 2050
- 5,230,762 · -2.2%
- By 2075
- 4,785,735 · -10.5%
- By 2100
- 4,188,836 · -21.7%
Race, ethnicity, and origin ACS 2023
- Neighborhood character
- Diverse neighborhood (Simpson 0.56)
- Race & ethnicity
- White 61% Asian 20% Hispanic / Latino 14% Two or more races 8% Black 2%
- Hispanic origin (detail)
- Mexican 9% Puerto Rican 1%
- Common ancestry
- Romanian 16% American 2% Scandinavian 2%
- Foreign-born
- 43% · Canada, South Korea, Vietnam
- Languages at home
- 40% English-only · Russian/Polish/Slavic 15% Other Indo-European 13% Spanish 11%
Political lean MEDSL · Cook
- 2024 margin
- Solid D (+42.0) · D 70.4% · R 28.4% · Other 1.2%
- 2008→2024 swing
- -11.4pp toward R · 2008: 53.4pp · 2024: 42.0pp
- All cycles
- 2024: D+42.0 2020: D+50.3 2016: D+53.0 2012: D+49.4 2008: D+53.4
Not yet ingested
- Civics
- —
Market trends
- HPI YoY
- ▼ -171.58%
- Current HPI
- 197.8728
- Rent YoY
- —
- Metro
- Chicago-Naperville-Elgin, IL-IN-WI
- State GDP YoY
- ▲ 1.59%
- F500 in state
- 60
Industry mix (Fortune 500 HQ in IL)
| Industry | F500 HQs | Revenue |
|---|---|---|
| Insurance | 4 | $201B |
|
||
| Consumer Goods | 4 | $87B |
|
||
| Industrial Machinery | 3 | $64B |
|
||
| Healthcare | 2 | $55B |
|
||
| Retail / Pharmacy | 1 | $148B |
|
||
| Agriculture / Food | 1 | $86B |
|
||
Property tax history
+3.6%/yrLatest (2023): $17,524 · +2.5% YoY. Source: county tax records.
Cash-flow waterfall
monthlySold comps — $/sqft
last 12 mo · ≤1 miLoading sold comps…