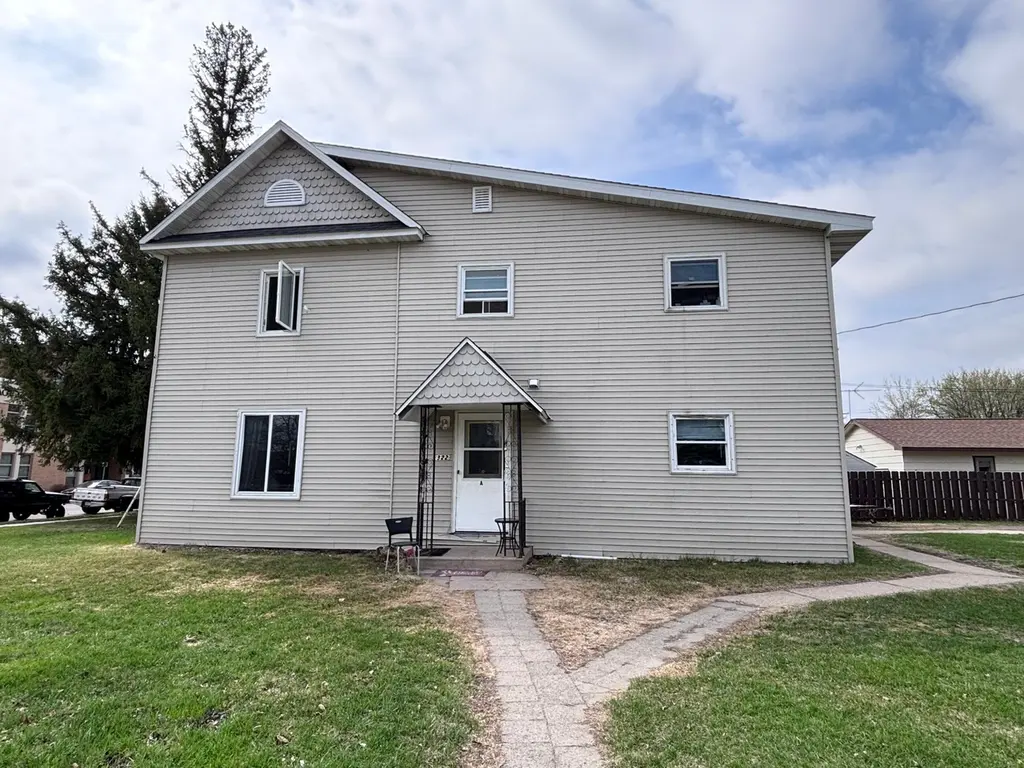
322 5th Ave E · Alexandria, MN
Flood risk 1/10 · Minimal
- FEMA flood zone
- X (unshaded)
- Chance of flooding over 30 yrs
- 0.0%
- Est. flood insurance / yr
- $473 – $860
Fire risk 1/10 · Minimal
- Est. fire insurance / yr
- $888 – $1,650
Heat risk 2/10 · Minimal
- Hot days now (above 95°F)
- 7 days/yr
- Hot days in 30 yrs
- 13 days/yr
Wind risk 2/10 · Minimal
- Chance of severe wind over 30 yrs
- —
Air-quality risk 2/10 · Minimal
- Unhealthy air days now
- 2 days/yr
- Unhealthy air days in 30 yrs
- 2 days/yr
Risk factors via First Street. Map © Google.
Why this score? — see what drove the D grade
The composite is a weighted blend of 9 inputs, each scored 0–100. Each bar is that input's sub-score; the figure is the points it added to the 100-point composite (weight × sub-score).
- Cash flow +13.8/30.0
- ARV discount +7.5/15.0
- Schools +4.8/10.0
- DSCR +4.2/10.0
- Livability +3.9/5.0
- 1% rule +3.7/10.0
- Rent growth +2.5/5.0
- Condition / age +2.5/5.0
- Appreciation +0.0/10.0
$219,900
🖨 Deal sheet 📄 Offer letter ✓ Due diligence
Listing remarks MLS
Duplex! Interested in becoming an investor? Here is a great opportunity to purchase a spacious and well maintained duplex located on a large corner lot in the heart of Alexandria complete with a 3-car garage. Both units are fully leased. Upper unit rents for $1200/month and the main floor unit rents for $1050/month. That's $27,000 year in rental income! This property has vinyl siding, newer windows and furnaces and coin-operated laundry in the back entry. Each unit has 1440 sq. ft. Owner pays for utilities.
Key facts
- Updated furnaces
- Large corner lot
- Newer windows
Tags
Property features AI
Finance
- Other: Property listed as non-owner occupied; Two units (each approx. 1,440 sq ft); Lot dimensions: 150 x 68 x 150 x 68
- Financial info: Gross income listed at $29,400; Insurance expense listed at $1,500; Other operating expenses reported (water/sewer, fuel, electric, trash, maintenance, other) with nominal placeholder amounts
- HOA & community: Association laundry amenity
Exterior
- Parking: Attached garage with 3 spaces
- Utilities: City water (connected); City sewer (connected); Natural gas
- Home design: Residential income property (duplex, up-and-down); Two levels
- Construction: Brick and frame construction; Brick/mortar foundation
- Exterior features: Vinyl exterior; No fencing
Interior
- Kitchen: Unit appliances include a rented water softener
- Bedrooms: 7 total bedrooms (distributed across two units)
- Bathrooms: Unit 1: 1 full bath; Unit 2: 2 baths (including two three-quarter baths)
- Heating & cooling: Forced air heating
- Interior features: Partial unfinished basement; Ceiling fan(s)
- Laundry & utility: Shared laundry area on the main level
Neighborhood map
What this means for you Summary
Snapshot
- This is a 8-bed/3.0-bath other listed at $220k.
Deal economics
- At list price, monthly cash flow is $18 ($219/yr) — positive.
- The deal already cash-flows at list — no discount required.
- To meet the 1% rule (rent ≥ 1% of price), the offer needs to be $191k (13.0% below list).
- Recommended offer: $191k (13.0% below list) — sets the bar for 1% rule.
- Cap rate 6.4% vs local median 2.5% in Alexandria — top-decile yield for the area; either an underpriced asset or a hidden risk that comps aren't pricing in. Stress-test before assuming the spread holds.
Location & tenants
- Location reads 78/100 on livability (#105 in MN, #2,409 nationally) — a middle-class / working-renter tenant base. Strengths: cost of living A+, housing A+, health & safety A+; Watch: amenities D, commute F.
- Alexandria Public School District (town): math 55% / reading 57% proficiency, ranked #64 of 301 in MN (top 21%) — acceptable for families but not a draw, mixed tenant base, ~2y average lease.
- Market conditions: 402 active listings in the ZIP; solid renter incomes; 285 units permitted in Douglas County in 2024 (88 in 5+ unit buildings).
Forward outlook
- Local home prices are declining (-3.0%/yr); year-one equity from $2k of loan paydown is wiped out by about $7k of value loss. Plan a longer hold.
- Douglas County population projected at +5% by 2050 — modest demand growth; plan on rents tracking national, not racing it.
Negotiation context
- It's been on market 56 days — a 3% lower offer ($213k) is reasonable based on typical stale-listing flexibility.
- 5 sale attempts since 14y ago with the ask held roughly flat each time — persistent listings suggest the price (not the market) is what's stuck; bring a comps-based counter.
- Current owner paid $160k; 38% above their basis — modest negotiation headroom, anchor on the comps not their cost.
Risks & watch-outs
- Watch-outs: built in 1900 — expect roof / HVAC / electrical / plumbing capex.
Questions for the listing agent
- It's been on market 56 days. Have you received any prior offers? Is the seller open to a 13% concession, seller financing, or rate buy-down credit?
- Built in 1900 — when were the roof, HVAC, electrical panel, plumbing, and water heater last replaced?
- Is there a deadline driving the sale (1031 exchange, divorce, estate, relocation)? That informs how much negotiation room exists.
- Schools are B-rated — typically a magnet for longer-tenancy family renters. What's the average tenant stay here, and is there a school-zone premium baked into asking?
- The area grade is low — what's the realistic commute time and amenity access for the typical tenant pool here? Any planned neighborhood developments (good or bad) we should know about?
- What's the average days-on-market for RENTAL listings here right now (not sales)? A rising rental-DOM trend means longer vacancies and softer asking-rent achievability than the comps imply.
- What's the recent tenant-quality profile in this submarket — average credit score on applications, eviction rate, late-payment / NSF rate, and stable-employment percentage? A property-management company in the area should have these aggregated.
- How much new for-sale + rental construction is in the pipeline within 1–3 miles? Heavy new supply typically softens prices + rents 12–24 months out; constrained supply supports both.
Investment metrics
- 1% rule
- 0.87% ✗
- Cap rate
- 6.39%
- Cash-on-cash
- 0.36%
- DSCR
- 1.02
- GRM
- 9.6
CMA / ARV
No comps found within radius.
Projected returns pro-forma
-3.0% appreciation · 3.0% rent growth · sell at horizon
- IRR
- -15.7%
- Equity multiple
- 0.44×
- Total profit
- $-34,458
- Equity at exit
- $32,788
- IRR
- -7.3%
- Equity multiple
- 0.54×
- Total profit
- $-28,455
- Equity at exit
- $19,013
Cash invested: $61,572 (down + closing). Projections, not guarantees.
Landlord ↔ Tenant lean methodology
- Overall (STATE)
- 46 Balanced
- State Minnesota
- 46 Balanced · D+2
- County
- — inherits STATE
- City
- — inherits STATE
ZIP-level market 56308
- Active inventory
- 402
- Price-to-rent
- 9.6×
Monthly cashflow live
- Estimated rent
- $1,914 medium interval (Pro) →
- Mortgage (P&I)
- −$1,153
- Tax from tax record
- −$249 /mo · $2,988/yr
- Insurance
- −$92
- HOA
- −$0
- Vacancy / Maint / Mgmt
- −$402
- Net cashflow
- $18
Break-even live
UW: 25.0% down · 7.5% · 30yr · 1.5% tax · 5.0% vac · 8.0% maint · 8.0% mgmt
Financing live
Cash to close
- Down payment
- $54,975
- Closing costs
- $6,597
- Reserves months
- —
- Total cash needed
- —
Loan-product check · same deal, 3 products live
Conventional
25% down · 7.5% · 30yr
- Down + closing
- —
- Monthly P&I
- —
- Monthly cashflow
- —
- DSCR
- —
- Eligible?
- —
Personal DTI + credit; lowest rate.
DSCR
20% down · 8.5% · 30yr
- Down + closing
- —
- Monthly P&I
- —
- Monthly cashflow
- —
- DSCR
- —
- Eligible?
- —
No personal income docs; deal must DSCR.
Hard money
10% down · 12.0% · 12mo
- Down + closing
- —
- Monthly P&I
- —
- Monthly cashflow
- —
- DSCR
- —
- Eligible?
- —
Short-term bridge; refi at stabilization.
Listing history 25 events
-
2026-06-19days on market $219,900 Active 56 DOM
-
2026-06-18days on market $219,900 Active 55 DOM
-
2026-06-17days on market $219,900 Active 54 DOM
-
2026-06-17status $219,900 Active 53 DOM
-
2026-06-16days on market $219,900 Contingent - Inspection 53 DOM
-
2026-06-15days on market $219,900 Contingent - Inspection 52 DOM
-
2026-06-14days on market $219,900 Contingent - Inspection 50 DOM
-
2026-06-12days on market $219,900 Contingent - Inspection 49 DOM
-
2026-06-09days on market $219,900 Contingent - Inspection 46 DOM
-
2026-06-09status $219,900 Contingent - Inspection 45 DOM
-
2026-06-08days on market $219,900 Active 45 DOM
-
2026-06-07days on market $219,900 Active 44 DOM
-
2026-06-03days on market $219,900 Active 40 DOM
-
2026-06-02days on market $219,900 Active 39 DOM
-
2026-06-01days on market $219,900 Active 38 DOM
-
2026-05-31days on market $219,900 Active 37 DOM
-
2026-05-30days on market $219,900 Active 36 DOM
-
2026-04-23$219,900 Active 774-char remark
-
2017-09-08soldstatus $159,900
-
2017-08-31soldstatus $159,900 512-char remark
Show marketing remark (512 chars)
Duplex! Interested in becoming an investor? Here is a great opportunity to purchase a spacious and well maintained duplex located on a large corner lot in the heart of Alexandria complete with a 3-car garage. Both units are fully leased. Upper unit rents for $1200/month and the main floor unit rents for $1050/month. That's $27,000 year in rental income! This property has vinyl siding, newer windows and furnaces and coin-operated laundry in the back entry. Each unit has 1440 sq. ft. Owner pays for utilities.
-
2017-07-07$159,900 512-char remark
Show marketing remark (512 chars)
Duplex! Interested in becoming an investor? Here is a great opportunity to purchase a spacious and well maintained duplex located on a large corner lot in the heart of Alexandria complete with a 3-car garage. Both units are fully leased. Upper unit rents for $1200/month and the main floor unit rents for $1050/month. That's $27,000 year in rental income! This property has vinyl siding, newer windows and furnaces and coin-operated laundry in the back entry. Each unit has 1440 sq. ft. Owner pays for utilities.
-
2014-09-19historical
-
2014-09-19historical
-
2014-02-26$147,400 Active
-
2012-09-18$147,400
ⓘ Source: listings_history table (triggers on properties + properties_extension) + one-shot
backfill from property_details.listing_events for pre-trigger history.
Tax reassessment forecast MN · Partial reset (capped growth)
- Current annual tax
- $2,988 · $249/mo
- Projected year-2 tax
- $2,988 · $249/mo
- Expected delta
- $0/yr ($0/mo · 0.0%)
ⓘ Screening estimate from a state-policy table — verify with the county assessor before closing.
Climate risk First Street
- Flood 1/10 Low FEMA zone X (unshaded) · 0% chance over 30 yrs
- Wildfire 1/10 Low
- Heat 2/10 Low 7 d/yr ≥95°F today · 13 d/yr by 30 yrs out
- Wind 2/10 Low
- Air quality 2/10 Low 2 unhealthy d/yr today · 2 by 30 yrs out
Nearby sold comps map
Loading sold comps map…
Walkable amenities ~0.75 mi
Loading nearby amenities…
Taxation est. · year 1
- Rental income
- $22,968
- − Mortgage interest
- −$12,318
- − Property taxes
- −$2,988
- − Insurance
- −$1,100
- − Repairs & maintenance
- −$1,837
- − Management
- −$1,837
- − Depreciation
- −$6,397
- Taxable loss
- −$3,509
- Est. tax savings @ 24.0%
- +$842
- After-tax cash flow
- $1,061/yr
For passive investors: Depreciation is non-cash, so a rental often shows a tax loss while cash-flowing — sheltering income. Rental losses are passive: they offset passive income freely, and up to $25,000/yr can offset ordinary (W-2) income if you actively participate and your MAGI is under $100k (phasing out to $0 by $150k); unused losses carry forward. On sale, claimed depreciation is recaptured at up to 25%, and gains may owe capital-gains tax (a 1031 exchange can defer both). Figures are a year-1 estimate at your 24.0% rate — not tax advice; consult a CPA.
Schools (NCES district)
- District
- Alexandria Public School District
- NCES district ID
- 2703060
- Math proficiency
- 55% ▼ -10.00%
- Reading proficiency
- 57% ▼ -9.00%
- Median HH income
- $52,476
- Composite
- 48.0/100
- National rank
- #2197
- State rank
- #64 of 301 in MN
Livability — Alexandria
- Score
- 78/100
- State rank
- #105
- US rank
- #2409
Category grades
Schools grade is shown separately in the Schools card above.
Census & demographics
- Census place
- Alexandria, MN
- County
- Douglas County · 27,008 people
- City population
- 27,008
- Metro
- Alexandria, MN
- Population (ZIP)
- 27,008
- Household income
- $78,177
- Rent vs Own
- Severe rent burden
- 550.0
Population outlook (Douglas County) Hauer SSP2
- Today (2025)
- 38,913 people
- By 2030
- 39,636 · +1.9%
- By 2040
- 40,564 · +4.2%
- By 2050
- 40,819 · +4.9%
- By 2075
- 40,824 · +4.9%
- By 2100
- 38,379 · -1.4%
Race, ethnicity, and origin ACS 2023
- Neighborhood character
- Predominantly White (93%)
- Race & ethnicity
- White 93% Hispanic / Latino 3% Two or more races 2%
- Common ancestry
- Portuguese 22% Lithuanian 3% Romanian 3%
- Foreign-born
- 2% · Vietnam, Canada
- Languages at home
- 97% English-only · Spanish 2%
Political lean MEDSL · Douglas
- 2024 margin
- Solid R (+35.1) · D 31.7% · R 66.8% · Other 1.4%
- 2008→2024 swing
- -25.6pp toward R · 2008: -9.5pp · 2024: -35.1pp
- All cycles
- 2024: R+35.1 2020: R+32.8 2016: R+35.8 2012: R+15.5 2008: R+9.5
Not yet ingested
- Civics
- —
Market trends
- HPI YoY
- ▼ -215.15%
- Current HPI
- 189.1595
- Rent YoY
- —
- Metro
- Alexandria, MN
- State GDP YoY
- ▲ 2.41%
- F500 in state
- 34
Industry mix (Fortune 500 HQ in MN)
| Industry | F500 HQs | Revenue |
|---|---|---|
| Healthcare | 2 | $407B |
|
||
| Retail | 2 | $150B |
|
||
| Consumer Goods | 2 | $32B |
|
||
| Industrial Machinery | 2 | $6B |
|
||
| Agriculture | 1 | $40B |
|
||
| Healthcare / Medical Devices | 1 | $32B |
|
||
Price history
+49.2% since first listed10 events — show timeline
- 2026-06-16 Relisted — NORTHSTARMLS as Distributed by MLS Grid
- 2026-06-08 Contingent — NORTHSTARMLS as Distributed by MLS Grid
- 2026-04-23 Listed $219,900 NORTHSTARMLS as Distributed by MLS Grid
- 2017-09-08 Sold (Public Records) $159,900 Public Records
- 2017-08-31 Sold (MLS) $159,900 NORTHSTARMLS as Distributed by MLS Grid
- 2017-07-07 Listed $159,900 NORTHSTARMLS as Distributed by MLS Grid
- 2014-09-19 Listing Removed — NORTHSTARMLS as Distributed by MLS Grid
- 2014-09-19 Listing Removed — NORTHSTARMLS as Distributed by MLS Grid
- 2014-02-26 Listed $147,400 NORTHSTARMLS as Distributed by MLS Grid
- 2012-09-18 Listed $147,400 NORTHSTARMLS as Distributed by MLS Grid
Property tax history
+5.0%/yrLatest (2026): $2,988 · +5.7% YoY. Source: county tax records.
Cash-flow waterfall
monthlySold comps — $/sqft
last 12 mo · ≤1 miLoading sold comps…