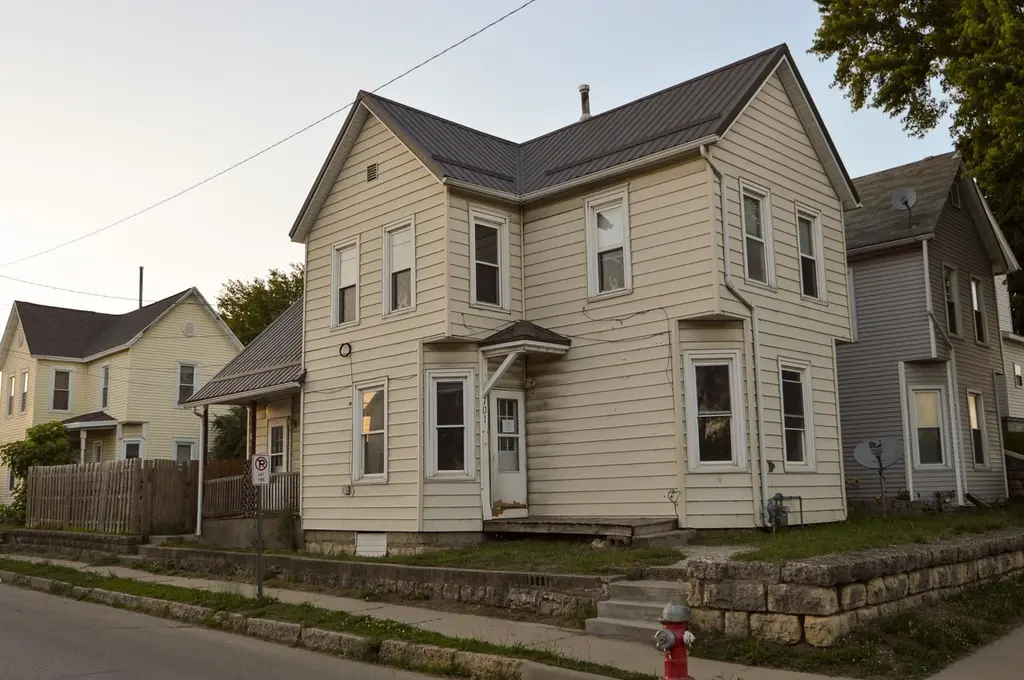
701 Garfield Ave · Dubuque, IA
Flood risk 1/10 · Minimal
- FEMA flood zone
- X (unshaded)
- Chance of flooding over 30 yrs
- 0.0%
- Est. flood insurance / yr
- $473 – $860
Fire risk 1/10 · Minimal
- Est. fire insurance / yr
- $902 – $1,676
Heat risk 3/10 · Minor
- Hot days now (above 102°F)
- 7 days/yr
- Hot days in 30 yrs
- 15 days/yr
Wind risk 2/10 · Minimal
- Chance of severe wind over 30 yrs
- —
Air-quality risk 2/10 · Minimal
- Unhealthy air days now
- 1 days/yr
- Unhealthy air days in 30 yrs
- 2 days/yr
Risk factors via First Street. Map © Google.
Why this score? — see what drove the B- grade
The composite is a weighted blend of 9 inputs, each scored 0–100. Each bar is that input's sub-score; the figure is the points it added to the 100-point composite (weight × sub-score).
- Cash flow +21.3/30.0
- ARV discount +15.0/15.0
- DSCR +6.8/10.0
- 1% rule +6.1/10.0
- Schools +5.5/10.0
- Livability +4.5/5.0
- Rent growth +3.9/5.0
- Condition / age +2.5/5.0
- Appreciation +0.0/10.0
$112,000
🖨 Deal sheet 📄 Offer letter ✓ Due diligence
Listing remarks MLS
2 bedroom, 1.5 bath home with 1200+ finished square footage. Seller has Iowa Real Estate License.
Key facts
- Fenced back yard
- Formal dining room
- Full basement
Tags
Property features AI
Exterior
- Utilities: Public water; Public sewer
- Home design: Single-family detached residence; Two stories; Residential zoning
- Construction: Stone foundation
- Exterior features: Porch; Fenced yard; Metal roof
Interior
- Kitchen: Refrigerator; Range; Microwave
- Bedrooms: Bedrooms on multiple levels
- Bathrooms: 1 full bathroom; 1 half bathroom; 1 main-level bathroom
- Heating & cooling: Central air conditioning; Forced air heating (natural gas)
- Interior features: Window treatments
- Laundry & utility: Washer included; Main-level laundry
Neighborhood map
What this means for you Summary
Snapshot
- This is a 2-bed/1.5-bath single-family listed at $112k.
Deal economics
- At list price, monthly cash flow is $164 ($2k/yr) — positive.
- The deal already cash-flows at list — no discount required.
- Meets the 1% rule at list price ($1k rent vs $112k).
- Recommended offer: $110k (1.5% below list) — sets the bar for market timing.
- Cap rate 8.0% vs local median 3.5% in Dubuque — top-decile yield for the area; either an underpriced asset or a hidden risk that comps aren't pricing in. Stress-test before assuming the spread holds.
Location & tenants
- Location reads 89/100 on livability (#7 in IA, #119 nationally) — a professional / high-income tenant draw. Strengths: amenities A+, commute A+, cost of living A+; Watch: crime C-.
- Dubuque Community School District (urban): math 63% / reading 65% proficiency, ranked #205 of 289 in IA (top 71%) — acceptable for families but not a draw, mixed tenant base, ~2y average lease.
- Zoned schools: Audubon Elementary School (math 27% / reading 27%, grade F, #607 of 616 statewide, top 99%, 281 students, 77% FRL); Hempstead High School (math 64% / reading 71%, grade B, #186 of 336 statewide, top 57%, 1,584 students, 38% FRL) — zoned schools average 58% FRL vs 32% district-wide (26 pts higher); higher-poverty schools than district average — tighter screening recommended.
- Zoned-school proficiency averages 47% at this address vs 64% district-wide (-17 pts) — the specific schools serving this property underperform the Dubuque Community School District average; the district grade overstates school quality for this exact location.
- Market conditions: Rents rising fast (+5.6%/yr); 225 active listings in the ZIP; 5 comparable units currently listed for rent nearby; rentals lingering (median 44d on market — plan ~5-8 weeks vacancy on turnover, expect pricing pressure); 100% of comp listings sitting > 30 days — soft ceiling on asking rent; 473 units permitted in Dubuque County in 2024 (319 in 5+ unit buildings).
Forward outlook
- Local home prices are declining (-3.0%/yr); year-one equity from $774 of loan paydown is wiped out by about $3k of value loss. Plan a longer hold.
- Dubuque County population projected at +13% by 2050 — modest demand growth; plan on rents tracking national, not racing it.
- At projected returns (-3.0% appreciation + 5.6% rent growth), your $31k cash investment doubles in ~10 years — after that, you're playing with house money.
Negotiation context
- It's been on market 15 days — a 2% lower offer ($110k) is reasonable based on typical stale-listing flexibility.
- 3 sale attempts since 12y ago with the ask held roughly flat each time — persistent listings suggest the price (not the market) is what's stuck; bring a comps-based counter.
Risks & watch-outs
- Watch-outs: built in 1900 — expect roof / HVAC / electrical / plumbing capex.
Questions for the listing agent
- Built in 1900 — when were the roof, HVAC, electrical panel, plumbing, and water heater last replaced?
- Is there a deadline driving the sale (1031 exchange, divorce, estate, relocation)? That informs how much negotiation room exists.
- Schools are B-rated — typically a magnet for longer-tenancy family renters. What's the average tenant stay here, and is there a school-zone premium baked into asking?
- What's the average days-on-market for RENTAL listings here right now (not sales)? A rising rental-DOM trend means longer vacancies and softer asking-rent achievability than the comps imply.
- What's the recent tenant-quality profile in this submarket — average credit score on applications, eviction rate, late-payment / NSF rate, and stable-employment percentage? A property-management company in the area should have these aggregated.
- How much new for-sale + rental construction is in the pipeline within 1–3 miles? Heavy new supply typically softens prices + rents 12–24 months out; constrained supply supports both.
Investment metrics
- 1% rule
- 1.11% ✓
- Cap rate
- 8.05%
- Cash-on-cash
- 6.26%
- DSCR
- 1.28
- GRM
- 7.5
CMA / ARV
- ARV (on-the-fly)
- $146,718
- Comps found
- 12
Show comp detail 12 sales within ~0.75 mi
| Address | Dist | Beds/Ba | Sqft | Sold | Price | $/sf | Match |
|---|---|---|---|---|---|---|---|
| 615 E 24th St | 0.32mi | 2/1.5 | 1,304 (+1%) | 0mo | $70,000 | $54 | 82 |
| 2243 White St | 0.44mi | 3/2.0 (+1) | 1,312 (+2%) | 1mo | $143,000 | $109 | 69 |
| 2501 Windsor Ave | 0.41mi | 3/2.0 (+1) | 1,256 (-2%) | 3mo | $197,000 | $157 | 68 |
| 2418 White St | 0.50mi | 3/1.5 (+1) | 1,317 (+2%) | 1mo | $150,000 | $114 | 67 |
| 1016 Rhomberg Ave | 0.28mi | 3/2.0 (+1) | 1,372 (+7%) | 2mo | $87,000 | $63 | 67 |
| 1901 Ann St | 0.44mi | 2/1.0 | 1,200 (-7%) | 0mo | $163,300 | $136 | 66 |
| 655 Regent St | 0.28mi | 3/1.0 (+1) | 1,176 (-9%) | 0mo | $64,000 | $54 | 65 |
| 2417 Jackson St | 0.48mi | 3/1.0 (+1) | 1,248 (-3%) | 1mo | $63,000 | $50 | 65 |
| 1311 Garfield Ave | 0.48mi | 3/1.0 (+1) | 1,248 (-3%) | 3mo | $160,000 | $128 | 63 |
| 2491 Jackson St | 0.53mi | 3/1.5 (+1) | 1,376 (+7%) | 0mo | $149,000 | $108 | 58 |
| 328 Chappel Ct | 0.68mi | 2/1.5 | 1,176 (-9%) | 0mo | $150,000 | $128 | 54 |
| 1610 Rhomberg Ave | 0.71mi | 1/2.0 (-1) | 1,373 (+7%) | 2mo | $156,700 | $114 | 47 |
Match score weights: distance 35% · size 25% · config 20% · recency 20%. Top-matched comps best support the ARV.
Projected returns pro-forma
-3.0% appreciation · 5.63% rent growth · sell at horizon
- IRR
- -3.6%
- Equity multiple
- 0.86×
- Total profit
- $-4,308
- Equity at exit
- $16,700
- IRR
- 9.0%
- Equity multiple
- 1.78×
- Total profit
- $24,463
- Equity at exit
- $9,684
Cash invested: $31,360 (down + closing). Projections, not guarantees.
Landlord ↔ Tenant lean methodology
- Overall (STATE)
- 83 Strongly Landlord-Friendly
- State Iowa
- 83 Strongly Landlord-Friendly · R+6
- County
- — inherits STATE
- City
- — inherits STATE
ZIP-level market 52001
- Rents YoY
- 5.6%
- Active inventory
- 225
- Price-to-rent
- 7.5×
Monthly cashflow live
- Estimated rent
- $1,242 high interval (Pro) →
- Mortgage (P&I)
- −$587
- Tax from tax record
- −$184 /mo · $2,204/yr
- Insurance
- −$47
- HOA
- −$0
- Vacancy / Maint / Mgmt
- −$261
- Net cashflow
- $164
Break-even live
UW: 25.0% down · 7.5% · 30yr · 1.5% tax · 5.0% vac · 8.0% maint · 8.0% mgmt
Financing live
Cash to close
- Down payment
- $28,000
- Closing costs
- $3,360
- Reserves months
- —
- Total cash needed
- —
Loan-product check · same deal, 3 products live
Conventional
25% down · 7.5% · 30yr
- Down + closing
- —
- Monthly P&I
- —
- Monthly cashflow
- —
- DSCR
- —
- Eligible?
- —
Personal DTI + credit; lowest rate.
DSCR
20% down · 8.5% · 30yr
- Down + closing
- —
- Monthly P&I
- —
- Monthly cashflow
- —
- DSCR
- —
- Eligible?
- —
No personal income docs; deal must DSCR.
Hard money
10% down · 12.0% · 12mo
- Down + closing
- —
- Monthly P&I
- —
- Monthly cashflow
- —
- DSCR
- —
- Eligible?
- —
Short-term bridge; refi at stabilization.
Rent comps 5 comps
| Address | Beds | Baths | Sqft | Rent | $/sqft | DOM | Units | Dist |
|---|---|---|---|---|---|---|---|---|
| 2418 Central Ave Unit 2 Dubuque, IA | 2.0 | 1.0 | 900 | $1,000 | $1.11 | 43d | 1 | 0.52mi |
| 1501 Central Ave Unit 1513-1 Dubuque, IA | 3.0 | 1.0 | 1374 | $1,175 | $0.86 | 43d | 1 | 0.60mi |
| 333 E 10th St Dubuque, IA | 2.0 | 2.0 | 1530 | $1,750 | $1.14 | 43d | 3 | 0.75mi |
| 571 Jefferson St Unit 3 Dubuque, IA | 3.0 | 1.0 | 1000 | $1,300 | $1.30 | 43d | 1 | 1.07mi |
| 703 Caledonia Pl Dubuque, IA | 3.0 | 1.0 | 1400 | $1,400 | $1.00 | 43d | 1 | 1.32mi |
Listing history 13 events
-
2026-06-19days on market $112,000 Active 15 DOM
-
2026-06-18days on market $112,000 Active 14 DOM
-
2026-06-17days on market $112,000 Active 13 DOM
-
2026-06-16days on market $112,000 Active 12 DOM
-
2026-06-15days on market $112,000 Active 11 DOM
-
2026-06-14days on market $112,000 Active 9 DOM
-
2026-06-13days on market $112,000 Active 8 DOM
-
2026-06-10days on market $112,000 Active 6 DOM
-
2026-06-09days on market $112,000 Active 5 DOM
-
2026-06-08days on market $112,000 Active 4 DOM
-
2026-06-07days on market $112,000 Active 3 DOM
-
2026-06-05remarks 366-char remark
-
2026-06-05$112,000 Active 1 DOM
ⓘ Source: listings_history table (triggers on properties + properties_extension) + one-shot
backfill from property_details.listing_events for pre-trigger history.
Tax reassessment forecast IA · Partial reset (capped growth)
- Current annual tax
- $2,204 · $184/mo
- Projected year-2 tax
- $2,204 · $184/mo
- Expected delta
- $0/yr ($0/mo · 0.0%)
ⓘ Screening estimate from a state-policy table — verify with the county assessor before closing.
Climate risk First Street
- Flood 1/10 Low FEMA zone X (unshaded) · 0% chance over 30 yrs
- Wildfire 1/10 Low
- Heat 3/10 Moderate 7 d/yr ≥102°F today · 15 d/yr by 30 yrs out
- Wind 2/10 Low
- Air quality 2/10 Low 1 unhealthy d/yr today · 2 by 30 yrs out
Nearby sold comps map
Loading sold comps map…
Walkable amenities ~0.75 mi
Loading nearby amenities…
Taxation est. · year 1
- Rental income
- $14,906
- − Mortgage interest
- −$6,274
- − Property taxes
- −$2,204
- − Insurance
- −$560
- − Repairs & maintenance
- −$1,192
- − Management
- −$1,192
- − Depreciation
- −$3,258
- Taxable income
- $225
- Est. tax owed @ 24.0%
- −$54
- After-tax cash flow
- $1,910/yr
For passive investors: Depreciation is non-cash, so a rental often shows a tax loss while cash-flowing — sheltering income. Rental losses are passive: they offset passive income freely, and up to $25,000/yr can offset ordinary (W-2) income if you actively participate and your MAGI is under $100k (phasing out to $0 by $150k); unused losses carry forward. On sale, claimed depreciation is recaptured at up to 25%, and gains may owe capital-gains tax (a 1031 exchange can defer both). Figures are a year-1 estimate at your 24.0% rate — not tax advice; consult a CPA.
Schools (NCES district)
- District
- Dubuque Community School District
- NCES district ID
- 1909480
- Math proficiency
- 63% ▼ -7.00%
- Reading proficiency
- 65% ▼ -1.00%
- Median HH income
- $51,237
- Composite
- 54.51/100
- National rank
- #1345
- State rank
- #205 of 289 in IA
Livability — Dubuque
- Score
- 89/100
- State rank
- #7
- US rank
- #119
Category grades
Schools grade is shown separately in the Schools card above.
Census & demographics
- Census place
- Dubuque, IA
- County
- Dubuque County · 60,106 people
- City population
- 60,106
- Metro
- Dubuque, IA
- Population (ZIP)
- 43,101
- Household income
- $61,643
- Rent vs Own
- Severe rent burden
- 1940.0
Population outlook (Dubuque County) Hauer SSP2
- Today (2025)
- 103,359 people
- By 2030
- 106,472 · +3.0%
- By 2040
- 112,043 · +8.4%
- By 2050
- 116,553 · +12.8%
- By 2075
- 128,014 · +23.9%
- By 2100
- 132,892 · +28.6%
Race, ethnicity, and origin ACS 2023
- Neighborhood character
- Predominantly White (84%)
- Race & ethnicity
- White 84% Two or more races 6% Black 5% Hispanic / Latino 4% Asian 1% Pacific Islander 1%
- Common ancestry
- Portuguese 3% Italian 2% Lithuanian 2%
- Foreign-born
- 4% · Canada, China
- Languages at home
- 95% English-only · Spanish 3% Tagalog/Filipino 1% Other Asian/Pacific 1%
Political lean MEDSL · Dubuque
- 2024 margin
- Lean R (+8.6) · D 45.1% · R 53.7% · Other 1.2%
- 2008→2024 swing
- -29.4pp toward R · 2008: 20.8pp · 2024: -8.6pp
- All cycles
- 2024: R+8.6 2020: R+2.9 2016: R+1.2 2012: D+14.5 2008: D+20.8
Not yet ingested
- Civics
- —
Market trends
- HPI YoY
- ▼ -156.36%
- Current HPI
- 173.5536
- Rent YoY
- ▲ 5.63%
- Metro
- Dubuque, IA
- State GDP YoY
- ▲ 2.48%
- F500 in state
- 4
Industry mix (Fortune 500 HQ in IA)
| Industry | F500 HQs | Revenue |
|---|---|---|
| Financial Services | 1 | $16B |
|
||
| Retail / Convenience | 1 | $15B |
|
||
Price history
+64.9% since first listed6 events — show timeline
- 2026-06-04 Listed $112,000 ECIMLS
- 2023-04-24 Sold (Public Records) $123,000 Public Records
- 2023-04-24 Sold (MLS) $123,000 ECIMLS
- 2023-02-24 Delisted — ECIMLS
- 2023-02-24 Listed $118,000 ECIMLS
- 2014-07-17 Listed $67,900 ECIMLS
Property tax history
+5.4%/yrLatest (2025): $2,204 · +74.4% YoY. Source: county tax records.
Cash-flow waterfall
monthlySold comps — $/sqft
last 12 mo · ≤1 miLoading sold comps…