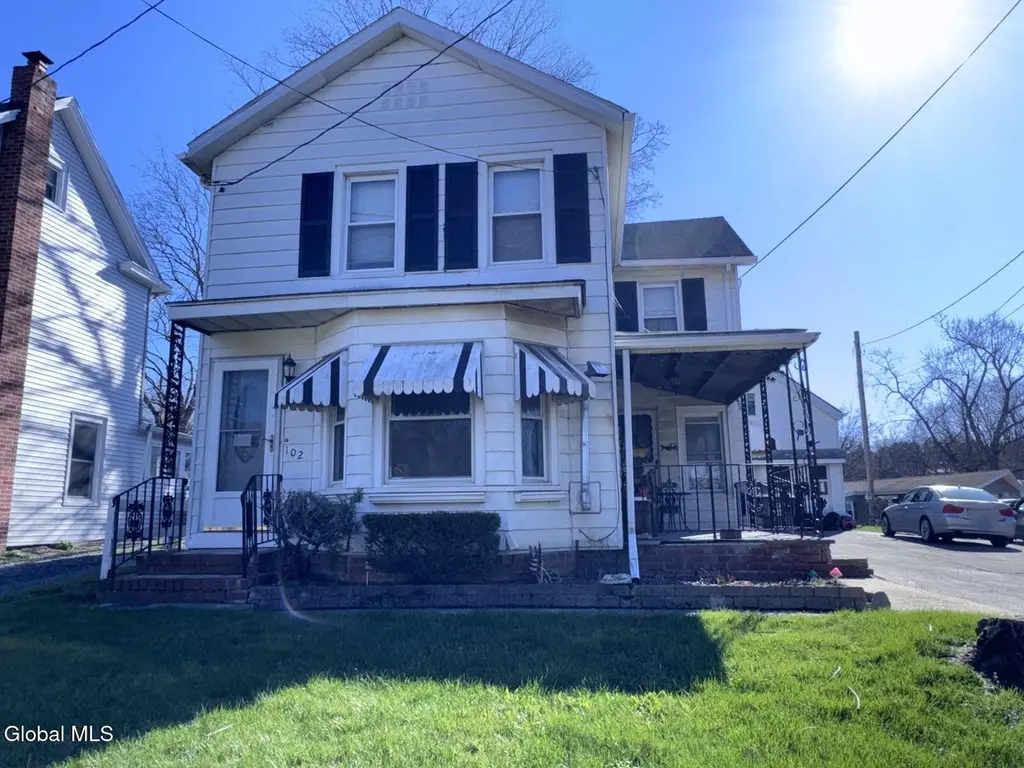
102 N Allen St · Jefferson Heights, NY
Flood risk 1/10 · Minimal
- FEMA flood zone
- X (unshaded)
- Chance of flooding over 30 yrs
- 0.0%
- Est. flood insurance / yr
- $473 – $860
Fire risk 2/10 · Minimal
- Est. fire insurance / yr
- $691 – $1,283
Heat risk 4/10 · Minor
- Hot days now (above 99°F)
- 7 days/yr
- Hot days in 30 yrs
- 16 days/yr
Wind risk 3/10 · Minor
- Chance of severe wind over 30 yrs
- 7.0%
Air-quality risk 2/10 · Minimal
- Unhealthy air days now
- 0 days/yr
- Unhealthy air days in 30 yrs
- 1 days/yr
Risk factors via First Street. Map © Google.
Why this score? — see what drove the B+ grade
The composite is a weighted blend of 9 inputs, each scored 0–100. Each bar is that input's sub-score; the figure is the points it added to the 100-point composite (weight × sub-score).
- Cash flow +29.2/30.0
- DSCR +10.0/10.0
- Appreciation +10.0/10.0
- 1% rule +9.2/10.0
- ARV discount +7.5/15.0
- Schools +4.1/10.0
- Livability +3.1/5.0
- Rent growth +2.5/5.0
- Condition / age +2.5/5.0
$140,000
🖨 Deal sheet 📄 Offer letter ✓ Due diligence
Listing remarks
ATTENTION INVESTORS: Great investment opportunity in Catskill! This 2-bedroom, 1.5-bath home features a detached 2-car garage and is conveniently located just 5 minutes from Catskill Central School District with quick access to the New York State Thruway for an easy commute. Whether you're looking to expand your rental portfolio or invest in a property with strong potential, this home is worth a look. To be sold together with 100 N Allen St. , offering added opportunity for investors or multi-property ownership. CASH BUYERS ONLY - ASSIGNMENT OF CONTRACT
Key facts
- Detached garage
- 4,791 sq ft lot
- 2 garage spots
Tags
Property features AI
Exterior
- Parking: Detached garage (2 spaces); Two total parking spaces; Off-street parking
- Utilities: Public water; Public sewer
- Home design: Single family residence; Entry level: First floor
- Construction: Aluminum siding
- Exterior features: Shingle roof; Other exterior features
Interior
- Kitchen: Oven; Range; Refrigerator
- Bedrooms: Two bedrooms located on the second floor
- Bathrooms: One full bathroom on the second floor; One half bathroom on the first floor
- Heating & cooling: Oil heating; Radiant heating; Has cooling (type: Other)
- Interior features: Six total rooms; Full, unfinished basement; Laundry room
- Laundry & utility: Laundry room
Neighborhood map
What this means for you Summary
Snapshot
- This is a 2-bed/1.5-bath single-family listed at $140k.
Deal economics
- At list price, monthly cash flow is $488 ($6k/yr) — positive.
- The deal already cash-flows at list — no discount required.
- Meets the 1% rule at list price ($2k rent vs $140k).
Location & tenants
- Location reads 62/100 on livability (#860 in NY) — a middle-class / working-renter tenant base. Strengths: crime A, health & safety A, cost of living B; Watch: employment C-, schools F, amenities F.
- Catskill Central School District (town): math 45% / reading 51% proficiency, ranked #429 of 590 in NY (top 73%) — families likely to look elsewhere, expect single-tenant / working-renter base with shorter leases.
- Market conditions: 104 active listings in the ZIP; 1 comparable units currently listed for rent nearby; 97 units permitted in Greene County in 2024 (0 in 5+ unit buildings).
- This rent runs 33% of the median local income ($73k/yr) — at the standard rent-burdened threshold; future hikes will face affordability resistance.
Forward outlook
- In year one you build about $15k of equity ($968 loan paydown + $14k appreciation (10.0% local appreciation)).
- Greene County population projected at -22% by 2050 — secular population decline; favor cash flow + early exit over multi-decade hold.
- At projected returns (10.0% appreciation + 3.0% rent growth), your $39k cash investment doubles in ~2 years — after that, you're playing with house money.
- By year 3, paydown + projected appreciation supports a ~$38k cash-out refi (75% LTV) — recoverable capital for the next deal without selling this one.
Negotiation context
- Only 3 days on market — expect competitive offers; lowballing is unlikely to land.
Risks & watch-outs
- Watch-outs: built in 1830 — expect roof / HVAC / electrical / plumbing capex.
Questions for the listing agent
- Built in 1830 — when were the roof, HVAC, electrical panel, plumbing, and water heater last replaced?
- Is there a deadline driving the sale (1031 exchange, divorce, estate, relocation)? That informs how much negotiation room exists.
- Schools are F-rated, which usually means shorter tenancies and higher turnover. Who's the typical renter profile here, and what's been the actual vacancy rate?
- What's the average days-on-market for RENTAL listings here right now (not sales)? A rising rental-DOM trend means longer vacancies and softer asking-rent achievability than the comps imply.
- What's the recent tenant-quality profile in this submarket — average credit score on applications, eviction rate, late-payment / NSF rate, and stable-employment percentage? A property-management company in the area should have these aggregated.
- How much new for-sale + rental construction is in the pipeline within 1–3 miles? Heavy new supply typically softens prices + rents 12–24 months out; constrained supply supports both.
Investment metrics
- 1% rule
- 1.42% ✓
- Cap rate
- 10.48%
- Cash-on-cash
- 14.94%
- DSCR
- 1.66
- GRM
- 5.9
CMA / ARV
- ARV (median comp)
- $341,222
- List price
- $140,000
- Delta
- -58.97%
- Verdict
- UNDERPRICED
- Comps
- 20 within 1.0 mi
Show comp detail 6 sales within ~0.75 mi
| Address | Dist | Beds/Ba | Sqft | Sold | Price | $/sf | Match |
|---|---|---|---|---|---|---|---|
| 25 S Jefferson Avenue Ave | 0.58mi | 3/1.0 (+1) | 1,456 (+4%) | 6mo | $476,500 | $327 | 54 |
| 631 Main St | 0.37mi | 2/1.5 | 1,262 (-10%) | 22mo | $405,000 | $321 | 48 |
| 122 Wildwing Park Rd | 0.68mi | 3/2.0 (+1) | 1,485 (+6%) | 7mo | $385,000 | $259 | 45 |
| 109 Summit | 0.38mi | 3/1.5 (+1) | 1,232 (-12%) | 16mo | $210,000 | $170 | 44 |
| 12 Clinton Ave | 0.60mi | 3/1.5 (+1) | 1,608 (+15%) | 8mo | $379,000 | $236 | 35 |
| 163 Spring St | 0.64mi | 3/1.0 (+1) | 1,536 (+10%) | 18mo | $225,250 | $147 | 32 |
Match score weights: distance 35% · size 25% · config 20% · recency 20%. Top-matched comps best support the ARV.
Projected returns pro-forma
10.0% appreciation · 3.0% rent growth · sell at horizon
- IRR
- 35.3%
- Equity multiple
- 3.74×
- Total profit
- $107,425
- Equity at exit
- $126,123
- IRR
- 30.5%
- Equity multiple
- 8.45×
- Total profit
- $292,102
- Equity at exit
- $271,989
Cash invested: $39,200 (down + closing). Projections, not guarantees.
Landlord ↔ Tenant lean methodology
- Overall (STATE)
- 15 Strongly Tenant-Friendly
- State New York
- 15 Strongly Tenant-Friendly · D+10
- County
- — inherits STATE
- City
- — inherits STATE
ZIP-level market 12414
- Home prices YoY
- 11.9%
- Active inventory
- 104
- Price-to-rent
- 5.9×
Monthly cashflow live
- Estimated rent
- $1,982 medium interval (Pro) →
- Mortgage (P&I)
- −$734
- Tax from tax record
- −$286 /mo · $3,427/yr
- Insurance
- −$58
- HOA
- −$0
- Vacancy / Maint / Mgmt
- −$416
- Net cashflow
- $488
Break-even live
UW: 25.0% down · 7.5% · 30yr · 1.5% tax · 5.0% vac · 8.0% maint · 8.0% mgmt
Financing live
Cash to close
- Down payment
- $35,000
- Closing costs
- $4,200
- Reserves months
- —
- Total cash needed
- —
Loan-product check · same deal, 3 products live
Conventional
25% down · 7.5% · 30yr
- Down + closing
- —
- Monthly P&I
- —
- Monthly cashflow
- —
- DSCR
- —
- Eligible?
- —
Personal DTI + credit; lowest rate.
DSCR
20% down · 8.5% · 30yr
- Down + closing
- —
- Monthly P&I
- —
- Monthly cashflow
- —
- DSCR
- —
- Eligible?
- —
No personal income docs; deal must DSCR.
Hard money
10% down · 12.0% · 12mo
- Down + closing
- —
- Monthly P&I
- —
- Monthly cashflow
- —
- DSCR
- —
- Eligible?
- —
Short-term bridge; refi at stabilization.
Rent comps 1 comps
| Address | Beds | Baths | Sqft | Rent | $/sqft | DOM | Units | Dist |
|---|---|---|---|---|---|---|---|---|
| 114 Main St Catskill, NY | 3.0 | 1.0 | 1000 | $2,400 | $2.40 | 43d | 1 | 1.42mi |
Listing history 2 events
-
2026-05-18status Pending 561-char remark
-
2026-05-14$140,000 Active 561-char remark
ⓘ Source: listings_history table (triggers on properties + properties_extension) + one-shot
backfill from property_details.listing_events for pre-trigger history.
Tax reassessment forecast NY · Partial reset (capped growth)
- Current annual tax
- $3,427 · $286/mo
- Projected year-2 tax
- $3,427 · $286/mo
- Expected delta
- $0/yr ($0/mo · 0.0%)
ⓘ Screening estimate from a state-policy table — verify with the county assessor before closing.
Climate risk First Street
- Flood 1/10 Low FEMA zone X (unshaded) · 0% chance over 30 yrs
- Wildfire 2/10 Low
- Heat 4/10 Moderate 7 d/yr ≥99°F today · 16 d/yr by 30 yrs out
- Wind 3/10 Moderate 7% chance of damaging wind over 30 yrs
- Air quality 2/10 Low 0 unhealthy d/yr today · 1 by 30 yrs out
Nearby sold comps map
Loading sold comps map…
Walkable amenities ~0.75 mi
Loading nearby amenities…
Taxation est. · year 1
- Rental income
- $23,788
- − Mortgage interest
- −$7,842
- − Property taxes
- −$3,427
- − Insurance
- −$700
- − Repairs & maintenance
- −$1,903
- − Management
- −$1,903
- − Depreciation
- −$4,073
- Taxable income
- $3,940
- Est. tax owed @ 24.0%
- −$946
- After-tax cash flow
- $4,910/yr
For passive investors: Depreciation is non-cash, so a rental often shows a tax loss while cash-flowing — sheltering income. Rental losses are passive: they offset passive income freely, and up to $25,000/yr can offset ordinary (W-2) income if you actively participate and your MAGI is under $100k (phasing out to $0 by $150k); unused losses carry forward. On sale, claimed depreciation is recaptured at up to 25%, and gains may owe capital-gains tax (a 1031 exchange can defer both). Figures are a year-1 estimate at your 24.0% rate — not tax advice; consult a CPA.
Schools (NCES district)
- District
- Catskill Central School District
- NCES district ID
- 3606720
- Math proficiency
- 45% ▼ -9.00%
- Reading proficiency
- 51% ▲ 8.00%
- Median HH income
- $44,960
- Composite
- 40.63/100
- National rank
- #3685
- State rank
- #429 of 590 in NY
Livability — Jefferson Heights
- Score
- 62/100
- State rank
- #860
- US rank
- #16594
Category grades
Schools grade is shown separately in the Schools card above.
Census & demographics
- County
- Greene County · 10,169 people
- Metro
- nan
- Population (ZIP)
- 10,169
- Household income
- $73,036
- Rent vs Own
- Severe rent burden
- 318.0
Population outlook (Greene County) Hauer SSP2
- Today (2025)
- 44,963 people
- By 2030
- 43,126 · -4.1%
- By 2040
- 38,756 · -13.8%
- By 2050
- 34,913 · -22.4%
- By 2075
- 28,156 · -37.4%
- By 2100
- 22,296 · -50.4%
Race, ethnicity, and origin ACS 2023
- Neighborhood character
- Predominantly White (77%)
- Race & ethnicity
- White 77% Hispanic / Latino 10% Two or more races 8% Black 6%
- Hispanic origin (detail)
- Puerto Rican 7%
- Common ancestry
- Scotch-Irish 3% Iranian 3% Lithuanian 3%
- Foreign-born
- 4% · Canada, Mexico
- Languages at home
- 91% English-only · Spanish 5% Other Indo-European 2% Russian/Polish/Slavic 1%
Political lean MEDSL · Greene
- 2024 margin
- R (+17.0) · D 41.5% · R 58.5%
- 2008→2024 swing
- -7.1pp toward R · 2008: -9.9pp · 2024: -17.0pp
- All cycles
- 2024: R+17.0 2020: R+15.6 2016: R+27.4 2012: R+11.1 2008: R+9.9
Not yet ingested
- Civics
- —
Market trends
- HPI YoY
- ▲ 52.47%
- Current HPI
- 494.3394
- Rent YoY
- —
- Metro
- nan
- State GDP YoY
- ▲ 2.60%
- F500 in state
- 92
Industry mix (Fortune 500 HQ in NY)
| Industry | F500 HQs | Revenue |
|---|---|---|
| Financial Services | 10 | $950B |
|
||
| Consumer Goods | 9 | $162B |
|
||
| Insurance | 4 | $225B |
|
||
| Telecommunications | 2 | $144B |
|
||
| Pharmaceuticals | 2 | $112B |
|
||
| Media / Entertainment | 2 | $69B |
|
||
Price history
2 events — show timeline
- 2026-05-18 Pending — Global MLS
- 2026-05-14 Listed $140,000 Global MLS
Property tax history
+3.3%/yrLatest (2025): $3,427 · +2.4% YoY. Source: county tax records.
Cash-flow waterfall
monthlySold comps — $/sqft
last 12 mo · ≤1 miLoading sold comps…