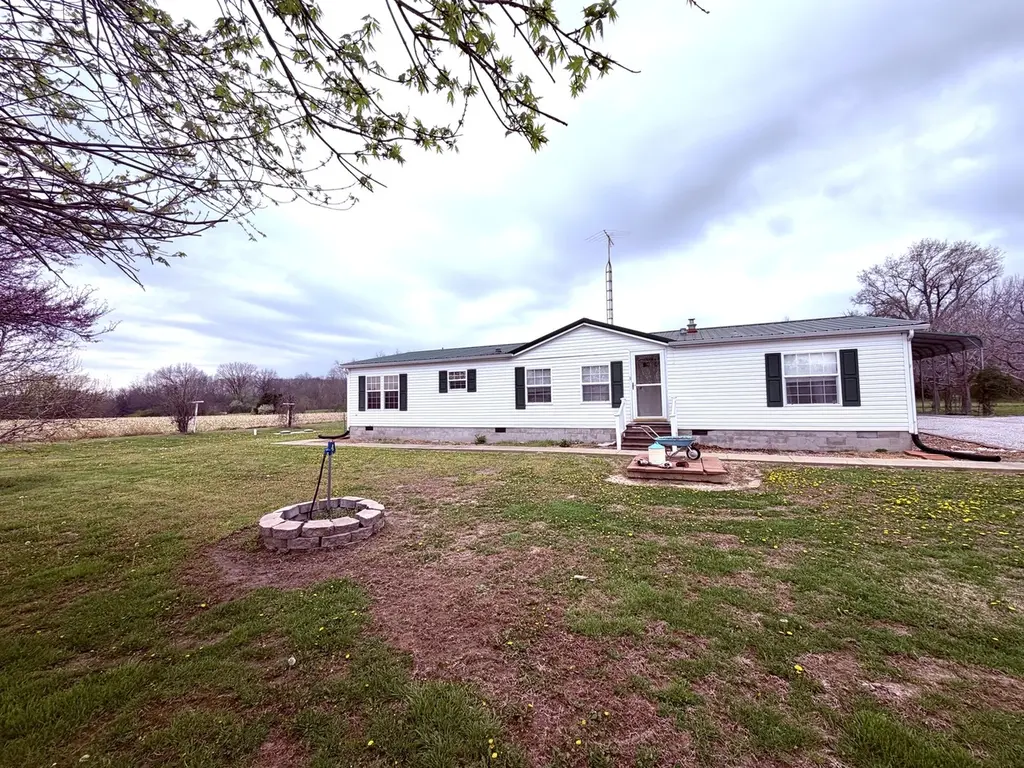
22987 N Post Oak Ln · Walnut Hill, IL
Flood risk 1/10 · Minimal
- FEMA flood zone
- X (unshaded)
- Chance of flooding over 30 yrs
- 0.0%
- Est. flood insurance / yr
- $473 – $860
Fire risk 1/10 · Minimal
- Est. fire insurance / yr
- $804 – $1,492
Heat risk 4/10 · Minor
- Hot days now (above 106°F)
- 7 days/yr
- Hot days in 30 yrs
- 20 days/yr
Wind risk 2/10 · Minimal
- Chance of severe wind over 30 yrs
- 2.0%
Air-quality risk 2/10 · Minimal
- Unhealthy air days now
- 1 days/yr
- Unhealthy air days in 30 yrs
- 1 days/yr
Risk factors via First Street. Map © Google.
Why this score? — see what drove the C- grade
The composite is a weighted blend of 9 inputs, each scored 0–100. Each bar is that input's sub-score; the figure is the points it added to the 100-point composite (weight × sub-score).
- Cash flow +16.5/30.0
- Appreciation +8.2/10.0
- ARV discount +7.5/15.0
- DSCR +5.1/10.0
- 1% rule +3.4/10.0
- Livability +3.0/5.0
- Rent growth +2.5/5.0
- Condition / age +2.5/5.0
- Schools +2.2/10.0
$139,900
🖨 Deal sheet 📄 Offer letter ✓ Due diligence
Listing remarks MLS
Great Country setting on 1 acre. There have been many updates including new metal roof on 3 structures, new laminate in kitchen and vinyl in both bathrooms, paint in most rooms. Includes a detached 2 car garage, a 1 car detached garage w/ workshop, canning cellar and a camper carport valued at 3,300. This is a must see! None
Key facts
- 1 acre lot
- 2 garage spots
- Built 2002
Property features AI
Finance
- Other: Fee simple ownership
- HOA & community: No master association fee required
Exterior
- Parking: Detached garage (owned) with 2 garage spaces; Gravel parking; total 2 parking spaces
- Utilities: Public water; Septic tank
- Home design: Detached single-family home; One-story
- Construction: Built approximately 21–25 years ago; Vinyl siding; Asphalt roof; Block foundation
- Exterior features: Deck; Level lot
Interior
- Kitchen: Kitchen (main level) — 12 x 23, vinyl flooring
- Bedrooms: Master bedroom (main level) with full bath; Bedroom 2 (main level) — 13 x 11, carpet; Bedroom 3 (main level) — 13 x 10, carpet; Additional bedroom
- Flooring: Carpet in bedrooms; Laminate in master bedroom; Vinyl in kitchen; Ceramic tile in living room
- Bathrooms: Two full bathrooms
- Heating & cooling: Propane heating; Central air conditioning
- Interior features: Five total rooms; Wood-burning fireplace in the living room
- Laundry & utility: Laundry room (main level) — 5 x 5
Neighborhood map
What this means for you Summary
Snapshot
- This is a 3-bed/2.0-bath single-family listed at $140k.
Deal economics
- At list price, monthly cash flow is $82 ($981/yr) — positive.
- The deal already cash-flows at list — no discount required.
- To meet the 1% rule (rent ≥ 1% of price), the offer needs to be $117k (16.3% below list).
- Recommended offer: $117k (16.3% below list) — sets the bar for 1% rule.
Location & tenants
- Location reads 59/100 on livability (#1,034 in IL) — a working-class tenant base; expect higher turnover. Strengths: cost of living A+, housing B+; Watch: schools F, crime F, amenities F.
- Centralia Hsd 200 (town): math 21% / reading 26% proficiency, ranked #668 of 919 in IL (top 73%) — low school quality limits family demand, transient renter base, plan for 1-2y turnover.
- Market conditions: 7 active listings in the ZIP; 6 units permitted in Jefferson County in 2024 (0 in 5+ unit buildings).
Forward outlook
- In year one you build about $10k of equity ($967 loan paydown + $9k appreciation (6.3% local appreciation)).
- Jefferson County population projected at -14% by 2050 — secular population decline; favor cash flow + early exit over multi-decade hold.
- At projected returns (6.3% appreciation + 3.0% rent growth), your $39k cash investment doubles in ~4 years — after that, you're playing with house money.
- By year 4, paydown + projected appreciation supports a ~$34k cash-out refi (75% LTV) — recoverable capital for the next deal without selling this one.
Negotiation context
- It's been on market 64 days — a 6% lower offer ($132k) is reasonable based on typical stale-listing flexibility.
- 3 sale attempts since 11y ago; this cycle's ask has dropped $10k (7%) from the opening price — seller is motivated, your offer sets the floor, not the list.
- Current owner paid $72k; list at $140k implies a 94% gain — meaningful room to come down on a strong offer.
Questions for the listing agent
- It's been on market 64 days. Have you received any prior offers? Is the seller open to a 16% concession, seller financing, or rate buy-down credit?
- Why hasn't it sold? Are there any deal-killer items the seller is aware of (foundation, flood, title, zoning, code violations)?
- Is there a deadline driving the sale (1031 exchange, divorce, estate, relocation)? That informs how much negotiation room exists.
- Schools are F-rated, which usually means shorter tenancies and higher turnover. Who's the typical renter profile here, and what's been the actual vacancy rate?
- Crime grade is F in this area — have there been break-ins, vandalism, or insurance claims at this property in the last 3 years? What carrier currently insures it and at what premium?
- What's the average days-on-market for RENTAL listings here right now (not sales)? A rising rental-DOM trend means longer vacancies and softer asking-rent achievability than the comps imply.
- What's the recent tenant-quality profile in this submarket — average credit score on applications, eviction rate, late-payment / NSF rate, and stable-employment percentage? A property-management company in the area should have these aggregated.
- How much new for-sale + rental construction is in the pipeline within 1–3 miles? Heavy new supply typically softens prices + rents 12–24 months out; constrained supply supports both.
Investment metrics
- 1% rule
- 0.84% ✗
- Cap rate
- 6.99%
- Cash-on-cash
- 2.50%
- DSCR
- 1.11
- GRM
- 10.0
CMA / ARV
- ARV (on-the-fly)
- $418,656
- Comps found
- 2
Show comp detail 2 sales within ~0.75 mi
| Address | Dist | Beds/Ba | Sqft | Sold | Price | $/sf | Match |
|---|---|---|---|---|---|---|---|
| 22987 N Post Oak Ln | 0.00mi | 3/2.0 | 1,568 (0%) | 0mo | $136,000 | $87 | 100 |
| 23445 N Post Oak Rd | 0.42mi | 2/2.0 (-1) | 1,500 (-4%) | 16mo | $400,000 | $267 | 55 |
Match score weights: distance 35% · size 25% · config 20% · recency 20%. Top-matched comps best support the ARV.
Projected returns pro-forma
6.34% appreciation · 3.0% rent growth · sell at horizon
- IRR
- 18.2%
- Equity multiple
- 2.24×
- Total profit
- $48,391
- Equity at exit
- $90,982
- IRR
- 17.6%
- Equity multiple
- 4.51×
- Total profit
- $137,452
- Equity at exit
- $167,677
Cash invested: $39,172 (down + closing). Projections, not guarantees.
Landlord ↔ Tenant lean methodology
- Overall (STATE)
- 43 Moderately Tenant-Leaning
- State Illinois
- 43 Moderately Tenant-Leaning · D+7
- County
- — inherits STATE
- City
- — inherits STATE
ZIP-level market 62893
- Home prices YoY
- 4.3%
- Active inventory
- 7
- Price-to-rent
- 10.0×
Monthly cashflow live
- Estimated rent
- $1,171 medium interval (Pro) →
- Mortgage (P&I)
- −$734
- Tax from tax record
- −$52 /mo · $618/yr
- Insurance
- −$58
- HOA
- −$0
- Vacancy / Maint / Mgmt
- −$246
- Net cashflow
- $82
Break-even live
UW: 25.0% down · 7.5% · 30yr · 1.5% tax · 5.0% vac · 8.0% maint · 8.0% mgmt
Financing live
Cash to close
- Down payment
- $34,975
- Closing costs
- $4,197
- Reserves months
- —
- Total cash needed
- —
Loan-product check · same deal, 3 products live
Conventional
25% down · 7.5% · 30yr
- Down + closing
- —
- Monthly P&I
- —
- Monthly cashflow
- —
- DSCR
- —
- Eligible?
- —
Personal DTI + credit; lowest rate.
DSCR
20% down · 8.5% · 30yr
- Down + closing
- —
- Monthly P&I
- —
- Monthly cashflow
- —
- DSCR
- —
- Eligible?
- —
No personal income docs; deal must DSCR.
Hard money
10% down · 12.0% · 12mo
- Down + closing
- —
- Monthly P&I
- —
- Monthly cashflow
- —
- DSCR
- —
- Eligible?
- —
Short-term bridge; refi at stabilization.
Listing history 17 events
-
2026-06-07statusdays on market $139,900 Pending 64 DOM
-
2026-06-04days on market $139,900 Contingent - Continue to Show 62 DOM
-
2026-06-02statusdays on market $139,900 Contingent - Continue to Show 61 DOM
-
2026-06-01days on market $139,900 Active 60 DOM
-
2026-05-31days on market $139,900 Active 59 DOM
-
2026-05-31days on market $139,900 Active 58 DOM
-
2026-05-04historical Contingent - Continue to Show
-
2026-04-23price $139,900
-
2026-04-01$149,900 Active
-
2021-08-06historical
-
2016-04-30historical
-
2016-04-14soldstatus $72,000
-
2016-04-13soldstatus $72,000 326-char remark
Show marketing remark (326 chars)
Great Country setting on 1 acre. There have been many updates including new metal roof on 3 structures, new laminate in kitchen and vinyl in both bathrooms, paint in most rooms. Includes a detached 2 car garage, a 1 car detached garage w/ workshop, canning cellar and a camper carport valued at 3,300. This is a must see! None
-
2015-09-23$78,900 326-char remark
Show marketing remark (326 chars)
Great Country setting on 1 acre. There have been many updates including new metal roof on 3 structures, new laminate in kitchen and vinyl in both bathrooms, paint in most rooms. Includes a detached 2 car garage, a 1 car detached garage w/ workshop, canning cellar and a camper carport valued at 3,300. This is a must see! None
-
2011-08-24soldstatus $60,000
ⓘ Source: listings_history table (triggers on properties + properties_extension) + one-shot
backfill from property_details.listing_events for pre-trigger history.
Tax reassessment forecast IL · Partial reset (capped growth)
- Current annual tax
- $618 · $52/mo
- Projected year-2 tax
- $1,897 · $158/mo
- Expected delta
- +$1,279/yr (+$107/mo · 206.7%)
ⓘ Screening estimate from a state-policy table — verify with the county assessor before closing.
Climate risk First Street
- Flood 1/10 Low FEMA zone X (unshaded) · 0% chance over 30 yrs
- Wildfire 1/10 Low
- Heat 4/10 Moderate 7 d/yr ≥106°F today · 20 d/yr by 30 yrs out
- Wind 2/10 Low 2% chance of damaging wind over 30 yrs
- Air quality 2/10 Low 1 unhealthy d/yr today · 1 by 30 yrs out
Nearby sold comps map
Loading sold comps map…
Walkable amenities ~0.75 mi
Loading nearby amenities…
Taxation est. · year 1
- Rental income
- $14,054
- − Mortgage interest
- −$7,837
- − Property taxes
- −$618
- − Insurance
- −$700
- − Repairs & maintenance
- −$1,124
- − Management
- −$1,124
- − Depreciation
- −$4,070
- Taxable loss
- −$1,419
- Est. tax savings @ 24.0%
- +$341
- After-tax cash flow
- $1,321/yr
For passive investors: Depreciation is non-cash, so a rental often shows a tax loss while cash-flowing — sheltering income. Rental losses are passive: they offset passive income freely, and up to $25,000/yr can offset ordinary (W-2) income if you actively participate and your MAGI is under $100k (phasing out to $0 by $150k); unused losses carry forward. On sale, claimed depreciation is recaptured at up to 25%, and gains may owe capital-gains tax (a 1031 exchange can defer both). Figures are a year-1 estimate at your 24.0% rate — not tax advice; consult a CPA.
Schools (NCES district)
- District
- Centralia Hsd 200
- NCES district ID
- 1709300
- Math proficiency
- 21% ▲ 6.00%
- Reading proficiency
- 26% ▲ 1.00%
- Median HH income
- $34,555
- Composite
- 22.43/100
- National rank
- #13470
- State rank
- #668 of 919 in IL
Livability — Walnut Hill
- Score
- 59/100
- State rank
- #1034
- US rank
- #19847
Category grades
Schools grade is shown separately in the Schools card above.
Census & demographics
- Population (ZIP)
- 922
Population outlook (Jefferson County) Hauer SSP2
- Today (2025)
- 36,818 people
- By 2030
- 35,764 · -2.9%
- By 2040
- 33,649 · -8.6%
- By 2050
- 31,557 · -14.3%
- By 2075
- 26,055 · -29.2%
- By 2100
- 19,237 · -47.8%
Race, ethnicity, and origin ACS 2023
- Neighborhood character
- Predominantly White (92%)
- Race & ethnicity
- White 92% Two or more races 6% Hispanic / Latino 1%
- Common ancestry
- Italian 4% Romanian 2% Lithuanian 1%
- Languages at home
- 99% English-only · Spanish 1%
Political lean MEDSL · Jefferson
- 2024 margin
- Solid R (+47.8) · D 25.5% · R 73.3% · Other 1.3%
- 2008→2024 swing
- -37.0pp toward R · 2008: -10.7pp · 2024: -47.8pp
- All cycles
- 2024: R+47.8 2020: R+45.1 2016: R+43.2 2012: R+22.9 2008: R+10.7
Not yet ingested
- Civics
- —
Market trends
- HPI YoY
- ▲ 6.34%
- Current HPI
- 153.7358
- Rent YoY
- —
- Metro
- —
- State GDP YoY
- ▲ 1.59%
- F500 in state
- 60
Industry mix (Fortune 500 HQ in IL)
| Industry | F500 HQs | Revenue |
|---|---|---|
| Insurance | 4 | $201B |
|
||
| Consumer Goods | 4 | $87B |
|
||
| Industrial Machinery | 3 | $64B |
|
||
| Healthcare | 2 | $55B |
|
||
| Retail / Pharmacy | 1 | $148B |
|
||
| Agriculture / Food | 1 | $86B |
|
||
Price history
+133.2% since first listed11 events — show timeline
- 2026-05-04 Contingent — MRED as Distributed by MLS Grid
- 2026-04-23 Price Changed $139,900 MRED as Distributed by MLS Grid
- 2026-04-01 Listed $149,900 MRED as Distributed by MLS Grid
- 2021-08-06 Listing Removed — RMLSA as Distributed by MLS Grid
- 2016-04-30 Listing Removed — MRED as Distributed by MLS Grid
- 2016-04-14 Sold (Public Records) $72,000 Public Records
- 2016-04-13 Sold (MLS) $72,000 RMLSA as Distributed by MLS Grid
- 2016-04-13 Sold (MLS) $72,000 MRED as Distributed by MLS Grid
- 2015-09-23 Listed $78,900 RMLSA as Distributed by MLS Grid
- 2015-09-23 Listed $78,900 MRED as Distributed by MLS Grid
- 2011-08-24 Sold (Public Records) $60,000 Public Records
Property tax history
+0.1%/yrLatest (2024): $618 · -39.7% YoY. Source: county tax records.
Cash-flow waterfall
monthlySold comps — $/sqft
last 12 mo · ≤1 miLoading sold comps…