 Multi-family
🌊 Lakefront
Multi-family
🌊 Lakefront
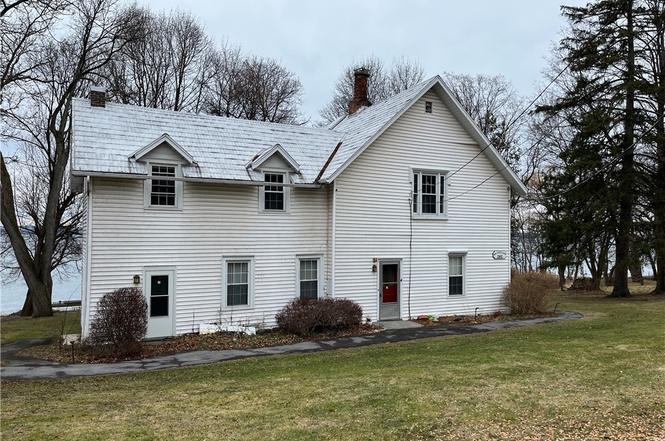
245 Main St · Aurora, NY
Flood risk 1/10 · Minimal
- FEMA flood zone
- X (unshaded)
- Chance of flooding over 30 yrs
- 0.0%
- Est. flood insurance / yr
- $473 – $860
Fire risk 1/10 · Minimal
- Est. fire insurance / yr
- $691 – $1,283
Heat risk 3/10 · Minor
- Hot days now (above 96°F)
- 7 days/yr
- Hot days in 30 yrs
- 15 days/yr
Wind risk 1/10 · Minimal
- Chance of severe wind over 30 yrs
- 1.0%
Air-quality risk 2/10 · Minimal
- Unhealthy air days now
- 0 days/yr
- Unhealthy air days in 30 yrs
- 1 days/yr
Risk factors via First Street. Map © Google.
Why this score? — see what drove the D grade
The composite is a weighted blend of 9 inputs, each scored 0–100. Each bar is that input's sub-score; the figure is the points it added to the 100-point composite (weight × sub-score).
- Appreciation +10.0/10.0
- Cash flow +8.6/30.0
- ARV discount +7.5/15.0
- Schools +5.3/10.0
- Livability +3.4/5.0
- Rent growth +2.5/5.0
- Condition / age +2.5/5.0
- DSCR +2.3/10.0
- 1% rule +1.7/10.0
$625,000
🖨 Deal sheet (PDF) 📄 Offer letter ✓ Due diligence
Multi-family units
County records classify this as Multi-Family (5+ Unit). Listing-text estimate: 1 unit. estimate disagrees with records
5+ unit building — per-unit beds/baths from public records are typically unavailable; the breakdown below (if shown) is an estimate from the listing text.
Listing remarks
Nestled in the picturesque Village of Aurora, NY, Wavebank stands as a historic gem on the shores of Cayuga Lake. This distinguished four-unit apartment house offers a unique blend of charm and convenience. With an easy stroll to the Village center, the Inns of Aurora, and Wells College, residents enjoy a seamless blend of tranquility and accessibility. Immerse yourself in the beauty of lakeside living while being in close proximity to cultural and educational amenities. Wavebank is not just a residence; it's an invitation to embrace the rich history and scenic beauty of the lakeside community. Let your imagination be your guide as you decide as the buyer what the next chapter will be in t
Key facts
- Historic gem
- Lakeside living
- 0.83 acre lot
Tags
Neighborhood map
What this means for you Summary
Snapshot
- This is a 5-bed/5.0-bath multifamily listed at $625k.
Deal economics
- At list price, monthly cash flow is $-542 ($-6k/yr) — negative.
- To cash-flow at today's rent, offer at most $529k (15.3% below list).
- To meet the 1% rule (rent ≥ 1% of price), the offer needs to be $420k (32.8% below list).
- Recommended offer: $420k (32.8% below list) — sets the bar for 1% rule.
Location & tenants
- Location reads 68/100 on livability (#530 in NY) — a middle-class / working-renter tenant base. Strengths: employment A+, housing A+; Watch: cost of living D+, health & safety D, crime F.
- Southern Cayuga Central School District (rural): math 61% / reading 61% proficiency, ranked #214 of 590 in NY (top 36%) — acceptable for families but not a draw, mixed tenant base, ~2y average lease.
- Zoned schools: Southern Cayuga Elementary School (math 62% / reading 62%, grade B, #675 of 2,108 statewide, top 35%, 361 students, 52% FRL); Southern Cayuga 7-12 Secondary School (math 62% / reading 57%, grade C+, #851 of 1,100 statewide, top 80%, 295 students, 48% FRL) — zoned schools average 50% FRL vs 35% district-wide (15 pts higher); higher-poverty schools than district average — tighter screening recommended.
- Market conditions: 20 active listings in the ZIP; 161 units permitted in Cayuga County in 2024 (65 in 5+ unit buildings).
Forward outlook
- In year one you build about $67k of equity ($4k loan paydown + $62k appreciation (10.0% local appreciation)).
- Cayuga County population projected at -18% by 2050 — secular population decline; favor cash flow + early exit over multi-decade hold.
- By year 2, paydown + projected appreciation supports a ~$107k cash-out refi (75% LTV) — recoverable capital for the next deal without selling this one.
Negotiation context
- It's been on market 172 days — a 12% lower offer ($550k) is reasonable based on typical stale-listing flexibility.
- 5 sale attempts since 2y ago; this cycle's ask is 4% above the opening price — seller raised mid-cycle; expect resistance to lowballs.
Risks & watch-outs
- Watch-outs: built in 1876 — expect roof / HVAC / electrical / plumbing capex.
Questions for the listing agent
- What do current leases actually rent for vs. the listed asking? Can we see a recent rent roll and the last 12 months of T-12 income?
- It's been on market 172 days. Have you received any prior offers? Is the seller open to a 33% concession, seller financing, or rate buy-down credit?
- Built in 1876 — when were the roof, HVAC, electrical panel, plumbing, and water heater last replaced?
- Why hasn't it sold? Are there any deal-killer items the seller is aware of (foundation, flood, title, zoning, code violations)?
- Is there a deadline driving the sale (1031 exchange, divorce, estate, relocation)? That informs how much negotiation room exists.
- Schools are B-rated — typically a magnet for longer-tenancy family renters. What's the average tenant stay here, and is there a school-zone premium baked into asking?
- Crime grade is F in this area — have there been break-ins, vandalism, or insurance claims at this property in the last 3 years? What carrier currently insures it and at what premium?
- The area grade is low — what's the realistic commute time and amenity access for the typical tenant pool here? Any planned neighborhood developments (good or bad) we should know about?
- This sits on a lake — are riparian / water-frontage rights deeded with the parcel? Any dock permits, shoreline easements, or HOA water-use restrictions?
- What's the documented flood / surge / shoreline-erosion history here (FEMA AND non-FEMA — e.g., storm surge, creek backup, septic-field saturation)?
- Any water-quality or seasonal algae-bloom issues that affect tenant satisfaction or short-term-rental demand?
- What's the average days-on-market for RENTAL listings here right now (not sales)? A rising rental-DOM trend means longer vacancies and softer asking-rent achievability than the comps imply.
- What's the recent tenant-quality profile in this submarket — average credit score on applications, eviction rate, late-payment / NSF rate, and stable-employment percentage? A property-management company in the area should have these aggregated.
- How much new apartment / multifamily construction is in the pipeline within 1–3 miles? Heavy new supply (>2% of stock underway) typically softens rents 12–24 months out; light construction supports rent growth.
Investment metrics
- 1% rule
- 0.67% ✗
- Cap rate
- 5.25%
- Cash-on-cash
- -3.71%
- DSCR
- 0.83
- GRM
- 12.4
CMA / ARV
No comps found within radius.
Projected returns pro-forma
10.0% appreciation · 3.0% rent growth · sell at horizon
- IRR
- 21.6%
- Equity multiple
- 2.75×
- Total profit
- $305,681
- Equity at exit
- $563,050
- IRR
- 19.5%
- Equity multiple
- 6.30×
- Total profit
- $926,869
- Equity at exit
- $1,214,238
Cash invested: $175,000 (down + closing). Projections, not guarantees.
Landlord ↔ Tenant lean methodology
- Overall (STATE)
- 15 Strongly Tenant-Friendly
- State New York
- 15 Strongly Tenant-Friendly · D+10
- County
- — inherits STATE
- City
- — inherits STATE
ZIP-level market 13026
- Home prices YoY
- 3.2%
- Active inventory
- 20
- Price-to-rent
- 12.4×
Monthly cashflow live
- Estimated rent
- $4,200 medium interval (Pro) →
- Mortgage (P&I)
- −$3,278
- Tax from tax record
- −$321 /mo · $3,855/yr
- Insurance
- −$260
- HOA
- −$0
- Vacancy / Maint / Mgmt
- −$882
- Net cashflow
- $-542
Break-even live
Sensitivity live
| Price | -10% $-188 | -5% $-365 | +0% $-542 | +5% $-718 | +10% $-895 |
|---|---|---|---|---|---|
| Rent | -10% $-873 | -5% $-707 | +0% $-542 | +5% $-376 | +10% $-210 |
| Rate | -1.0pp $-227 | -0.5pp $-383 | base $-542 | +0.5pp $-703 | +1.0pp $-868 |
UW: 25.0% down · 7.5% · 30yr · 1.5% tax · 5.0% vac · 8.0% maint · 8.0% mgmt
Financing live
Cash to close
- Down payment
- $156,250
- Closing costs
- $18,750
- Reserves months
- —
- Total cash needed
- —
Loan-product check · same deal, 3 products live
Conventional
25% down · 7.5% · 30yr
- Down + closing
- —
- Monthly P&I
- —
- Monthly cashflow
- —
- DSCR
- —
- Eligible?
- —
Personal DTI + credit; lowest rate.
DSCR
20% down · 8.5% · 30yr
- Down + closing
- —
- Monthly P&I
- —
- Monthly cashflow
- —
- DSCR
- —
- Eligible?
- —
No personal income docs; deal must DSCR.
Hard money
10% down · 12.0% · 12mo
- Down + closing
- —
- Monthly P&I
- —
- Monthly cashflow
- —
- DSCR
- —
- Eligible?
- —
Short-term bridge; refi at stabilization.
Listing history 12 events
-
2026-01-03status Pending
-
2025-09-20historical Active Under Contract
-
2025-08-28status Active
-
2025-05-28status Pending
-
2025-04-19historical Active Under Contract
-
2025-04-14price $625,000
-
2025-04-12$599,900 Active
-
2024-11-26status Active
-
2024-08-01historical
-
2024-07-04status Pending
-
2024-06-24Active Under Contract
-
2024-02-01$799,900
ⓘ Source: listings_history table (triggers on properties + properties_extension) + one-shot
backfill from property_details.listing_events for pre-trigger history.
Tax reassessment forecast NY · Partial reset (capped growth)
- Current annual tax
- $3,855 · $321/mo
- Projected year-2 tax
- $7,209 · $601/mo
- Expected delta
- +$3,354/yr (+$279/mo · 87.0%)
ⓘ Screening estimate from a state-policy table — verify with the county assessor before closing.
Climate risk First Street
- Flood 1/10 Low FEMA zone X (unshaded) · 0% chance over 30 yrs
- Wildfire 1/10 Low
- Heat 3/10 Moderate 7 d/yr ≥96°F today · 15 d/yr by 30 yrs out
- Wind 1/10 Low 100% chance of damaging wind over 30 yrs
- Air quality 2/10 Low 0 unhealthy d/yr today · 1 by 30 yrs out
Nearby sold comps map
Loading sold comps map…
Walkable amenities ~0.75 mi
Loading nearby amenities…
Taxation est. · year 1
- Rental income
- $50,395
- − Mortgage interest
- −$35,010
- − Property taxes
- −$3,855
- − Insurance
- −$3,125
- − Repairs & maintenance
- −$4,032
- − Management
- −$4,032
- − Depreciation
- −$18,182
- Taxable loss
- −$17,839
- Est. tax savings @ 24.0%
- +$4,281
- After-tax cash flow
- $-2,217/yr
For passive investors: Depreciation is non-cash, so a rental often shows a tax loss while cash-flowing — sheltering income. Rental losses are passive: they offset passive income freely, and up to $25,000/yr can offset ordinary (W-2) income if you actively participate and your MAGI is under $100k (phasing out to $0 by $150k); unused losses carry forward. On sale, claimed depreciation is recaptured at up to 25%, and gains may owe capital-gains tax (a 1031 exchange can defer both). Figures are a year-1 estimate at your 24.0% rate — not tax advice; consult a CPA.
Schools (NCES district)
- District
- Southern Cayuga Central School District
- NCES district ID
- 3627570
- Math proficiency
- 61% ▬ 0.00%
- Reading proficiency
- 61% ▲ 7.00%
- Median HH income
- $61,177
- Composite
- 52.98/100
- National rank
- #1524
- State rank
- #214 of 590 in NY
Livability — Aurora
- Score
- 68/100
- State rank
- #530
- US rank
- #9549
Category grades
Schools grade is shown separately in the Schools card above.
Census & demographics
- Census place
- Aurora, NY
- Population (ZIP)
- 1,703
Population outlook (Cayuga County) Hauer SSP2
- Today (2025)
- 74,820 people
- By 2030
- 72,402 · -3.2%
- By 2040
- 66,917 · -10.6%
- By 2050
- 61,007 · -18.5%
- By 2075
- 48,047 · -35.8%
- By 2100
- 34,512 · -53.9%
Race, ethnicity, and origin ACS 2023
- Neighborhood character
- Predominantly White (89%)
- Race & ethnicity
- White 89% Hispanic / Latino 6% Two or more races 4%
- Hispanic origin (detail)
- Mexican 1%
- Common ancestry
- Romanian 3% Lithuanian 3% Subsaharan African 2%
- Foreign-born
- 2% · Canada, Jamaica
- Languages at home
- 95% English-only · Spanish 4% Other Indo-European 1%
Political lean MEDSL · Cayuga
- 2024 margin
- R (+13.0) · D 43.5% · R 56.5%
- 2008→2024 swing
- -21.5pp toward R · 2008: 8.5pp · 2024: -13.0pp
- All cycles
- 2024: R+13.0 2020: R+9.2 2016: R+13.2 2012: D+10.8 2008: D+8.5
Not yet ingested
- Civics
- —
Market trends
- HPI YoY
- ▲ 12.77%
- Current HPI
- 410.3875
- Rent YoY
- —
- Metro
- —
- State GDP YoY
- ▲ 2.60%
- F500 in state
- 92
Industry mix (Fortune 500 HQ in NY)
| Industry | F500 HQs | Revenue |
|---|---|---|
| Financial Services | 10 | $950B |
|
||
| Consumer Goods | 9 | $162B |
|
||
| Insurance | 4 | $225B |
|
||
| Telecommunications | 2 | $144B |
|
||
| Pharmaceuticals | 2 | $112B |
|
||
| Media / Entertainment | 2 | $69B |
|
||
Price history
-21.9% since first listed12 events — show timeline
- 2026-01-03 Pending — CNYIS
- 2025-09-20 Contingent — CNYIS
- 2025-08-28 Relisted — CNYIS
- 2025-05-28 Pending — CNYIS
- 2025-04-19 Contingent — CNYIS
- 2025-04-14 Price Changed $625,000 CNYIS
- 2025-04-12 Listed $599,900 CNYIS
- 2024-11-26 Relisted — CNYIS
- 2024-08-01 Listing Removed — CNYIS
- 2024-07-04 Pending — CNYIS
- 2024-06-24 Listed — CNYIS
- 2024-02-01 Listed $799,900 CNYIS
Property tax history
-2.0%/yrLatest (2025): $3,855 · -50.0% YoY. Source: county tax records.
Cash-flow waterfall
monthlySold comps — $/sqft
last 12 mo · ≤1 miLoading sold comps…