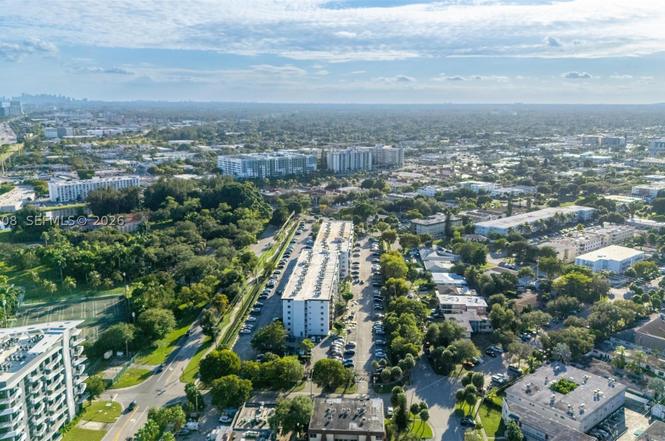
16851 NE 23rd Ave Unit A308 · North Miami Beach, FL
Flood risk 7/10 · Major
- FEMA flood zone
- AE
- Chance of flooding over 30 yrs
- 0.87%
- Est. flood insurance / yr
- $1,737 – $8,500
Fire risk 1/10 · Minimal
- Est. fire insurance / yr
- $947 – $1,759
Heat risk 10/10 · Severe
- Hot days now (above 104°F)
- 7 days/yr
- Hot days in 30 yrs
- 27 days/yr
Wind risk 10/10 · Severe
- Chance of severe wind over 30 yrs
- 99.0%
Air-quality risk 2/10 · Minimal
- Unhealthy air days now
- 1 days/yr
- Unhealthy air days in 30 yrs
- 2 days/yr
Risk factors via First Street. Map © Google.
Why this score? — see what drove the B+ grade
The composite is a weighted blend of 9 inputs, each scored 0–100. Each bar is that input's sub-score; the figure is the points it added to the 100-point composite (weight × sub-score).
- Cash flow +30.0/30.0
- 1% rule +10.0/10.0
- DSCR +10.0/10.0
- ARV discount +7.5/15.0
- Appreciation +5.3/10.0
- Schools +4.2/10.0
- Livability +4.1/5.0
- Rent growth +2.7/5.0
- Condition / age +2.5/5.0
$149,900
🖨 Deal sheet 📄 Offer letter ✓ Due diligence
Listing remarks
Great opportunity to own or invest in desirable North Miami Beach. This 1-bedroom, 1-bath condo offers 720 sq. ft. of living space with plenty of potential to renovate and personalize. The unit features impact windows, an impact sliding door, and a screened balcony. WOODSIDE CONDOMINIUM is fully gated and offers a pool, clubhouse, elevator, and laundry room conveniently located on the same floor. Immediate rentals allowed (fee applies), making this an excellent option for investors with no waiting period. Ideally located just minutes from the beach, close to shopping, dining, public transportation, places of worship, and major highways. Directly across from the historic Ancient Spanish Mona
Key facts
- Parking
- Community pool
- Built 1973
Property features AI
Finance
- Financial info: Pets not allowed
- HOA & community: Monthly association fee; Association fee includes amenities, common areas, structure maintenance, trash, and water; Association amenities: clubhouse, elevator(s), laundry, pool
Exterior
- Parking: One parking space
- Security: Intercom; Fire alarm; Complex fenced
- Utilities: Association pool
- Home design: 6-story building; Entry on level 3; Attached property
- Construction: Block construction; Resale property
- Exterior features: Balcony; Screened balcony; Security/high impact doors; Fire alarm; Intercom; Complex fenced
Interior
- Kitchen: Dishwasher; Refrigerator
- Flooring: Ceramic tile
- Bathrooms: 1 full bathroom
- Heating & cooling: Central heating; Central air; Ceiling fan(s)
- Interior features: Impact glass windows; Walk-in closet(s)
- Laundry & utility: Common area laundry
Neighborhood map
What this means for you Summary
Snapshot
- This is a 1-bed/1.0-bath condo listed at $150k.
Deal economics
- At list price, monthly cash flow is $690 ($8k/yr) — positive.
- The deal already cash-flows at list — no discount required.
- Meets the 1% rule at list price ($3k rent vs $150k).
- Cap rate 15.2% vs local median 5.2% in North Miami Beach — top-decile yield for the area; either an underpriced asset or a hidden risk that comps aren't pricing in. Stress-test before assuming the spread holds.
Location & tenants
- Location reads 82/100 on livability (#71 in FL, #1,177 nationally) — a professional / high-income tenant draw. Strengths: commute A+, housing A+, health & safety A+; Watch: employment D+, crime F.
- Miami-Dade (suburban): math 45% / reading 54% proficiency, ranked #40 of 73 in FL (top 55%) — families likely to look elsewhere, expect single-tenant / working-renter base with shorter leases; 64% free/reduced lunch — lower-income household profile, screen leases tightly.
- Market conditions: Rents flat; 1870 active listings in the ZIP; 10,051 units permitted in Miami-Dade County in 2024 (7,758 in 5+ unit buildings).
- At $3,111/mo this rent would consume 56% of the median local household income ($67k/yr) (locally 3106% of renters already pay >50% of income on rent) — very limited rent-growth headroom before tenants either downsize or default.
Forward outlook
- In year one you build about $2k of equity ($1k loan paydown + $790 appreciation (0.5% local appreciation)).
- Miami-Dade County population projected at +28% by 2050 — long-run rental-demand tailwind backs the buy-and-hold thesis.
- At projected returns (0.5% appreciation + 0.9% rent growth), your $42k cash investment doubles in ~5 years — after that, you're playing with house money.
Negotiation context
- Only 1 days on market — expect competitive offers; lowballing is unlikely to land.
- 2 sale attempts with the ask held roughly flat each time — persistent listings suggest the price (not the market) is what's stuck; bring a comps-based counter.
- Current owner paid $24k; list at $150k implies a 525% gain — meaningful room to come down on a strong offer.
Risks & watch-outs
- Watch-outs: flood insurance adds $427/mo.
- Climate carrying-cost: in FEMA flood zone AE (mandatory federal flood insurance); severe wind risk, 99% chance of damaging wind over 30y; extreme-heat days projected 7→27/yr by 2055 (HVAC capex compounding) — expect insurance premiums to compound above CPI over the hold.
Questions for the listing agent
- Built in 1973 — when were the roof, HVAC, electrical panel, plumbing, and water heater last replaced?
- What's the actual annual flood-insurance premium (NFIP or private), and is the property in a SFHA with mandatory coverage?
- What does the HOA fee cover, when was the last increase, and are there any pending special assessments or reserve-fund shortfalls?
- Any open or pending special assessments — roof, HVAC, plumbing, elevator, façade? What's the per-unit balance and payoff schedule, and is the seller paying it off at close or rolling it to the buyer?
- Is there a deadline driving the sale (1031 exchange, divorce, estate, relocation)? That informs how much negotiation room exists.
- Crime grade is F in this area — have there been break-ins, vandalism, or insurance claims at this property in the last 3 years? What carrier currently insures it and at what premium?
- What's the average days-on-market for RENTAL listings here right now (not sales)? A rising rental-DOM trend means longer vacancies and softer asking-rent achievability than the comps imply.
- What's the recent tenant-quality profile in this submarket — average credit score on applications, eviction rate, late-payment / NSF rate, and stable-employment percentage? A property-management company in the area should have these aggregated.
- How much new apartment / multifamily construction is in the pipeline within 1–3 miles? Heavy new supply (>2% of stock underway) typically softens rents 12–24 months out; light construction supports rent growth.
Investment metrics
- 1% rule
- 2.08% ✓
- Cap rate
- 15.23%
- Cash-on-cash
- 31.93%
- DSCR
- 2.42
- GRM
- 4.0
CMA / ARV
No comps found within radius.
Projected returns pro-forma
0.53% appreciation · 0.94% rent growth · sell at horizon
- IRR
- 18.4%
- Equity multiple
- 1.89×
- Total profit
- $37,504
- Equity at exit
- $47,517
- IRR
- 20.3%
- Equity multiple
- 3.15×
- Total profit
- $90,404
- Equity at exit
- $60,409
Cash invested: $41,972 (down + closing). Projections, not guarantees.
Landlord ↔ Tenant lean methodology
- Overall (STATE)
- 87 Strongly Landlord-Friendly
- State Florida
- 87 Strongly Landlord-Friendly · R+3
- County
- — inherits STATE
- City
- — inherits STATE
ZIP-level market 33160
- Home prices YoY
- 0.2%
- Rents YoY
- 0.9%
- Active inventory
- 1870
- Price-to-rent
- 4.0×
Monthly cashflow live
- Estimated rent
- $3,111 medium interval (Pro) →
- Mortgage (P&I)
- −$786
- Tax from tax record
- −$25 /mo · $305/yr
- Insurance
- −$62
- Flood insurance flood zone
- −$427 /mo · $5,118/yr
- HOA est. from 5 same-building comps
- −$467
- Vacancy / Maint / Mgmt
- −$653
- Net cashflow
- $690
Break-even live
UW: 25.0% down · 7.5% · 30yr · 1.5% tax · 5.0% vac · 8.0% maint · 8.0% mgmt
Financing live
Cash to close
- Down payment
- $37,475
- Closing costs
- $4,497
- Reserves months
- —
- Total cash needed
- —
Loan-product check · same deal, 3 products live
Conventional
25% down · 7.5% · 30yr
- Down + closing
- —
- Monthly P&I
- —
- Monthly cashflow
- —
- DSCR
- —
- Eligible?
- —
Personal DTI + credit; lowest rate.
DSCR
20% down · 8.5% · 30yr
- Down + closing
- —
- Monthly P&I
- —
- Monthly cashflow
- —
- DSCR
- —
- Eligible?
- —
No personal income docs; deal must DSCR.
Hard money
10% down · 12.0% · 12mo
- Down + closing
- —
- Monthly P&I
- —
- Monthly cashflow
- —
- DSCR
- —
- Eligible?
- —
Short-term bridge; refi at stabilization.
HOA detail condo
- Monthly dues
- $0 · $0/yr
- Likely covers
- poolsecurity
- Assessments
- None detected in remarks — confirm with the listing agent.
Listing history 14 events
-
2026-06-18pricedays on market $149,900 Active 1 DOM
-
2026-06-09days on market $155,000 Active 172 DOM
-
2026-06-08days on market $155,000 Active 171 DOM
-
2026-06-07days on market $155,000 Active 170 DOM
-
2026-06-04days on market $155,000 Active 167 DOM
-
2026-06-03days on market $155,000 Active 166 DOM
-
2026-06-02days on market $155,000 Active 165 DOM
-
2026-06-01days on market $155,000 Active 164 DOM
-
2026-05-31days on market $155,000 Active 163 DOM
-
2025-12-19$155,000 Active
-
2025-11-18historical
-
2025-07-24$159,000 Active
-
1998-10-06soldstatus $24,000
-
1973-11-01soldstatus $25,400
ⓘ Source: listings_history table (triggers on properties + properties_extension) + one-shot
backfill from property_details.listing_events for pre-trigger history.
Tax reassessment forecast FL · Resets to sale price
- Current annual tax
- $305 · $25/mo
- Projected year-2 tax
- $1,244 · $104/mo
- Expected delta
- +$939/yr (+$78/mo · 307.8%)
ⓘ Screening estimate from a state-policy table — verify with the county assessor before closing.
Climate risk First Street
- Flood 7/10 Severe FEMA zone AE · 87% chance over 30 yrs
- Wildfire 1/10 Low
- Heat 10/10 Extreme 7 d/yr ≥104°F today · 27 d/yr by 30 yrs out
- Wind 10/10 Extreme 99% chance of damaging wind over 30 yrs
- Air quality 2/10 Low 1 unhealthy d/yr today · 2 by 30 yrs out
Nearby sold comps map
Loading sold comps map…
Walkable amenities ~0.75 mi
Loading nearby amenities…
Taxation est. · year 1
- Rental income
- $37,333
- − Mortgage interest
- −$8,397
- − Property taxes
- −$305
- − Insurance
- −$5,868
- − Repairs & maintenance
- −$2,987
- − Management
- −$2,987
- − HOA
- −$5,604
- − Depreciation
- −$4,361
- Taxable income
- $6,825
- Est. tax owed @ 24.0%
- −$1,638
- After-tax cash flow
- $6,645/yr
For passive investors: Depreciation is non-cash, so a rental often shows a tax loss while cash-flowing — sheltering income. Rental losses are passive: they offset passive income freely, and up to $25,000/yr can offset ordinary (W-2) income if you actively participate and your MAGI is under $100k (phasing out to $0 by $150k); unused losses carry forward. On sale, claimed depreciation is recaptured at up to 25%, and gains may owe capital-gains tax (a 1031 exchange can defer both). Figures are a year-1 estimate at your 24.0% rate — not tax advice; consult a CPA.
Schools (NCES district)
- District
- Miami-Dade
- NCES district ID
- 1200390
- Math proficiency
- 45% ▼ -16.00%
- Reading proficiency
- 54% ▼ -5.00%
- Median HH income
- $43,928
- Composite
- 41.76/100
- National rank
- #3397
- State rank
- #40 of 73 in FL
Livability — North Miami Beach
- Score
- 82/100
- State rank
- #71
- US rank
- #1177
Category grades
Schools grade is shown separately in the Schools card above.
Census & demographics
- Census place
- North Miami Beach, FL
- County
- Miami-Dade County · 2,697,751 people
- City population
- 34,147
- Metro
- Miami-Fort Lauderdale-Pompano Beach, FL
- Population (ZIP)
- 43,718
- Household income
- $67,040
- Rent vs Own
- Severe rent burden
- 3106.0
Population outlook (Miami-Dade County) Hauer SSP2
- Today (2025)
- 3,126,439 people
- By 2030
- 3,325,765 · +6.4%
- By 2040
- 3,697,561 · +18.3%
- By 2050
- 4,012,134 · +28.3%
- By 2075
- 4,605,612 · +47.3%
- By 2100
- 4,866,598 · +55.7%
Race, ethnicity, and origin ACS 2023
- Neighborhood character
- Diverse neighborhood (Simpson 0.59)
- Race & ethnicity
- Hispanic / Latino 46% White 44% Two or more races 27% Black 4% Asian 2%
- Hispanic origin (detail)
- Mexican 1% Puerto Rican 3% Cuban 8% Dominican 1% Salvadoran 4%
- Common ancestry
- Scotch-Irish 8% Hispanic 3% Subsaharan African 3%
- Foreign-born
- 61% · Canada, Jamaica, Dominican Republic
- Languages at home
- 29% English-only · Spanish 45% Russian/Polish/Slavic 12% Other Indo-European 5%
Political lean MEDSL · Miami-Dade
- 2024 margin
- R (+11.4) · D 43.9% · R 55.4%
- 2008→2024 swing
- -27.6pp toward R · 2008: 16.1pp · 2024: -11.4pp
- All cycles
- 2024: R+11.4 2020: D+7.3 2016: D+29.6 2012: D+23.7 2008: D+16.1
Not yet ingested
- Civics
- —
Market trends
- HPI YoY
- ▲ 0.53%
- Current HPI
- 284.9293
- Rent YoY
- ▲ 0.94%
- Metro
- Miami-Fort Lauderdale-Pompano Beach, FL
- State GDP YoY
- ▲ 3.28%
- F500 in state
- 36
Industry mix (Fortune 500 HQ in FL)
| Industry | F500 HQs | Revenue |
|---|---|---|
| Industrial Technology | 2 | $29B |
|
||
| Insurance | 2 | $17B |
|
||
| Retail | 1 | $60B |
|
||
| Technology Distribution | 1 | $58B |
|
||
| Homebuilding | 1 | $35B |
|
||
| Technology Manufacturing | 1 | $35B |
|
||
Price history
+510.2% since first listed5 events — show timeline
- 2025-12-19 Listed $155,000 MARMLS
- 2025-11-18 Listing Removed — MARMLS
- 2025-07-24 Listed $159,000 MARMLS
- 1998-10-06 Sold (Public Records) $24,000 Public Records
- 1973-11-01 Sold (Public Records) $25,400 Public Records
Property tax history
-5.9%/yrLatest (2025): $305 · +4.5% YoY. Source: county tax records.
Cash-flow waterfall
monthlySold comps — $/sqft
last 12 mo · ≤1 miLoading sold comps…