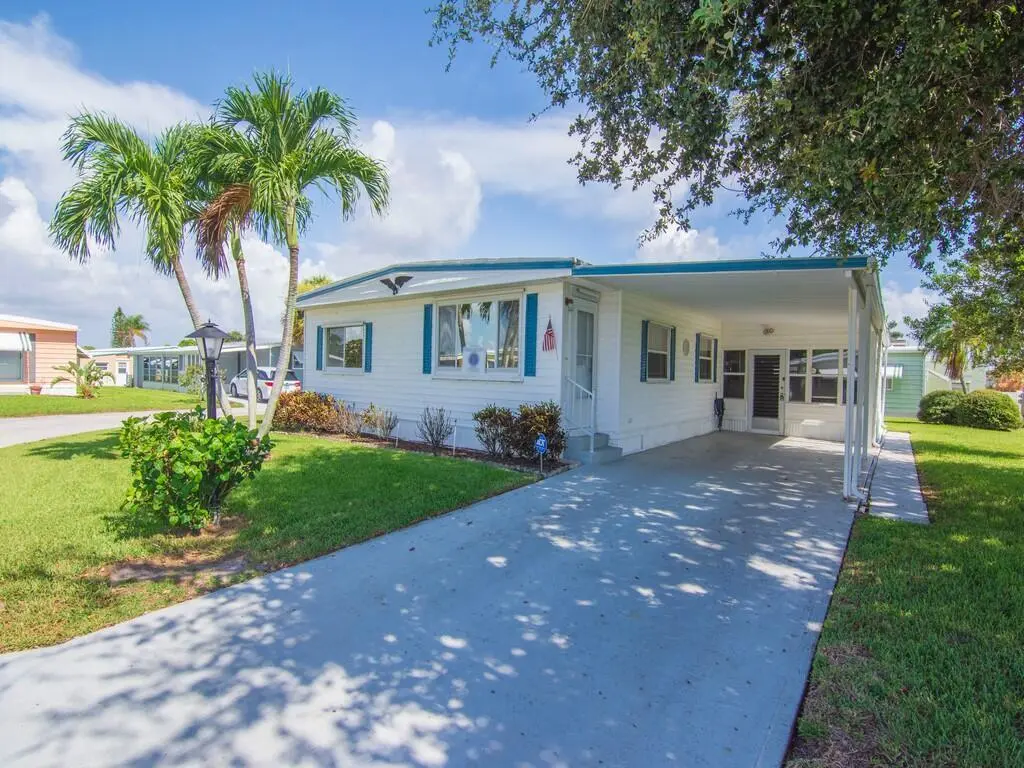
264 NE Cameo Way · Jensen Beach, FL
Flood risk 4/10 · Minor
- FEMA flood zone
- X (unshaded)
- Chance of flooding over 30 yrs
- 0.22%
- Est. flood insurance / yr
- $507 – $1,088
Fire risk 1/10 · Minimal
- Est. fire insurance / yr
- $947 – $1,759
Heat risk 10/10 · Severe
- Hot days now (above 106°F)
- 7 days/yr
- Hot days in 30 yrs
- 24 days/yr
Wind risk 10/10 · Severe
- Chance of severe wind over 30 yrs
- 99.0%
Air-quality risk 2/10 · Minimal
- Unhealthy air days now
- 2 days/yr
- Unhealthy air days in 30 yrs
- 2 days/yr
Risk factors via First Street. Map © Google.
Why this score? — see what drove the C- grade
The composite is a weighted blend of 9 inputs, each scored 0–100. Each bar is that input's sub-score; the figure is the points it added to the 100-point composite (weight × sub-score).
- Cash flow +15.0/30.0
- ARV discount +15.0/15.0
- 1% rule +5.0/10.0
- DSCR +5.0/10.0
- Schools +4.5/10.0
- Livability +3.5/5.0
- Rent growth +2.8/5.0
- Condition / age +2.5/5.0
- Appreciation +0.0/10.0
$45,000
🖨 Deal sheet 📄 Offer letter ✓ Due diligence
Listing remarks
Welcome to this beautifully maintained home located in one of Jensen Beach's most desirable neighborhoods. This residence offers comfortable living just minutes from beaches, shopping and dining. Step inside to an inviting open layout featuring spacious living and dining areas, perfect for both everyday living and entertaining. The kitchen offers newer stainless steel appliances. The primary suite provides a peaceful retreat with a well appointed bathroom and excellent closet space. Enjoy Florida living year round on the private patio ideal for relaxing, gardening, or hosting gatherings. Additional highlights include a dedicated laundry area, abundant storage, and a well kept exterior with
Key facts
- Great curb appeal
- Open layout
- Private patio
Tags
Property features AI
Finance
- Financial info: Land lease required (monthly land lease payment); Property located in a senior community; Pets allowed with possible restrictions
- HOA & community: Community has association with monthly fee; Association amenities include clubhouse, pool, fitness center, billiard room, game room, community room, library, storage, management, and on-site manager; Monthly association fee
Exterior
- Parking: 3 total parking spaces; Attached carport (1 covered carport space) and driveway; Open parking space
- Utilities: Public water and well; Public sewer; Three-phase electric; Cable available; Electricity available; Sewer available; Water available; Underground utilities
- Home design: Manufactured home (double wide, modular); One level; Resale; Faces south
- Construction: Vinyl siding; Metal roof; Concrete perimeter foundation; Mobile home remains present (36' x 24')
- Exterior features: Screened patio and screened porch; Patio; Porch; Not waterfront
Interior
- Kitchen: Dishwasher; Electric range; Microwave; Refrigerator; Electric water heater
- Bedrooms: 2 bedrooms on the main level
- Flooring: Concrete; Laminate; Wood
- Bathrooms: 2 full bathrooms on the main level
- Heating & cooling: Central heating; Central air; Ceiling fan(s); Wall/window unit(s)
- Interior features: Split bedroom layout; Unfurnished
- Laundry & utility: Interior laundry room with washer and electric dryer hookups
Neighborhood map
What this means for you Summary
Snapshot
- This is a 2-bed/2.0-bath manufactured listed at $45k.
Deal economics
- At list price, monthly cash flow is $655 ($8k/yr) — positive.
- The deal already cash-flows at list — no discount required.
- Meets the 1% rule at list price ($2k rent vs $45k).
- Recommended offer: $44k (3.0% below list) — sets the bar for market timing.
- Cap rate 23.7% vs local median 4.1% in Jensen Beach — top-decile yield for the area; either an underpriced asset or a hidden risk that comps aren't pricing in. Stress-test before assuming the spread holds.
Location & tenants
- Location reads 70/100 on livability (#432 in FL) — a middle-class / working-renter tenant base. Strengths: crime A+, housing A+, cost of living B+; Watch: amenities F, commute F, health & safety D-.
- Martin (suburban): math 52% / reading 53% proficiency, ranked #24 of 73 in FL (top 33%) — acceptable for families but not a draw, mixed tenant base, ~2y average lease.
- Zoned schools: Jensen Beach Elementary School (math 67% / reading 67%, grade B+, #450 of 2,144 statewide, top 22%, 558 students, 45% FRL); Stuart Middle School (math 55% / reading 55%, grade B-, #180 of 571 statewide, top 32%, 867 students, 49% FRL); Jensen Beach High School (math 53% / reading 71%, grade B-, #98 of 667 statewide, top 15%, 1,584 students, 36% FRL) — zoned schools at 43% FRL track the district average.
- Market conditions: Rents rising (+1.0%/yr); 536 active listings in the ZIP; 28 comparable units currently listed for rent nearby; rentals at typical pace (median 23d on market — plan ~3-4 weeks tenant-placement turnaround); 737 units permitted in Martin County in 2024 (167 in 5+ unit buildings).
- This rent runs 38% of the median local income ($70k/yr) — at the standard rent-burdened threshold; future hikes will face affordability resistance.
Forward outlook
- Local home prices are declining (-3.0%/yr); year-one equity from $311 of loan paydown is wiped out by about $1k of value loss. Plan a longer hold.
- Martin County population projected at +19% by 2050 — long-run rental-demand tailwind backs the buy-and-hold thesis.
- At projected returns (-3.0% appreciation + 1.0% rent growth), your $13k cash investment doubles in ~2 years — after that, you're playing with house money.
Negotiation context
- It's been on market 45 days — a 3% lower offer ($44k) is reasonable based on typical stale-listing flexibility.
- 4 sale attempts since 2y ago with the ask held roughly flat each time — persistent listings suggest the price (not the market) is what's stuck; bring a comps-based counter.
Risks & watch-outs
- Watch-outs: HOA is 36% of rent.
- Climate carrying-cost: severe wind risk, 99% chance of damaging wind over 30y; extreme-heat days projected 7→24/yr by 2055 (HVAC capex compounding) — expect insurance premiums to compound above CPI over the hold.
Questions for the listing agent
- It's been on market 45 days. Have you received any prior offers? Is the seller open to a 3% concession, seller financing, or rate buy-down credit?
- What does the HOA fee cover, when was the last increase, and are there any pending special assessments or reserve-fund shortfalls?
- Is there a deadline driving the sale (1031 exchange, divorce, estate, relocation)? That informs how much negotiation room exists.
- Schools are B-rated — typically a magnet for longer-tenancy family renters. What's the average tenant stay here, and is there a school-zone premium baked into asking?
- What's the average days-on-market for RENTAL listings here right now (not sales)? A rising rental-DOM trend means longer vacancies and softer asking-rent achievability than the comps imply.
- What's the recent tenant-quality profile in this submarket — average credit score on applications, eviction rate, late-payment / NSF rate, and stable-employment percentage? A property-management company in the area should have these aggregated.
- How much new for-sale + rental construction is in the pipeline within 1–3 miles? Heavy new supply typically softens prices + rents 12–24 months out; constrained supply supports both.
Investment metrics
- 1% rule
- 4.98% ✓
- Cap rate
- 23.75%
- Cash-on-cash
- 62.34%
- DSCR
- 3.77
- GRM
- 1.7
CMA / ARV
- ARV (median comp)
- $74,118
- List price
- $45,000
- Delta
- -39.29%
- Verdict
- UNDERPRICED
- Comps
- 10 within 1.0 mi
Show comp detail 7 sales within ~0.75 mi
| Address | Dist | Beds/Ba | Sqft | Sold | Price | $/sf | Match |
|---|---|---|---|---|---|---|---|
| 309 NE Pinelake Village Blvd | 0.07mi | 2/2.0 | 1,100 (+2%) | 0mo | $95,000 | $86 | 93 |
| 300 NE Opal Dr | 0.08mi | 2/2.0 | 1,080 (0%) | 9mo | $79,000 | $73 | 89 |
| 434 NE Topaz Ter | 0.18mi | 2/2.0 | 1,152 (+7%) | 6mo | $50,000 | $43 | 76 |
| 151 Sharyon Ln | 0.24mi | 2/2.0 | 1,152 (+7%) | 4mo | $89,000 | $77 | 74 |
| 4 N North Warner Dr | 0.32mi | 2/2.0 | 1,152 (+7%) | 1mo | $62,500 | $54 | 73 |
| 609 Garden Vw | 0.33mi | 2/2.0 | 1,016 (-6%) | 16mo | $89,000 | $88 | 62 |
| 75 S Warner Dr | 0.29mi | 2/2.0 | 1,200 (+11%) | 14mo | $49,900 | $42 | 56 |
Match score weights: distance 35% · size 25% · config 20% · recency 20%. Top-matched comps best support the ARV.
Projected returns pro-forma
-3.0% appreciation · 1.0% rent growth · sell at horizon
- IRR
- 57.5%
- Equity multiple
- 3.42×
- Total profit
- $30,505
- Equity at exit
- $6,710
- IRR
- 61.2%
- Equity multiple
- 6.16×
- Total profit
- $64,963
- Equity at exit
- $3,891
Cash invested: $12,600 (down + closing). Projections, not guarantees.
Landlord ↔ Tenant lean methodology
- Overall (STATE)
- 87 Strongly Landlord-Friendly
- State Florida
- 87 Strongly Landlord-Friendly · R+3
- County
- — inherits STATE
- City
- — inherits STATE
ZIP-level market 34957
- Rents YoY
- 1.0%
- Active inventory
- 536
- Price-to-rent
- 1.7×
Monthly cashflow live
- Estimated rent
- $2,241 high interval (Pro) →
- Mortgage (P&I)
- −$236
- Tax est. 1.5%
- −$56 /mo · $675/yr
- Insurance
- −$19
- HOA
- −$805
- Vacancy / Maint / Mgmt
- −$471
- Net cashflow
- $655
Break-even live
UW: 25.0% down · 7.5% · 30yr · 1.5% tax · 5.0% vac · 8.0% maint · 8.0% mgmt
Financing live
Cash to close
- Down payment
- $11,250
- Closing costs
- $1,350
- Reserves months
- —
- Total cash needed
- —
Loan-product check · same deal, 3 products live
Conventional
25% down · 7.5% · 30yr
- Down + closing
- —
- Monthly P&I
- —
- Monthly cashflow
- —
- DSCR
- —
- Eligible?
- —
Personal DTI + credit; lowest rate.
DSCR
20% down · 8.5% · 30yr
- Down + closing
- —
- Monthly P&I
- —
- Monthly cashflow
- —
- DSCR
- —
- Eligible?
- —
No personal income docs; deal must DSCR.
Hard money
10% down · 12.0% · 12mo
- Down + closing
- —
- Monthly P&I
- —
- Monthly cashflow
- —
- DSCR
- —
- Eligible?
- —
Short-term bridge; refi at stabilization.
Rent comps 28 comps
| Address | Beds | Baths | Sqft | Rent | $/sqft | DOM | Units | Dist |
|---|---|---|---|---|---|---|---|---|
| 1622 NE Maureen Ct Jensen Beach, FL | 2.0 | 1.0 | 780 | $1,800 | $2.31 | 13d | 1 | 0.24mi |
| 1585 NE Beacon Dr #1103 Jensen Beach, FL | 2.0 | 2.0 | 961 | $1,495 | $1.56 | 23d | 1 | 0.26mi |
| 1617 NE Nautical Pl Jensen Beach, FL | 2.0 | 2.0 | 961 | $1,850 | $1.93 | 13d | 1 | 0.32mi |
| 1411 NE 14th Ct #13 Jensen Beach, FL | 2.0 | 2.0 | 1100 | $3,000 | $2.73 | 23d | 1 | 0.40mi |
| 1999 NE Collins Cir Unit 3-80 Jensen Beach, FL | 2.0 | 2.0 | 1067 | $1,775 | $1.66 | 23d | 1 | 0.46mi |
| 2013 NE Collins Cir #50 Jensen Beach, FL | 2.0 | 2.0 | 903 | $1,800 | $1.99 | 13d | 1 | 0.48mi |
| 1971 NE Collins Cir #20 Jensen Beach, FL | 2.0 | 2.0 | 1037 | $1,750 | $1.69 | 23d | 1 | 0.48mi |
| 1600 NE Dixie Hwy Unit 10-203 Jensen Beach, FL | 2.0 | 2.0 | 1072 | $2,300 | $2.15 | 23d | 1 | 0.50mi |
| 1550 NE 13th Ter Unit B16 Jensen Beach, FL | 2.0 | 2.0 | 1272 | $1,800 | $1.42 | 23d | 1 | 0.51mi |
| 2563 NE Palm Ave Jensen Beach, FL | 2.0 | 2.0 | 950 | $2,400 | $2.53 | 23d | 1 | 0.69mi |
| 2459 NE Hickory Ave Jensen Beach, FL | 1.0 | 1.0 | 736 | $1,700 | $2.31 | 23d | 1 | 0.71mi |
| 2506 NE Heron's Walk Jensen Beach, FL | 2.0 | 1.0 | 1000 | $2,400 | $2.40 | 23d | 1 | 0.81mi |
| 1903 NE Media Ave Jensen Beach, FL | 2.0 | 2.0 | 1324 | $2,400 | $1.81 | 23d | 1 | 0.82mi |
| 2680 NE Indian River Dr Unit 9 Jensen Beach, FL | 2.0 | 1.0 | 800 | $2,100 | $2.62 | 13d | 1 | 0.83mi |
| 2646 NE Pelican Way Jensen Beach, FL | 1.0 | 1.0 | 1000 | $2,400 | $2.40 | 23d | 1 | 0.84mi |
| 2632 NE Pelican Way Jensen Beach, FL | 2.0 | 1.0 | 1000 | $4,800 | $4.80 | 23d | 1 | 0.85mi |
| 2831 NE Savannah Rd Jensen Beach, FL | 3.0 | 2.0 | 1248 | $3,000 | $2.40 | 23d | 1 | 0.86mi |
| 590 NE Lima Vias Jensen Beach, FL | 2.0 | 2.0 | 1295 | $3,300 | $2.55 | 23d | 1 | 0.97mi |
| 2952 NE Savannah Rd Jensen Beach, FL | 3.0 | 2.0 | 1056 | $3,000 | $2.84 | 23d | 1 | 0.97mi |
| 1097 NE Kubin Ave Jensen Beach, FL | 2.0 | 1.5 | 952 | $2,450 | $2.57 | 23d | 1 | 0.98mi |
| 297 NE Coastal DR #297 Jensen Beach, FL | 2.0 | 2.0 | 1000 | $3,000 | $3.00 | 23d | 1 | 1.01mi |
| 1001 NE Baker Rd Stuart, FL | 1.0–3.0 | 1.0–2.0 | 952 | $2,280 | $2.40 | 13d | 27 | 1.03mi |
| 3111 NE Savannah Rd Jensen Beach, FL | 2.0 | 1.0 | 1085 | $1,995 | $1.84 | 13d | 1 | 1.06mi |
| 3121 NE Savannah Rd Unit 3121 Jensen Beach, FL | 3.0 | 1.0 | 1085 | $2,095 | $1.93 | 23d | 1 | 1.07mi |
| 3123 NE Savannah Rd Unit 3123 Jensen Beach, FL | 3.0 | 2.0 | 1100 | $2,195 | $2.00 | 23d | 1 | 1.08mi |
| 3450 NE Linda Dr Jensen Beach, FL | 2.0 | 1.0 | 1240 | $2,500 | $2.02 | 23d | 1 | 1.32mi |
| 25 NE 17th St Stuart, FL | 3.0 | 2.0 | 990 | $2,000 | $2.02 | 23d | 1 | 1.39mi |
| 1315 NE Flora Pl Jensen Beach, FL | 3.0 | 2.0 | 1400 | $3,000 | $2.14 | 23d | 1 | 1.47mi |
HOA detail
- Monthly dues
- $805 · $9,660/yr
Listing history 27 events
-
2026-06-18days on market $45,000 Active 45 DOM
-
2026-06-17days on market $45,000 Active 44 DOM
-
2026-06-16days on market $45,000 Active 43 DOM
-
2026-06-15days on market $45,000 Active 42 DOM
-
2026-06-14days on market $45,000 Active 40 DOM
-
2026-06-13days on market $45,000 Active 39 DOM
-
2026-06-10days on market $45,000 Active 37 DOM
-
2026-06-09days on market $45,000 Active 36 DOM
-
2026-06-08days on market $45,000 Active 35 DOM
-
2026-06-07days on market $45,000 Active 34 DOM
-
2026-06-03days on market $45,000 Active 30 DOM
-
2026-06-02days on market $45,000 Active 29 DOM
-
2026-06-01days on market $45,000 Active 28 DOM
-
2026-05-31days on market $45,000 Active 27 DOM
-
2026-05-31days on market $45,000 Active 26 DOM
-
2026-05-04$45,000 Active 717-char remark
-
2026-04-30historical
-
2026-02-17price $45,000
-
2026-01-22status Active
-
2026-01-16historical
-
2025-12-04price $59,500
-
2025-10-08price $65,000
-
2025-04-14$69,500 Active
-
2025-04-01historical
-
2025-02-08price $69,500
-
2025-02-06price $84,900
-
2024-07-24$90,000 Active
ⓘ Source: listings_history table (triggers on properties + properties_extension) + one-shot
backfill from property_details.listing_events for pre-trigger history.
Climate risk First Street
- Flood 4/10 Moderate FEMA zone X (unshaded) · 22% chance over 30 yrs
- Wildfire 1/10 Low
- Heat 10/10 Extreme 7 d/yr ≥106°F today · 24 d/yr by 30 yrs out
- Wind 10/10 Extreme 99% chance of damaging wind over 30 yrs
- Air quality 2/10 Low 2 unhealthy d/yr today · 2 by 30 yrs out
Nearby sold comps map
Loading sold comps map…
Walkable amenities ~0.75 mi
Loading nearby amenities…
Taxation est. · year 1
- Rental income
- $26,895
- − Mortgage interest
- −$2,521
- − Property taxes
- −$675
- − Insurance
- −$225
- − Repairs & maintenance
- −$2,152
- − Management
- −$2,152
- − HOA
- −$9,660
- − Depreciation
- −$1,309
- Taxable income
- $8,202
- Est. tax owed @ 24.0%
- −$1,968
- After-tax cash flow
- $5,887/yr
For passive investors: Depreciation is non-cash, so a rental often shows a tax loss while cash-flowing — sheltering income. Rental losses are passive: they offset passive income freely, and up to $25,000/yr can offset ordinary (W-2) income if you actively participate and your MAGI is under $100k (phasing out to $0 by $150k); unused losses carry forward. On sale, claimed depreciation is recaptured at up to 25%, and gains may owe capital-gains tax (a 1031 exchange can defer both). Figures are a year-1 estimate at your 24.0% rate — not tax advice; consult a CPA.
Schools (NCES district)
- District
- Martin
- NCES district ID
- 1201290
- Math proficiency
- 52% ▼ -14.00%
- Reading proficiency
- 53% ▼ -4.00%
- Median HH income
- $52,482
- Composite
- 45.1/100
- National rank
- #2690
- State rank
- #24 of 73 in FL
Livability — Jensen Beach
- Score
- 70/100
- State rank
- #432
- US rank
- #7719
Category grades
Schools grade is shown separately in the Schools card above.
Census & demographics
- Census place
- Jensen Beach, FL
- County
- Martin County · 165,223 people
- City population
- 23,462
- Metro
- Port St. Lucie, FL
- Population (ZIP)
- 23,462
- Household income
- $70,403
- Rent vs Own
- Severe rent burden
- 946.0
Population outlook (Martin County) Hauer SSP2
- Today (2025)
- 172,383 people
- By 2030
- 180,192 · +4.5%
- By 2040
- 194,114 · +12.6%
- By 2050
- 204,992 · +18.9%
- By 2075
- 229,641 · +33.2%
- By 2100
- 232,146 · +34.7%
Race, ethnicity, and origin ACS 2023
- Neighborhood character
- Predominantly White (85%)
- Race & ethnicity
- White 85% Hispanic / Latino 7% Two or more races 6% Asian 2% Black 2%
- Hispanic origin (detail)
- Mexican 1% Puerto Rican 2% Cuban 1%
- Common ancestry
- Romanian 4% Slovak 3% Lithuanian 3%
- Foreign-born
- 10% · Canada, Jamaica
- Languages at home
- 90% English-only · Spanish 5% Other Indo-European 2% Tagalog/Filipino 1%
Political lean MEDSL · Martin
- 2024 margin
- Solid R (+31.1) · D 34.1% · R 65.2%
- 2008→2024 swing
- -17.5pp toward R · 2008: -13.6pp · 2024: -31.1pp
- All cycles
- 2024: R+31.1 2020: R+24.6 2016: R+26.9 2012: R+22.9 2008: R+13.6
Not yet ingested
- Civics
- —
Market trends
- HPI YoY
- ▼ -319.66%
- Current HPI
- 340.0172
- Rent YoY
- ▲ 1.00%
- Metro
- Port St. Lucie, FL
- State GDP YoY
- ▲ 3.28%
- F500 in state
- 36
Industry mix (Fortune 500 HQ in FL)
| Industry | F500 HQs | Revenue |
|---|---|---|
| Industrial Technology | 2 | $29B |
|
||
| Insurance | 2 | $17B |
|
||
| Retail | 1 | $60B |
|
||
| Technology Distribution | 1 | $58B |
|
||
| Homebuilding | 1 | $35B |
|
||
| Technology Manufacturing | 1 | $35B |
|
||
Price history
-50.0% since first listed12 events — show timeline
- 2026-05-04 Listed $45,000 Beaches MLS
- 2026-04-30 Listing Removed — Beaches MLS
- 2026-02-17 Price Changed $45,000 Beaches MLS
- 2026-01-22 Relisted — Beaches MLS
- 2026-01-16 Listing Removed — Beaches MLS
- 2025-12-04 Price Changed $59,500 Beaches MLS
- 2025-10-08 Price Changed $65,000 Beaches MLS
- 2025-04-14 Listed $69,500 Beaches MLS
- 2025-04-01 Listing Removed — Beaches MLS
- 2025-02-08 Price Changed $69,500 Beaches MLS
- 2025-02-06 Price Changed $84,900 Beaches MLS
- 2024-07-24 Listed $90,000 Beaches MLS
Cash-flow waterfall
monthlySold comps — $/sqft
last 12 mo · ≤1 miLoading sold comps…