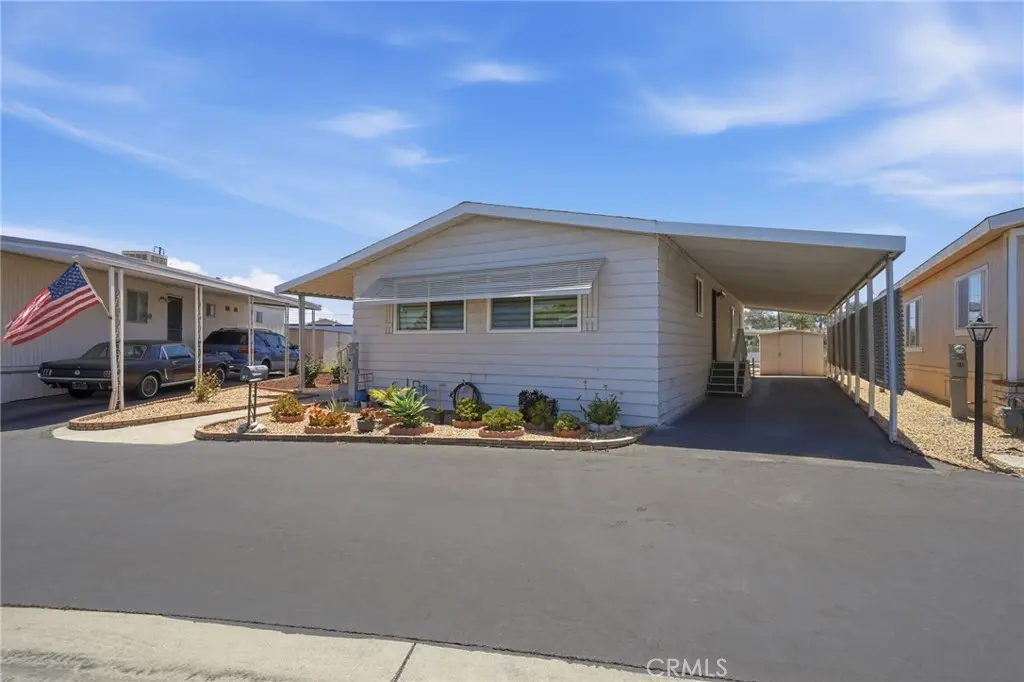
1201 W Valencia #97 · Fullerton, CA
Flood risk 4/10 · Minor
- FEMA flood zone
- X (shaded)
- Chance of flooding over 30 yrs
- 0.21%
- Est. flood insurance / yr
- $507 – $1,088
Fire risk 1/10 · Minimal
- Est. fire insurance / yr
- $659 – $1,223
Heat risk 6/10 · Moderate
- Hot days now (above 92°F)
- 7 days/yr
- Hot days in 30 yrs
- 22 days/yr
Wind risk 1/10 · Minimal
- Chance of severe wind over 30 yrs
- —
Air-quality risk 5/10 · Moderate
- Unhealthy air days now
- 7 days/yr
- Unhealthy air days in 30 yrs
- 9 days/yr
Risk factors via First Street. Map © Google.
Why this score? — see what drove the B+ grade
The composite is a weighted blend of 9 inputs, each scored 0–100. Each bar is that input's sub-score; the figure is the points it added to the 100-point composite (weight × sub-score).
- Cash flow +30.0/30.0
- ARV discount +12.9/15.0
- DSCR +10.0/10.0
- 1% rule +9.4/10.0
- Schools +5.1/10.0
- Livability +3.4/5.0
- Rent growth +2.9/5.0
- Condition / age +2.5/5.0
- Appreciation +0.0/10.0
$279,900
🖨 Deal sheet 📄 Offer letter ✓ Due diligence
Listing remarks MLS
Welcome to 1201 W Drive #97, Fullerton! This charming and well-maintained mobile home offers comfortable living in a peaceful community. With 2 spacious bedrooms, 2 bathrooms, and approximately 1,758 square feet of living space, this home is perfect for those seeking affordability without sacrificing space or style. The open floor plan includes a bright living room that flows into the dining area and kitchen, which features ample cabinetry, modern appliances, and a cozy breakfast nook. The primary bedroom offers a private en-suite bathroom and generous closet space. Two additional bedrooms provide flexibility for guests, a home office, or extra storage. Step outside to your private patio area, perfect for outdoor.
Key facts
- 28.43 acre lot
- Community pool
- Built 1984
Property features AI
Finance
- Other: Lot size reported from assessor's data; Living area listed as estimated
- Financial info: Monthly land lease payment: $1,133 (seller-provided)
- HOA & community: Senior community; Located in Rancho Fullerton park; Monthly land lease
Exterior
- Parking: Carport
- Utilities: Public sewer; District/public water
- Home design: Manufactured/mobile home (24' x 52'); One story; Entry on the front
- Construction: Mobile home remains on site; Year built as reported by assessor
- Exterior features: Community pool; Park within the community
Interior
- Kitchen: Refrigerator; Range/stove hood; Gas range; Gas oven; Dishwasher
- Bathrooms: 2 full bathrooms
- Interior features: Single-level residence with front entry; Community spa
- Laundry & utility: Washer hookup; Gas dryer hookup; Dedicated laundry room
Neighborhood map
What this means for you Summary
Snapshot
- This is a 2-bed/2.0-bath manufactured listed at $280k.
Deal economics
- At list price, monthly cash flow is $1k ($15k/yr) — positive.
- The deal already cash-flows at list — no discount required.
- Meets the 1% rule at list price ($4k rent vs $280k).
- Recommended offer: $276k (1.5% below list) — sets the bar for market timing.
- Cap rate 11.7% vs local median 2.0% in Fullerton — top-decile yield for the area; either an underpriced asset or a hidden risk that comps aren't pricing in. Stress-test before assuming the spread holds.
Location & tenants
- Location reads 67/100 on livability (#328 in CA) — a middle-class / working-renter tenant base. Strengths: commute A+, employment A+; Watch: schools C-, health & safety D, crime D-.
- Fullerton Joint Union High (suburban): math 51% / reading 66% proficiency, ranked #82 of 517 in CA (top 16%) — acceptable for families but not a draw, mixed tenant base, ~2y average lease.
- Market conditions: Rents rising (+1.7%/yr); 63 active listings in the ZIP; 14 comparable units currently listed for rent nearby; rentals leasing fast (median 1d on market — plan ~1-2 weeks tenant-placement turnaround); high-income renter base; 6,974 units permitted in Orange County in 2024 (3,839 in 5+ unit buildings).
- This rent runs 42% of the median local income ($114k/yr) — at the standard rent-burdened threshold; future hikes will face affordability resistance.
Forward outlook
- Local home prices are declining (-3.0%/yr); year-one equity from $2k of loan paydown is wiped out by about $8k of value loss. Plan a longer hold.
- Orange County population projected at +14% by 2050 — modest demand growth; plan on rents tracking national, not racing it.
- At projected returns (-3.0% appreciation + 1.7% rent growth), your $78k cash investment doubles in ~7 years — after that, you're playing with house money.
Negotiation context
- It's been on market 15 days — a 2% lower offer ($276k) is reasonable based on typical stale-listing flexibility.
- 6 sale attempts since 2y ago with the ask held roughly flat each time — persistent listings suggest the price (not the market) is what's stuck; bring a comps-based counter.
Risks & watch-outs
- Climate carrying-cost: extreme-heat days projected 7→22/yr by 2055 (HVAC capex compounding) — expect insurance premiums to compound above CPI over the hold.
Questions for the listing agent
- Is there a deadline driving the sale (1031 exchange, divorce, estate, relocation)? That informs how much negotiation room exists.
- Crime grade is D in this area — have there been break-ins, vandalism, or insurance claims at this property in the last 3 years? What carrier currently insures it and at what premium?
- What's the average days-on-market for RENTAL listings here right now (not sales)? A rising rental-DOM trend means longer vacancies and softer asking-rent achievability than the comps imply.
- What's the recent tenant-quality profile in this submarket — average credit score on applications, eviction rate, late-payment / NSF rate, and stable-employment percentage? A property-management company in the area should have these aggregated.
- How much new for-sale + rental construction is in the pipeline within 1–3 miles? Heavy new supply typically softens prices + rents 12–24 months out; constrained supply supports both.
Investment metrics
- 1% rule
- 1.44% ✓
- Cap rate
- 11.67%
- Cash-on-cash
- 19.21%
- DSCR
- 1.85
- GRM
- 5.8
CMA / ARV
- ARV (on-the-fly)
- $318,198
- Comps found
- 5
Show comp detail 5 sales within ~0.75 mi
| Address | Dist | Beds/Ba | Sqft | Sold | Price | $/sf | Match |
|---|---|---|---|---|---|---|---|
| 1201 W Valencia Dr #97 | 0.00mi | 2/2.0 | 1,758 (0%) | 15mo | $254,000 | $144 | 87 |
| 1201 W Valencia Dr #39 | 0.00mi | 3/2.0 (+1) | 1,500 (-15%) | 1mo | $375,000 | $250 | 70 |
| 1201 W Valencia Dr #236 | 0.00mi | 3/2.0 (+1) | 1,547 (-12%) | 9mo | $280,000 | $181 | 68 |
| 1201 W Valencia #42 | 0.00mi | 3/2.0 (+1) | 1,512 (-14%) | 6mo | $280,000 | $185 | 67 |
| 1201 W Valencia Dr #54 | 0.00mi | 3/2.0 (+1) | 1,510 (-14%) | 22mo | $258,900 | $171 | 53 |
Match score weights: distance 35% · size 25% · config 20% · recency 20%. Top-matched comps best support the ARV.
Projected returns pro-forma
-3.0% appreciation · 1.72% rent growth · sell at horizon
- IRR
- 9.7%
- Equity multiple
- 1.38×
- Total profit
- $29,473
- Equity at exit
- $41,734
- IRR
- 17.7%
- Equity multiple
- 2.38×
- Total profit
- $108,270
- Equity at exit
- $24,201
Cash invested: $78,372 (down + closing). Projections, not guarantees.
Landlord ↔ Tenant lean methodology
- Overall (STATE)
- 18 Strongly Tenant-Friendly
- State California
- 18 Strongly Tenant-Friendly · D+13
- County
- — inherits STATE
- City
- — inherits STATE
ZIP-level market 92833
- Rents YoY
- 1.7%
- Active inventory
- 63
- Price-to-rent
- 5.8×
Monthly cashflow live
- Estimated rent
- $4,037 high interval (Pro) →
- Mortgage (P&I)
- −$1,468
- Tax est. 1.5%
- −$350 /mo · $4,198/yr
- Insurance
- −$117
- HOA
- −$0
- Vacancy / Maint / Mgmt
- −$848
- Net cashflow
- $1,255
Break-even live
UW: 25.0% down · 7.5% · 30yr · 1.5% tax · 5.0% vac · 8.0% maint · 8.0% mgmt
Financing live
Cash to close
- Down payment
- $69,975
- Closing costs
- $8,397
- Reserves months
- —
- Total cash needed
- —
Loan-product check · same deal, 3 products live
Conventional
25% down · 7.5% · 30yr
- Down + closing
- —
- Monthly P&I
- —
- Monthly cashflow
- —
- DSCR
- —
- Eligible?
- —
Personal DTI + credit; lowest rate.
DSCR
20% down · 8.5% · 30yr
- Down + closing
- —
- Monthly P&I
- —
- Monthly cashflow
- —
- DSCR
- —
- Eligible?
- —
No personal income docs; deal must DSCR.
Hard money
10% down · 12.0% · 12mo
- Down + closing
- —
- Monthly P&I
- —
- Monthly cashflow
- —
- DSCR
- —
- Eligible?
- —
Short-term bridge; refi at stabilization.
Rent comps 14 comps
| Address | Beds | Baths | Sqft | Rent | $/sqft | DOM | Units | Dist |
|---|---|---|---|---|---|---|---|---|
| 1442 W Valencia Dr Fullerton, CA | 3.0 | 2.0 | 1761 | $3,750 | $2.13 | 3d | 1 | 0.34mi |
| 600 W Commonwealth Ave Fullerton, CA | 3.0 | 1.0–2.0 | 1002 | $3,850 | $3.84 | 1d | 18 | 0.60mi |
| 1124 W Woodcrest Ave Fullerton, CA | 3.0 | 2.0 | 1476 | $4,500 | $3.05 | 1d | 1 | 0.68mi |
| 714 Oceanview Dr Fullerton, CA | 3.0 | 2.0 | 1870 | $4,995 | $2.67 | 17d | 1 | 0.76mi |
| 1612 W Hill Ave Fullerton, CA | 3.0 | 2.0 | 1453 | $3,500 | $2.41 | 24d | 1 | 0.78mi |
| 1406 W Roberta Ave Fullerton, CA | 3.0 | 2.5 | 1750 | $8,250 | $4.71 | 22d | 1 | 0.87mi |
| 331 W Whiting Ave Fullerton, CA | 3.0 | 1.0 | 1490 | $2,350 | $1.58 | 10d | 1 | 0.99mi |
| 2099 Owens Dr Fullerton, CA | 3.0 | 2.5 | 1782 | $4,400 | $2.47 | 1d | 1 | 1.27mi |
| 1138 N Euclid St Anaheim, CA | 3.0 | 2.5 | 1492 | $3,750 | $2.51 | 24d | 1 | 1.37mi |
| 1001 Starbuck St Fullerton, CA | 1.0–3.0 | 1.0–2.0 | 1008 | $3,684 | $3.65 | 1d | 16 | 1.42mi |
| 2271 Chaffee St Fullerton, CA | 3.0 | 3.0 | 1695 | $4,200 | $2.48 | 1d | 1 | 1.46mi |
| 1024 W Romneya Dr Anaheim, CA | 2.0–3.0 | 2.0 | 1241 | $2,995 | $2.41 | 1d | 10 | 1.46mi |
| 1372 McFadden Dr Fullerton, CA | 3.0 | 2.5 | 1582 | $4,200 | $2.65 | 1d | 1 | 1.48mi |
| 229 E Commonwealth Ave Fullerton, CA | 3.0 | 1.0–3.0 | 1126 | $3,676 | $3.26 | 1d | 8 | 1.49mi |
Listing history 11 events
-
2026-06-18days on market $279,900 Active 15 DOM
-
2026-06-17days on market $279,900 Active 14 DOM
-
2026-06-16days on market $279,900 Active 13 DOM
-
2026-06-15days on market $279,900 Active 12 DOM
-
2026-06-13days on market $279,900 Active 10 DOM
-
2026-06-13pricedays on market $279,900 Active 9 DOM
-
2026-06-09days on market $285,000 Active 6 DOM
-
2026-06-08days on market $285,000 Active 5 DOM
-
2026-06-07days on market $285,000 Active 4 DOM
-
2026-06-04remarks 478-char remark
-
2026-06-04$285,000 Active 1 DOM
ⓘ Source: listings_history table (triggers on properties + properties_extension) + one-shot
backfill from property_details.listing_events for pre-trigger history.
Climate risk First Street
- Flood 4/10 Moderate FEMA zone X (shaded) · 21% chance over 30 yrs
- Wildfire 1/10 Low
- Heat 6/10 Major 7 d/yr ≥92°F today · 22 d/yr by 30 yrs out
- Wind 1/10 Low
- Air quality 5/10 Major 7 unhealthy d/yr today · 9 by 30 yrs out
Nearby sold comps map
Loading sold comps map…
Walkable amenities ~0.75 mi
Loading nearby amenities…
Taxation est. · year 1
- Rental income
- $48,438
- − Mortgage interest
- −$15,679
- − Property taxes
- −$4,198
- − Insurance
- −$1,400
- − Repairs & maintenance
- −$3,875
- − Management
- −$3,875
- − Depreciation
- −$8,143
- Taxable income
- $11,269
- Est. tax owed @ 24.0%
- −$2,705
- After-tax cash flow
- $12,350/yr
For passive investors: Depreciation is non-cash, so a rental often shows a tax loss while cash-flowing — sheltering income. Rental losses are passive: they offset passive income freely, and up to $25,000/yr can offset ordinary (W-2) income if you actively participate and your MAGI is under $100k (phasing out to $0 by $150k); unused losses carry forward. On sale, claimed depreciation is recaptured at up to 25%, and gains may owe capital-gains tax (a 1031 exchange can defer both). Figures are a year-1 estimate at your 24.0% rate — not tax advice; consult a CPA.
Schools (NCES district)
- District
- Fullerton Joint Union High
- NCES district ID
- 0614760
- Math proficiency
- 51% ▲ 7.00%
- Reading proficiency
- 66% ▲ 1.00%
- Median HH income
- $66,666
- Composite
- 51.37/100
- National rank
- #1735
- State rank
- #82 of 517 in CA
Livability — Fullerton
- Score
- 67/100
- State rank
- #328
- US rank
- #11149
Category grades
Schools grade is shown separately in the Schools card above.
Census & demographics
- Census place
- Fullerton, CA
- County
- Orange County · 3,096,323 people
- City population
- 140,763
- Metro
- Los Angeles-Long Beach-Anaheim, CA
- Population (ZIP)
- 51,842
- Household income
- $114,176
- Rent vs Own
- Severe rent burden
- 2530.0
Population outlook (Orange County) Hauer SSP2
- Today (2025)
- 3,477,456 people
- By 2030
- 3,613,117 · +3.9%
- By 2040
- 3,835,945 · +10.3%
- By 2050
- 3,968,736 · +14.1%
- By 2075
- 4,097,053 · +17.8%
- By 2100
- 3,903,633 · +12.3%
Race, ethnicity, and origin ACS 2023
- Neighborhood character
- Diverse neighborhood (Simpson 0.68)
- Race & ethnicity
- Hispanic / Latino 40% Asian 35% White 20% Two or more races 15% Black 2%
- Hispanic origin (detail)
- Mexican 34%
- Common ancestry
- Italian 1% Slovak 1% Iranian 1%
- Foreign-born
- 36% · South Korea, Canada, China
- Languages at home
- 46% English-only · Spanish 24% Korean 20% Other Indo-European 2%
Political lean MEDSL · Orange
- 2024 margin
- Toss-up / Even · D 49.7% · R 47.1% · Other 3.2%
- 2008→2024 swing
- +5.2pp toward D · 2008: -2.6pp · 2024: 2.6pp
- All cycles
- 2024: D+2.6 2020: D+9.0 2016: D+7.7 2012: R+8.3 2008: R+2.6
Not yet ingested
- Civics
- —
Market trends
- HPI YoY
- ▼ -917.00%
- Current HPI
- 351.652
- Rent YoY
- ▲ 1.72%
- Metro
- Los Angeles-Long Beach-Anaheim, CA
- State GDP YoY
- ▲ 3.21%
- F500 in state
- 116
Industry mix (Fortune 500 HQ in CA)
| Industry | F500 HQs | Revenue |
|---|---|---|
| Technology | 27 | $1,492B |
|
||
| Financial Services | 3 | $174B |
|
||
| Retail | 3 | $44B |
|
||
| Insurance | 3 | $26B |
|
||
| Media / Entertainment | 2 | $115B |
|
||
| Pharmaceuticals / Biotech | 2 | $62B |
|
||
Price history
+14.0% since first listed14 events — show timeline
- 2026-06-03 Listed $285,000 CRMLS
- 2025-03-07 Sold (MLS) $254,000 CRMLS
- 2025-02-14 Pending — CRMLS
- 2025-01-31 Contingent — CRMLS
- 2024-12-08 Relisted — CRMLS
- 2024-10-01 Listing Removed — CRMLS
- 2024-09-30 Listed $259,000 CRMLS
- 2024-09-30 Listed $259,000 CRMLS
- 2024-07-23 Sold (MLS) $219,000 CRMLS
- 2024-06-27 Contingent — CRMLS
- 2024-06-15 Listed $219,000 CRMLS
- 2024-06-12 Listing Removed — CRMLS
- 2024-05-23 Price Changed $219,000 CRMLS
- 2024-03-25 Listed $250,000 CRMLS
Property tax history
-3.7%/yrLatest (2025): $89 · +2.1% YoY. Source: county tax records.
Cash-flow waterfall
monthlySold comps — $/sqft
last 12 mo · ≤1 miLoading sold comps…