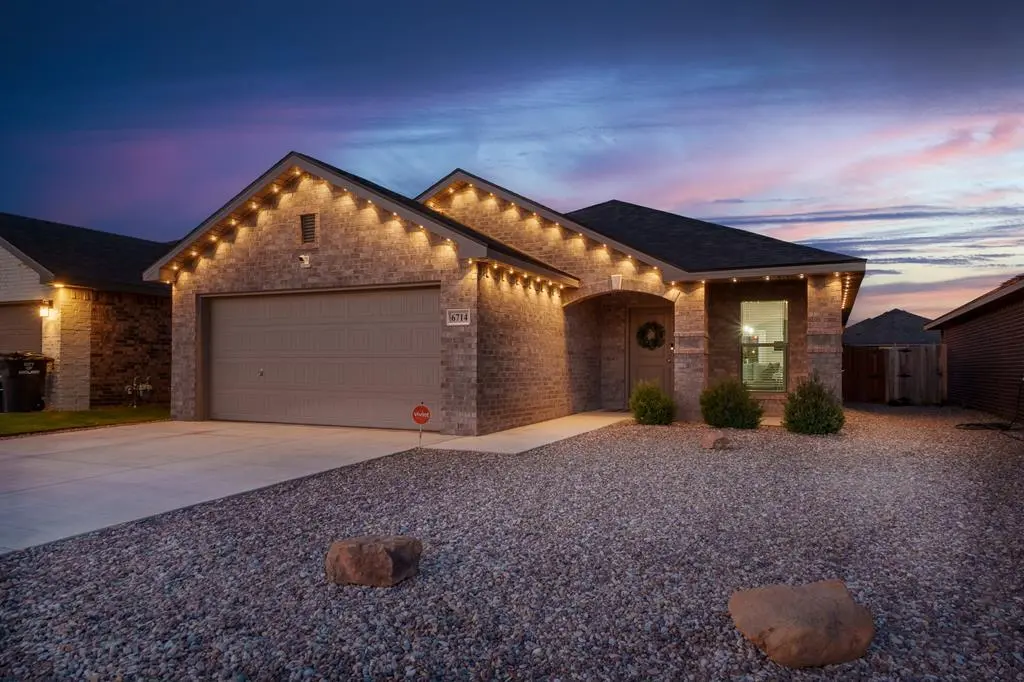
6714 Lonesome Dove Ln · Midland, TX
Flood risk 1/10 · Minimal
- FEMA flood zone
- —
- Chance of flooding over 30 yrs
- 0.0%
- Est. flood insurance / yr
- —
Fire risk 4/10 · Minor
- Est. fire insurance / yr
- $1,222 – $2,270
Heat risk 6/10 · Moderate
- Hot days now (above 102°F)
- 7 days/yr
- Hot days in 30 yrs
- 22 days/yr
Wind risk 3/10 · Minor
- Chance of severe wind over 30 yrs
- 6.0%
Air-quality risk 1/10 · Minimal
- Unhealthy air days now
- 0 days/yr
- Unhealthy air days in 30 yrs
- 0 days/yr
Risk factors via First Street. Map © Google.
Why this score? — see what drove the D grade
The composite is a weighted blend of 9 inputs, each scored 0–100. Each bar is that input's sub-score; the figure is the points it added to the 100-point composite (weight × sub-score).
- Cash flow +12.0/30.0
- ARV discount +7.8/15.0
- Livability +4.0/5.0
- Condition / age +3.8/5.0
- DSCR +3.5/10.0
- 1% rule +3.4/10.0
- Schools +3.2/10.0
- Rent growth +3.1/5.0
- Appreciation +0.0/10.0
$304,000
🖨 Deal sheet (PDF) 📄 Offer letter ✓ Due diligence
Listing remarks
GORGEOUS, FULLY LOADED SMART HOME! 3BR/2BA FEATURING DESIGNER ACCENT WALLS, MODERN FIXTURES & UPGRADED HARDWARE. CONVEYS WITH PAID-OFF VIVINT SECURITY, ECOBEE W/ AIR QUALITY ALERTS, & MYQ GARAGE. SMART GOVEE & SOLAR LIGHTING PACKS THE INTERIOR/EXTERIOR. KITCHEN INCLUDES PREMIUM FRIDGE & DISHWASHER UNTIL 2028 UNDER WARRANTY! RETREAT TO THE BACK PATIO WITH A STAINED PERGOLA & FRESH LANDSCAPING. AN INTUITIVE FLOOR PLAN FLOWS SEAMLESSLY FROM LIVING TO KITCHEN. MOVE-IN READY FOR THE TECH-SAVVY BUYER—UNMATCHED VALUE YOU WON'T FIND ANYWHERE ELSE IN LONE STAR TRAILS!
Key facts
- Stained pergola
- Smart govee
- Solar lighting
Tags
Property features AI
Finance
- Other: Lot size approximately 0.118 acre
- HOA & community: Homeowners association with an annual fee of $275 (about $22.92/month)
Exterior
- Parking: 2-car garage with garage door opener
- Utilities: Public water; Public sewer
- Home design: Single family residence; Residential property; Single-story
- Construction: Brick veneer construction; Composition roof; Slab foundation; Built as residential single family
- Exterior features: Covered patio; Patio; Wood fencing
Interior
- Kitchen: Oven; Electric range; Range; Microwave; Dishwasher; Disposal; Refrigerator
- Flooring: Carpet; Tile
- Bathrooms: 2 full bathrooms
- Heating & cooling: Central heating (natural gas); Central air; Ceiling fan(s)
- Interior features: Pantry; Smoke detector(s); Security system
- Laundry & utility: Dryer; Gas water heater
Neighborhood map
What this means for you Summary
Snapshot
- This is a 3-bed/2.0-bath single-family listed at $304k. Condition is rated good.
Deal economics
- At list price, monthly cash flow is $-74 ($-888/yr) — negative.
- To cash-flow at today's rent, offer at most $291k (4.3% below list).
- To meet the 1% rule (rent ≥ 1% of price), the offer needs to be $255k (16.3% below list).
- Recommended offer: $255k (16.3% below list) — sets the bar for 1% rule.
- Cap rate 6.0% vs local median 4.7% in Midland — meaningfully above typical; check what's discounted (condition, days-on-market, listing class) to confirm the premium yield is real.
Location & tenants
- Location reads 79/100 on livability (#57 in TX, #2,192 nationally) — a middle-class / working-renter tenant base. Strengths: employment A+, housing A+, health & safety A+; Watch: crime C-, commute D+, amenities D.
- Midland ISD (urban): math 34% / reading 36% proficiency, ranked #477 of 826 in TX (top 58%) — families likely to look elsewhere, expect single-tenant / working-renter base with shorter leases.
- Zoned schools: Santa Rita El (math 43% / reading 39%, grade F, #1,462 of 4,322 statewide, top 34%, 596 students, 45% FRL); Goddard J H (math 23% / reading 32%, grade F, #1,156 of 1,662 statewide, top 71%, 1,024 students, 58% FRL, charter); Midland H S (math 37% / reading 7%, grade F, #1,366 of 1,632 statewide, top 84%, 2,492 students, 44% FRL) — zoned schools at 49% FRL track the district average.
- Market conditions: Rents rising (+2.6%/yr); 452 active listings in the ZIP; 32 comparable units currently listed for rent nearby; rentals at typical pace (median 23d on market — plan ~3-4 weeks tenant-placement turnaround); solid renter incomes; 1,504 units permitted in Midland County in 2024 (0 in 5+ unit buildings).
Forward outlook
- Local home prices are declining (-3.0%/yr); year-one equity from $2k of loan paydown is wiped out by about $9k of value loss. Plan a longer hold.
- Midland County population projected at +83% by 2050 — long-run rental-demand tailwind backs the buy-and-hold thesis.
Negotiation context
- Only 13 days on market — expect competitive offers; lowballing is unlikely to land.
Risks & watch-outs
- Climate carrying-cost: extreme-heat days projected 7→22/yr by 2055 (HVAC capex compounding) — expect insurance premiums to compound above CPI over the hold.
Questions for the listing agent
- What do current leases actually rent for vs. the listed asking? Can we see a recent rent roll and the last 12 months of T-12 income?
- What does the HOA fee cover, when was the last increase, and are there any pending special assessments or reserve-fund shortfalls?
- Is there a deadline driving the sale (1031 exchange, divorce, estate, relocation)? That informs how much negotiation room exists.
- The area grade is low — what's the realistic commute time and amenity access for the typical tenant pool here? Any planned neighborhood developments (good or bad) we should know about?
- What's the average days-on-market for RENTAL listings here right now (not sales)? A rising rental-DOM trend means longer vacancies and softer asking-rent achievability than the comps imply.
- What's the recent tenant-quality profile in this submarket — average credit score on applications, eviction rate, late-payment / NSF rate, and stable-employment percentage? A property-management company in the area should have these aggregated.
- How much new for-sale + rental construction is in the pipeline within 1–3 miles? Heavy new supply typically softens prices + rents 12–24 months out; constrained supply supports both.
Investment metrics
- 1% rule
- 0.84% ✗
- Cap rate
- 6.00%
- Cash-on-cash
- -1.04%
- DSCR
- 0.95
- GRM
- 10.0
CMA / ARV
- ARV (median comp)
- $306,231
- List price
- $304,000
- Delta
- -0.73%
- Verdict
- FAIR
- Comps
- 4 within 2.0 mi
Projected returns pro-forma
-3.0% appreciation · 2.56% rent growth · sell at horizon
- IRR
- -18.5%
- Equity multiple
- 0.35×
- Total profit
- $-55,068
- Equity at exit
- $45,327
- IRR
- -11.7%
- Equity multiple
- 0.31×
- Total profit
- $-58,468
- Equity at exit
- $26,284
Cash invested: $85,120 (down + closing). Projections, not guarantees.
Landlord ↔ Tenant lean methodology
- Overall (STATE)
- 87 Strongly Landlord-Friendly
- State Texas
- 87 Strongly Landlord-Friendly · R+5
- County
- — inherits STATE
- City
- — inherits STATE
ZIP-level market 79705
- Rents YoY
- 2.6%
- Active inventory
- 452
- Price-to-rent
- 10.0×
Monthly cashflow live
- Estimated rent
- $2,546 high interval (Pro) →
- Mortgage (P&I)
- −$1,594
- Tax from tax record
- −$341 /mo · $4,097/yr
- Insurance
- −$127
- HOA
- −$23
- Vacancy / Maint / Mgmt
- −$535
- Net cashflow
- $-74
Break-even live
Sensitivity live
| Price | -10% $98 | -5% $12 | +0% $-74 | +5% $-160 | +10% $-246 |
|---|---|---|---|---|---|
| Rent | -10% $-275 | -5% $-175 | +0% $-74 | +5% $27 | +10% $127 |
| Rate | -1.0pp $79 | -0.5pp $3 | base $-74 | +0.5pp $-153 | +1.0pp $-233 |
UW: 25.0% down · 7.5% · 30yr · 1.5% tax · 5.0% vac · 8.0% maint · 8.0% mgmt
Financing live
Cash to close
- Down payment
- $76,000
- Closing costs
- $9,120
- Reserves months
- —
- Total cash needed
- —
Loan-product check · same deal, 3 products live
Conventional
25% down · 7.5% · 30yr
- Down + closing
- —
- Monthly P&I
- —
- Monthly cashflow
- —
- DSCR
- —
- Eligible?
- —
Personal DTI + credit; lowest rate.
DSCR
20% down · 8.5% · 30yr
- Down + closing
- —
- Monthly P&I
- —
- Monthly cashflow
- —
- DSCR
- —
- Eligible?
- —
No personal income docs; deal must DSCR.
Hard money
10% down · 12.0% · 12mo
- Down + closing
- —
- Monthly P&I
- —
- Monthly cashflow
- —
- DSCR
- —
- Eligible?
- —
Short-term bridge; refi at stabilization.
Rent comps 32 comps
| Address | Beds | Baths | Sqft | Rent | $/sqft | DOM | Units | Dist |
|---|---|---|---|---|---|---|---|---|
| 2703 Ranch Ave Midland, TX | 3.0 | 2.0 | 1658 | $2,350 | $1.42 | 23d | 1 | 0.24mi |
| 6735 Draw Ct Midland, TX | 4.0 | 2.0 | 2050 | $2,500 | $1.22 | 45d | 1 | 0.25mi |
| 2702 Southwest St Midland, TX | 3.0 | 2.0 | 1844 | $2,500 | $1.36 | 45d | 1 | 0.26mi |
| 6220 Kingsville St Midland, TX | 3.0 | 2.0 | 1312 | $2,400 | $1.83 | 15d | 1 | 0.50mi |
| 2409 Husk St Midland, TX | 3.0 | 2.0 | 1927 | $2,800 | $1.45 | 15d | 1 | 0.52mi |
| 2409 Husk St Unit 1 Midland, TX | 3.0 | 2.0 | 1800 | $3,000 | $1.67 | 15d | 1 | 0.52mi |
| 6109 Buckthorn Dr Midland, TX | 4.0 | 2.0 | 1655 | $2,900 | $1.75 | 23d | 1 | 0.66mi |
| 2908 Yellowhouse Ave Midland, TX | 3.0 | 2.0 | 1515 | $2,650 | $1.75 | 23d | 1 | 0.71mi |
| 6914 Outlaw Ct Midland, TX | 4.0 | 2.0 | 2123 | $3,250 | $1.53 | 15d | 1 | 0.73mi |
| 2060 Acacia Ln Midland, TX | 3.0 | 2.0 | 2050 | $3,100 | $1.51 | 15d | 1 | 0.75mi |
| 5917 Praline St Midland, TX | 3.0 | 2.0 | 1251 | $2,500 | $2.00 | 23d | 1 | 0.79mi |
| 6801 Baron Dr Midland, TX | 4.0 | 2.0 | 2058 | $3,150 | $1.53 | 15d | 1 | 0.82mi |
| 2912 Pitchfork Rd Midland, TX | 3.0 | 2.0 | 1119 | $2,100 | $1.88 | 23d | 1 | 0.83mi |
| 2716 River Bend Rd Midland, TX | 3.0 | 2.0 | 1517 | $2,600 | $1.71 | 45d | 1 | 0.84mi |
| 2808 Lighthouse Rd Midland, TX | 3.0 | 2.0 | 1168 | $2,300 | $1.97 | 45d | 1 | 0.85mi |
| 2808 Longfellow Rd Midland, TX | 3.0 | 2.0 | 1422 | $2,400 | $1.69 | 23d | 1 | 0.86mi |
| 5920 Woodpecker Way Midland, TX | 3.0 | 2.0 | 1669 | $3,800 | $2.28 | 45d | 1 | 0.87mi |
| 2944 Hidalgo Ave Midland, TX | 3.0 | 2.0 | 1689 | $3,800 | $2.25 | 45d | 1 | 0.87mi |
| 6812 Brush Dr Midland, TX | 3.0 | 2.0 | 1450 | $2,500 | $1.72 | 15d | 1 | 1.01mi |
| 6333 Poppy Dr Midland, TX | 3.0 | 2.0 | 1350 | $2,500 | $1.85 | 23d | 1 | 1.01mi |
| 6809 Brush Dr Midland, TX | 3.0 | 2.0 | 1466 | $2,500 | $1.71 | 15d | 1 | 1.03mi |
| 5817 Settler Ave Midland, TX | 3.0 | 2.0 | 1421 | $2,600 | $1.83 | 45d | 1 | 1.06mi |
| 6011 Purtis Creek Dr Midland, TX | 4.0 | 2.0 | 1722 | $2,900 | $1.68 | 45d | 1 | 1.07mi |
| 6105 Poppy Dr Midland, TX | 3.0 | 2.0 | 1421 | $2,700 | $1.90 | 45d | 1 | 1.14mi |
| 1708 Rattler Ln Midland, TX | 3.0 | 2.0 | 1694 | $2,550 | $1.51 | 45d | 1 | 1.18mi |
| 1704 Rattler Ln Midland, TX | 3.0 | 2.0 | 1498 | $2,500 | $1.67 | 23d | 1 | 1.20mi |
| 1621 Revolution Dr Midland, TX | 3.0 | 2.0 | 1504 | $2,500 | $1.66 | 45d | 1 | 1.21mi |
| 1508 Rattler Ln Midland, TX | 3.0 | 2.0 | 1578 | $2,250 | $1.43 | 15d | 1 | 1.34mi |
| 1501 Wrangler Ln Midland, TX | 3.0 | 2.0 | 1960 | $2,750 | $1.40 | 15d | 1 | 1.38mi |
| 6706 Yellow Rose Ct Midland, TX | 3.0 | 2.0 | 1819 | $2,800 | $1.54 | 45d | 1 | 1.45mi |
| 1315 Yellow Rose Ct Midland, TX | 3.0 | 2.0 | 1600 | $2,600 | $1.62 | 15d | 1 | 1.48mi |
| 1310 Wrangler Ln Midland, TX | 3.0 | 2.0 | 1387 | $2,400 | $1.73 | 23d | 1 | 1.48mi |
HOA detail
- Monthly dues
- $23 · $276/yr
- Likely covers
- landscapingsecurity
Listing history 22 events
-
2026-06-22days on market $304,000 Active 13 DOM
-
2026-06-19days on market $304,000 Active 11 DOM
-
2026-06-18days on market $304,000 Active 10 DOM
-
2026-06-17days on market $304,000 Active 9 DOM
-
2026-06-16days on market $304,000 Active 8 DOM
-
2026-06-15days on market $304,000 Active 7 DOM
-
2026-06-14days on market $304,000 Active 5 DOM
-
2026-06-13days on market $304,000 Active 4 DOM
-
2026-06-10days on market $304,000 Active 2 DOM
-
2026-06-09days on market $304,000 Active 1 DOM
-
2026-06-08pricedays on market $304,000 Active 36 DOM
-
2026-06-07days on market $309,900 Active 35 DOM
-
2026-06-03days on market $309,900 Active 31 DOM
-
2026-06-02days on market $309,900 Active 30 DOM
-
2026-06-01days on market $309,900 Active 29 DOM
-
2026-05-31days on market $309,900 Active 28 DOM
-
2026-05-30pricedays on market $309,900 Active 27 DOM
-
2026-05-17price $314,000 600-char remark
-
2026-05-11price $317,900 600-char remark
-
2026-05-03$323,000 Active 600-char remark
-
2025-01-21soldstatus
-
2024-11-29price $299,000
ⓘ Source: listings_history table (triggers on properties + properties_extension) + one-shot
backfill from property_details.listing_events for pre-trigger history.
Tax reassessment forecast TX · Resets to sale price
- Current annual tax
- $4,097 · $341/mo
- Projected year-2 tax
- $5,563 · $464/mo
- Expected delta
- +$1,466/yr (+$122/mo · 35.8%)
ⓘ Screening estimate from a state-policy table — verify with the county assessor before closing.
Climate risk First Street
- Flood 1/10 Low 0% chance over 30 yrs
- Wildfire 4/10 Moderate
- Heat 6/10 Major 7 d/yr ≥102°F today · 22 d/yr by 30 yrs out
- Wind 3/10 Moderate 6% chance of damaging wind over 30 yrs
- Air quality 1/10 Low 0 unhealthy d/yr today · 0 by 30 yrs out
Nearby sold comps map
Loading sold comps map…
Walkable amenities ~0.75 mi
Loading nearby amenities…
Taxation est. · year 1
- Rental income
- $30,551
- − Mortgage interest
- −$17,029
- − Property taxes
- −$4,097
- − Insurance
- −$1,520
- − Repairs & maintenance
- −$2,444
- − Management
- −$2,444
- − HOA
- −$276
- − Depreciation
- −$8,844
- Taxable loss
- −$6,102
- Est. tax savings @ 24.0%
- +$1,465
- After-tax cash flow
- $577/yr
For passive investors: Depreciation is non-cash, so a rental often shows a tax loss while cash-flowing — sheltering income. Rental losses are passive: they offset passive income freely, and up to $25,000/yr can offset ordinary (W-2) income if you actively participate and your MAGI is under $100k (phasing out to $0 by $150k); unused losses carry forward. On sale, claimed depreciation is recaptured at up to 25%, and gains may owe capital-gains tax (a 1031 exchange can defer both). Figures are a year-1 estimate at your 24.0% rate — not tax advice; consult a CPA.
Condition & rehab AI · 1 photo
This fully loaded smart home is move-in ready with modern fixtures and designer accents. Smart home upgrades and landscaping improvements can further enhance its value.
Value-add opportunities
- Both Smart home upgrades — Enhances both resale and rental appeal with modern technology.
- Both Landscaping improvements — Enhances curb appeal and can increase property value.
- Both Interior updates — Fresh paint and minor updates can enhance the home's appeal and value.
- Both Smart home security system — Improves safety and adds value for potential buyers and renters.
- Rental HVAC maintenance — Ensures the HVAC system is in good condition, which is important for rental properties.
Renovation cost estimate screening
Value-add ROI direction
- Both Smart home upgrades — Enhances both resale and rental appeal with modern technology. ↑
- Both Landscaping improvements — Enhances curb appeal and can increase property value. ↑
- Both Interior updates — Fresh paint and minor updates can enhance the home's appeal and value. ↑
- Both Smart home security system — Improves safety and adds value for potential buyers and renters. ↑
- Rental HVAC maintenance — Ensures the HVAC system is in good condition, which is important for rental properties. ↑
ⓘ Cost ranges are severity-bucket heuristics (US national rule-of-thumb). Get contractor quotes + a written scope before underwriting a rehab budget.
Schools (NCES district)
- District
- Midland ISD
- NCES district ID
- 4830570
- Math proficiency
- 34% ▼ -7.00%
- Reading proficiency
- 36% ▬ 0.00%
- Median HH income
- $63,457
- Composite
- 31.63/100
- National rank
- #5938
- State rank
- #477 of 826 in TX
Livability — Midland
- Score
- 79/100
- State rank
- #57
- US rank
- #2192
Category grades
Schools grade is shown separately in the Schools card above.
Census & demographics
- Census place
- Midland, TX
- County
- Midland County · 168,494 people
- City population
- 168,494
- Metro
- Midland, TX
- Population (ZIP)
- 46,653
- Household income
- $105,310
- Rent vs Own
- Severe rent burden
- 1557.0
Population outlook (Midland County) Hauer SSP2
- Today (2025)
- 220,895 people
- By 2030
- 253,667 · +14.8%
- By 2040
- 325,498 · +47.4%
- By 2050
- 404,168 · +83.0%
- By 2075
- 609,802 · +176.1%
- By 2100
- 760,172 · +244.1%
Race, ethnicity, and origin ACS 2023
- Neighborhood character
- Diverse neighborhood (Simpson 0.60)
- Race & ethnicity
- White 46% Hispanic / Latino 43% Two or more races 20% Black 8%
- Hispanic origin (detail)
- Mexican 35%
- Common ancestry
- Slovak 1% Lithuanian 1% Serbian 1%
- Foreign-born
- 10% · Canada, Jamaica
- Languages at home
- 72% English-only · Spanish 24% Arabic 1%
Political lean MEDSL · Midland
- 2024 margin
- Solid R (+60.5) · D 19.3% · R 79.8%
- 2008→2024 swing
- -3.3pp toward R · 2008: -57.3pp · 2024: -60.5pp
- All cycles
- 2024: R+60.5 2020: R+56.6 2016: R+55.2 2012: R+61.5 2008: R+57.3
Not yet ingested
- Civics
- —
Market trends
- HPI YoY
- ▼ -300.44%
- Current HPI
- 207.2904
- Rent YoY
- ▲ 2.56%
- Metro
- Midland, TX
- State GDP YoY
- ▲ 3.95%
- F500 in state
- 110
Industry mix (Fortune 500 HQ in TX)
| Industry | F500 HQs | Revenue |
|---|---|---|
| Energy | 16 | $1,198B |
|
||
| Technology | 5 | $198B |
|
||
| Engineering / Construction | 4 | $72B |
|
||
| Energy Services | 3 | $60B |
|
||
| Utilities | 3 | $41B |
|
||
| Healthcare | 2 | $330B |
|
||
Price history
+1.7% since first listed7 events — show timeline
- 2026-06-08 Listed $304,000 PBBOR
- 2026-06-07 Price Changed $304,000 PBBOR
- 2026-05-29 Price Changed $309,900 PBBOR
- 2026-05-17 Price Changed $314,000 PBBOR
- 2026-05-11 Price Changed $317,900 PBBOR
- 2025-01-21 Sold (Public Records) — Public Records
- 2024-11-29 Price Changed $299,000 PBBOR
Property tax history
+133.8%/yrLatest (2025): $4,097 · -4.3% YoY. Source: county tax records.
Cash-flow waterfall
monthlySold comps — $/sqft
last 12 mo · ≤1 miLoading sold comps…