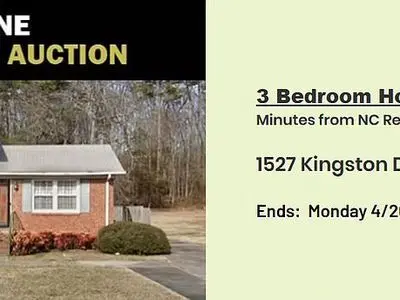
1527 Kingston Dr · Kannapolis, NC
Flood risk 1/10 · Minimal
- FEMA flood zone
- X (unshaded)
- Chance of flooding over 30 yrs
- 0.0%
- Est. flood insurance / yr
- $507 – $1,088
Fire risk 1/10 · Minimal
- Est. fire insurance / yr
- $906 – $1,684
Heat risk 5/10 · Moderate
- Hot days now (above 105°F)
- 7 days/yr
- Hot days in 30 yrs
- 16 days/yr
Wind risk 4/10 · Minor
- Chance of severe wind over 30 yrs
- 20.0%
Air-quality risk 2/10 · Minimal
- Unhealthy air days now
- 1 days/yr
- Unhealthy air days in 30 yrs
- 3 days/yr
Risk factors via First Street. Map © Google.
Why this score? — see what drove the B- grade
The composite is a weighted blend of 9 inputs, each scored 0–100. Each bar is that input's sub-score; the figure is the points it added to the 100-point composite (weight × sub-score).
- Cash flow +30.0/30.0
- 1% rule +10.0/10.0
- DSCR +10.0/10.0
- ARV discount +7.5/15.0
- Livability +3.2/5.0
- Rent growth +3.0/5.0
- Schools +2.6/10.0
- Condition / age +2.5/5.0
- Appreciation +0.0/10.0
$105,000
🖨 Deal sheet (PDF) 📄 Offer letter ✓ Due diligence
Listing remarks
COURT ORDERED SALE - 3 BEDROOM/2 BATH BRICK HOME LOCATED AT 1527 KINGSTON DRIVE IN KANNAPOLIS, NC 28083. LISTING ENDS ON APRIL 20, 2026 AT 1PM.
Key facts
- Built 1994
Neighborhood map
What this means for you Summary
Snapshot
- This is a 2-bed/1.5-bath single-family listed at $105k.
Deal economics
- At list price, monthly cash flow is $586 ($7k/yr) — positive.
- The deal already cash-flows at list — no discount required.
- Meets the 1% rule at list price ($2k rent vs $105k).
- Cap rate 13.0% vs local median 3.5% in Kannapolis — top-decile yield for the area; either an underpriced asset or a hidden risk that comps aren't pricing in. Stress-test before assuming the spread holds.
Location & tenants
- Location reads 64/100 on livability (#354 in NC) — a middle-class / working-renter tenant base. Strengths: cost of living A+, housing A+, crime B; Watch: employment D+, schools F, amenities F.
- Kannapolis City Schools (suburban): math 30% / reading 33% proficiency, ranked #141 of 178 in NC (top 79%) — families likely to look elsewhere, expect single-tenant / working-renter base with shorter leases; 63% free/reduced lunch — lower-income household profile, screen leases tightly.
- Market conditions: Rents rising (+2.1%/yr); 144 active listings in the ZIP; 19 comparable units currently listed for rent nearby; rentals at typical pace (median 25d on market — plan ~3-4 weeks tenant-placement turnaround); 2,485 units permitted in Cabarrus County in 2024 (677 in 5+ unit buildings).
- This rent runs 32% of the median local income ($66k/yr) — at the standard rent-burdened threshold; future hikes will face affordability resistance.
Forward outlook
- Local home prices are declining (-3.0%/yr); year-one equity from $726 of loan paydown is wiped out by about $3k of value loss. Plan a longer hold.
- Cabarrus County population projected at +44% by 2050 — long-run rental-demand tailwind backs the buy-and-hold thesis.
- At projected returns (-3.0% appreciation + 2.1% rent growth), your $29k cash investment doubles in ~6 years — after that, you're playing with house money.
Negotiation context
- Only 1 days on market — expect competitive offers; lowballing is unlikely to land.
Risks & watch-outs
- Watch-outs: property tax is 2.6% of price.
- Climate carrying-cost: extreme-heat days projected 7→16/yr by 2055 (HVAC capex compounding) — expect insurance premiums to compound above CPI over the hold.
Questions for the listing agent
- Property tax is high relative to price — has the assessment been appealed recently, and will the sale trigger a re-assessment?
- Is there a deadline driving the sale (1031 exchange, divorce, estate, relocation)? That informs how much negotiation room exists.
- Schools are F-rated, which usually means shorter tenancies and higher turnover. Who's the typical renter profile here, and what's been the actual vacancy rate?
- What's the average days-on-market for RENTAL listings here right now (not sales)? A rising rental-DOM trend means longer vacancies and softer asking-rent achievability than the comps imply.
- What's the recent tenant-quality profile in this submarket — average credit score on applications, eviction rate, late-payment / NSF rate, and stable-employment percentage? A property-management company in the area should have these aggregated.
- How much new for-sale + rental construction is in the pipeline within 1–3 miles? Heavy new supply typically softens prices + rents 12–24 months out; constrained supply supports both.
Investment metrics
- 1% rule
- 1.70% ✓
- Cap rate
- 12.99%
- Cash-on-cash
- 23.91%
- DSCR
- 2.06
- GRM
- 4.9
CMA / ARV
- ARV (on-the-fly)
- $333,057
- Comps found
- 12
Show comp detail 12 sales within ~0.75 mi
| Address | Dist | Beds/Ba | Sqft | Sold | Price | $/sf | Match |
|---|---|---|---|---|---|---|---|
| 2208 Brantley Rd | 0.42mi | 3/2.0 (+1) | 1,600 (-3%) | 3mo | $292,000 | $183 | 65 |
| 1004 Heather Dr | 0.67mi | 2/2.5 | 1,638 (-1%) | 8mo | $355,000 | $217 | 56 |
| 1406 Shepard St | 0.41mi | 3/2.0 (+1) | 1,513 (-9%) | 5mo | $290,000 | $192 | 55 |
| 2100 Brantley Rd | 0.27mi | 3/2.0 (+1) | 1,470 (-11%) | 8mo | $339,000 | $231 | 55 |
| 506 Queens Gate Dr | 0.49mi | 3/2.0 (+1) | 1,518 (-8%) | 4mo | $311,900 | $205 | 53 |
| 1713 Prism Pl | 0.71mi | 3/2.5 (+1) | 1,689 (+2%) | 3mo | $340,000 | $201 | 52 |
| 1422 Midlake Rd | 0.39mi | 3/2.0 (+1) | 1,426 (-14%) | 5mo | $315,000 | $221 | 47 |
| 252 Forest Pond Rd | 0.55mi | 3/2.5 (+1) | 1,488 (-10%) | 5mo | $275,000 | $185 | 44 |
| 1803 Central Dr | 0.64mi | 3/2.0 (+1) | 1,837 (+11%) | 2mo | $290,000 | $158 | 44 |
| 2124 Clear Brooke Dr | 0.64mi | 3/2.0 (+1) | 1,478 (-11%) | 2mo | $320,000 | $217 | 43 |
| 1306 Brantley Rd | 0.60mi | 3/1.0 (+1) | 1,484 (-10%) | 9mo | $274,500 | $185 | 40 |
| 1218 Martin Luther King Ave | 0.71mi | 3/2.0 (+1) | 1,496 (-10%) | 6mo | $280,000 | $187 | 39 |
Match score weights: distance 35% · size 25% · config 20% · recency 20%. Top-matched comps best support the ARV.
Projected returns pro-forma
-3.0% appreciation · 2.15% rent growth · sell at horizon
- IRR
- 16.1%
- Equity multiple
- 1.64×
- Total profit
- $18,869
- Equity at exit
- $15,656
- IRR
- 24.1%
- Equity multiple
- 3.00×
- Total profit
- $58,721
- Equity at exit
- $9,078
Cash invested: $29,400 (down + closing). Projections, not guarantees.
Landlord ↔ Tenant lean methodology
- Overall (STATE)
- 85 Strongly Landlord-Friendly
- State North Carolina
- 85 Strongly Landlord-Friendly · R+3
- County
- — inherits STATE
- City
- — inherits STATE
ZIP-level market 28083
- Rents YoY
- 2.1%
- Active inventory
- 144
- Price-to-rent
- 4.9×
Monthly cashflow live
- Estimated rent
- $1,786 high interval (Pro) →
- Mortgage (P&I)
- −$551
- Tax from tax record
- −$231 /mo · $2,768/yr
- Insurance
- −$44
- HOA
- −$0
- Vacancy / Maint / Mgmt
- −$375
- Net cashflow
- $586
Break-even live
Sensitivity live
| Price | -10% $645 | -5% $616 | +0% $586 | +5% $556 | +10% $526 |
|---|---|---|---|---|---|
| Rent | -10% $445 | -5% $515 | +0% $586 | +5% $656 | +10% $727 |
| Rate | -1.0pp $639 | -0.5pp $613 | base $586 | +0.5pp $559 | +1.0pp $531 |
UW: 25.0% down · 7.5% · 30yr · 1.5% tax · 5.0% vac · 8.0% maint · 8.0% mgmt
Financing live
Cash to close
- Down payment
- $26,250
- Closing costs
- $3,150
- Reserves months
- —
- Total cash needed
- —
Loan-product check · same deal, 3 products live
Conventional
25% down · 7.5% · 30yr
- Down + closing
- —
- Monthly P&I
- —
- Monthly cashflow
- —
- DSCR
- —
- Eligible?
- —
Personal DTI + credit; lowest rate.
DSCR
20% down · 8.5% · 30yr
- Down + closing
- —
- Monthly P&I
- —
- Monthly cashflow
- —
- DSCR
- —
- Eligible?
- —
No personal income docs; deal must DSCR.
Hard money
10% down · 12.0% · 12mo
- Down + closing
- —
- Monthly P&I
- —
- Monthly cashflow
- —
- DSCR
- —
- Eligible?
- —
Short-term bridge; refi at stabilization.
Rent comps 19 comps
| Address | Beds | Baths | Sqft | Rent | $/sqft | DOM | Units | Dist |
|---|---|---|---|---|---|---|---|---|
| 2031 Samantha Dr Kannapolis, NC | 3.0 | 2.0 | 1300 | $1,725 | $1.33 | 12d | 1 | 0.13mi |
| 1614 Barbara Ann Cir Kannapolis, NC | 3.0 | 2.0 | 1509 | $1,899 | $1.26 | 17d | 1 | 0.22mi |
| 1990 Quill Ct Kannapolis, NC | 3.0 | 2.5 | 1944 | $2,010 | $1.03 | 25d | 1 | 0.48mi |
| 1855 Lane St Kannapolis, NC | 3.0 | 2.0 | 1430 | $1,895 | $1.33 | 23d | 1 | 0.57mi |
| 1402 Martin Luther King Ave Unit B Kannapolis, NC | 3.0 | 2.5 | 1500 | $1,978 | $1.32 | 25d | 1 | 0.58mi |
| 1361 Ontario Dr Kannapolis, NC | 3.0 | 2.5 | 1240 | $1,850 | $1.49 | 6d | 1 | 0.61mi |
| 2192 Mallard Pointe Dr Kannapolis, NC | 3.0 | 2.5 | 2035 | $1,730 | $0.85 | 25d | 1 | 0.75mi |
| 1847 Duke Adam St Kannapolis, NC | 3.0 | 2.0 | 1428 | $1,789 | $1.25 | 6d | 1 | 0.99mi |
| 816 Fairview St Unit A Kannapolis, NC | 3.0 | 2.5 | 1288 | $1,750 | $1.36 | 25d | 1 | 0.99mi |
| 1903 Duke Adam St Kannapolis, NC | 3.0 | 2.0 | 1125 | $1,799 | $1.60 | 4d | 1 | 1.01mi |
| 1065 Ridgeway Dr Kannapolis, NC | 1.0–3.0 | 1.0–2.0 | 1003 | $1,190 | $1.19 | 25d | 1 | 1.02mi |
| 710 Irene Ave Unit A Kannapolis, NC | 3.0 | 2.0 | 1064 | $1,700 | $1.60 | 25d | 1 | 1.16mi |
| 2220 Moose Rd Kannapolis, NC | 3.0 | 2.5 | 1864 | $2,290 | $1.23 | 11d | 1 | 1.16mi |
| 706 Hillside St Kannapolis, NC | 3.0 | 2.0 | 1371 | $1,545 | $1.13 | 4d | 1 | 1.23mi |
| 838 Anchor Way NE Kannapolis, NC | 3.0 | 2.5 | 1548 | $2,040 | $1.32 | 25d | 1 | 1.28mi |
| 2616 Captains Watch Rd NE Kannapolis, NC | 3.0 | 2.0 | 1350 | $1,850 | $1.37 | 25d | 1 | 1.32mi |
| 530 Walter St Kannapolis, NC | 2.0 | 1.5 | 1050 | $1,350 | $1.29 | 25d | 1 | 1.38mi |
| 528 Walter St Kannapolis, NC | 2.0 | 1.5 | 1050 | $1,350 | $1.29 | 25d | 1 | 1.38mi |
| 531 Park St Kannapolis, NC | 2.0 | 1.5 | 1050 | $1,235 | $1.18 | 25d | 1 | 1.41mi |
Listing history 1 events
-
2026-05-26$105,000 Active
ⓘ Source: listings_history table (triggers on properties + properties_extension) + one-shot
backfill from property_details.listing_events for pre-trigger history.
Tax reassessment forecast NC · Resets to sale price
- Current annual tax
- $2,768 · $231/mo
- Projected year-2 tax
- $2,768 · $231/mo
- Expected delta
- $0/yr ($0/mo · 0.0%)
ⓘ Screening estimate from a state-policy table — verify with the county assessor before closing.
Climate risk First Street
- Flood 1/10 Low FEMA zone X (unshaded) · 0% chance over 30 yrs
- Wildfire 1/10 Low
- Heat 5/10 Major 7 d/yr ≥105°F today · 16 d/yr by 30 yrs out
- Wind 4/10 Moderate 20% chance of damaging wind over 30 yrs
- Air quality 2/10 Low 1 unhealthy d/yr today · 3 by 30 yrs out
Nearby sold comps map
Loading sold comps map…
Walkable amenities ~0.75 mi
Loading nearby amenities…
Taxation est. · year 1
- Rental income
- $21,431
- − Mortgage interest
- −$5,882
- − Property taxes
- −$2,768
- − Insurance
- −$525
- − Repairs & maintenance
- −$1,714
- − Management
- −$1,714
- − Depreciation
- −$3,055
- Taxable income
- $5,773
- Est. tax owed @ 24.0%
- −$1,385
- After-tax cash flow
- $5,644/yr
For passive investors: Depreciation is non-cash, so a rental often shows a tax loss while cash-flowing — sheltering income. Rental losses are passive: they offset passive income freely, and up to $25,000/yr can offset ordinary (W-2) income if you actively participate and your MAGI is under $100k (phasing out to $0 by $150k); unused losses carry forward. On sale, claimed depreciation is recaptured at up to 25%, and gains may owe capital-gains tax (a 1031 exchange can defer both). Figures are a year-1 estimate at your 24.0% rate — not tax advice; consult a CPA.
Schools (NCES district)
- District
- Kannapolis City Schools
- NCES district ID
- 3702430
- Math proficiency
- 30% ▲ 7.00%
- Reading proficiency
- 33% ▼ -2.00%
- Median HH income
- $38,534
- Composite
- 26.34/100
- National rank
- #7237
- State rank
- #141 of 178 in NC
Livability — Kannapolis
- Score
- 64/100
- State rank
- #354
- US rank
- #14030
Category grades
Schools grade is shown separately in the Schools card above.
Census & demographics
- Census place
- Kannapolis, NC
- County
- Cabarrus County · 218,793 people
- City population
- 57,170
- Metro
- Charlotte-Concord-Gastonia, NC-SC
- Population (ZIP)
- 28,095
- Household income
- $66,257
- Rent vs Own
- Severe rent burden
- 633.0
Population outlook (Cabarrus County) Hauer SSP2
- Today (2025)
- 239,273 people
- By 2030
- 260,754 · +9.0%
- By 2040
- 303,953 · +27.0%
- By 2050
- 344,827 · +44.1%
- By 2075
- 435,623 · +82.1%
- By 2100
- 490,119 · +104.8%
Race, ethnicity, and origin ACS 2023
- Neighborhood character
- Diverse neighborhood (Simpson 0.61)
- Race & ethnicity
- White 55% Black 25% Hispanic / Latino 16% Two or more races 5% Asian 1%
- Hispanic origin (detail)
- Mexican 11% Puerto Rican 3%
- Common ancestry
- Slovak 2% Serbian 1% Lithuanian 1%
- Foreign-born
- 8% · Canada
- Languages at home
- 85% English-only · Spanish 13% Tagalog/Filipino 1% Other Indo-European 1%
Political lean MEDSL · Cabarrus
- 2024 margin
- Lean R (+7.7) · D 45.5% · R 53.2% · Other 1.3%
- 2008→2024 swing
- +10.7pp toward D · 2008: -18.4pp · 2024: -7.7pp
- All cycles
- 2024: R+7.7 2020: R+9.4 2016: R+20.0 2012: R+20.2 2008: R+18.4
Not yet ingested
- Civics
- —
Market trends
- HPI YoY
- ▼ -318.30%
- Current HPI
- 307.0675
- Rent YoY
- ▲ 2.15%
- Metro
- Charlotte-Concord-Gastonia, NC-SC
- State GDP YoY
- ▲ 3.28%
- F500 in state
- 26
Industry mix (Fortune 500 HQ in NC)
| Industry | F500 HQs | Revenue |
|---|---|---|
| Financial Services | 2 | $213B |
|
||
| Retail | 2 | $95B |
|
||
| Industrial Conglomerate | 1 | $38B |
|
||
| Metals / Steel | 1 | $35B |
|
||
| Utilities | 1 | $30B |
|
||
| Industrial Machinery | 1 | $19B |
|
||
Price history
1 event — show timeline
- 2026-05-26 Listed $105,000 FSBO.com
Property tax history
+3.0%/yrLatest (2025): $2,768 · +0.0% YoY. Source: county tax records.
Cash-flow waterfall
monthlySold comps — $/sqft
last 12 mo · ≤1 miLoading sold comps…