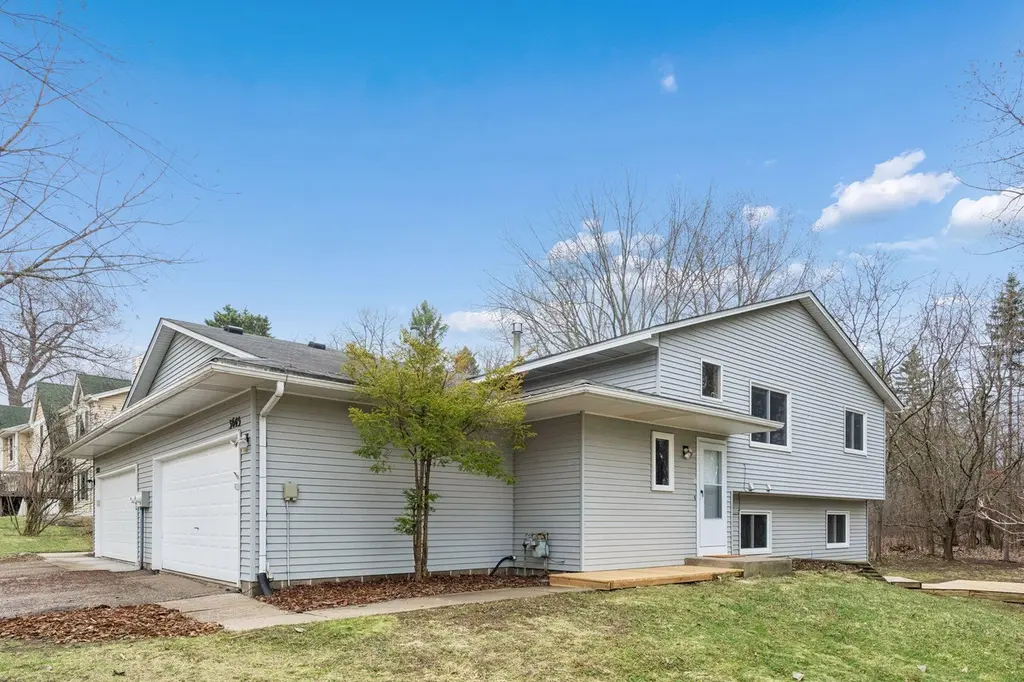
3645 Lyric Ave · Orono, MN
Flood risk 1/10 · Minimal
- FEMA flood zone
- X (unshaded)
- Chance of flooding over 30 yrs
- 0.0%
- Est. flood insurance / yr
- $473 – $860
Fire risk 1/10 · Minimal
- Est. fire insurance / yr
- $888 – $1,650
Heat risk 2/10 · Minimal
- Hot days now (above 98°F)
- 7 days/yr
- Hot days in 30 yrs
- 14 days/yr
Wind risk 2/10 · Minimal
- Chance of severe wind over 30 yrs
- —
Air-quality risk 2/10 · Minimal
- Unhealthy air days now
- 1 days/yr
- Unhealthy air days in 30 yrs
- 1 days/yr
Risk factors via First Street. Map © Google.
Why this score? — see what drove the C grade
The composite is a weighted blend of 9 inputs, each scored 0–100. Each bar is that input's sub-score; the figure is the points it added to the 100-point composite (weight × sub-score).
- Cash flow +17.3/30.0
- ARV discount +15.0/15.0
- Schools +5.9/10.0
- DSCR +5.4/10.0
- 1% rule +3.9/10.0
- Livability +3.4/5.0
- Rent growth +2.5/5.0
- Condition / age +2.5/5.0
- Appreciation +0.0/10.0
$325,000
🖨 Deal sheet 📄 Offer letter ✓ Due diligence
Listing remarks MLS
Fantastic twin home in the heart of Lake Minnetonka with NO HOA on over a 1/2 acre. This 3-bedroom, 2-bathroom home boasts many updates throughout, including all new LVP flooring, carpet, and a fresh coat of paint from top to bottom. The main-level vaulted kitchen features all-new stainless-steel appliances and a casual dining space. Generously-sized bedrooms with private views. The lower-level walkout family room opens up to an expansive flat backyard and oversized patio. New windows in 2022. A half-acre of privacy all to yourself! Quiet street and convenient location to the Dakota Trail, breweries & restaurants, lake access, and much, much more.
Key facts
- 0.56 acre lot
- 2 garage spots
- Built 1989
Neighborhood map
What this means for you Summary
Snapshot
- This is a 3-bed/2.0-bath single-family listed at $325k.
Deal economics
- At list price, monthly cash flow is $238 ($3k/yr) — positive.
- The deal already cash-flows at list — no discount required.
- To meet the 1% rule (rent ≥ 1% of price), the offer needs to be $291k (10.6% below list).
- Recommended offer: $291k (10.6% below list) — sets the bar for 1% rule.
- Cap rate 7.2% vs local median 0.4% in Orono — top-decile yield for the area; either an underpriced asset or a hidden risk that comps aren't pricing in. Stress-test before assuming the spread holds.
Location & tenants
- Location reads 67/100 on livability (#457 in MN) — a middle-class / working-renter tenant base. Strengths: crime A+, employment A+, housing A+; Watch: amenities F, cost of living F, health & safety F.
- Westonka Public School District (rural): math 65% / reading 68% proficiency, ranked #14 of 301 in MN (top 5%) — acceptable for families but not a draw, mixed tenant base, ~2y average lease; only 14% free/reduced lunch — higher-income household profile.
- Market conditions: 204 active listings in the ZIP; 1 comparable units currently listed for rent nearby; high-income renter base; 4,651 units permitted in Hennepin County in 2024 (2,443 in 5+ unit buildings).
Forward outlook
- Local home prices are declining (-3.0%/yr); year-one equity from $2k of loan paydown is wiped out by about $10k of value loss. Plan a longer hold.
- Hennepin County population projected at +30% by 2050 — long-run rental-demand tailwind backs the buy-and-hold thesis.
Negotiation context
- It's been on market 41 days — a 3% lower offer ($315k) is reasonable based on typical stale-listing flexibility.
- 5 sale attempts since 32y ago; this cycle's ask has dropped $50k (13%) from the opening price — seller is motivated, your offer sets the floor, not the list.
- Current owner paid $164k; list at $325k implies a 98% gain — meaningful room to come down on a strong offer.
Questions for the listing agent
- It's been on market 41 days. Have you received any prior offers? Is the seller open to a 11% concession, seller financing, or rate buy-down credit?
- Is there a deadline driving the sale (1031 exchange, divorce, estate, relocation)? That informs how much negotiation room exists.
- What's the average days-on-market for RENTAL listings here right now (not sales)? A rising rental-DOM trend means longer vacancies and softer asking-rent achievability than the comps imply.
- What's the recent tenant-quality profile in this submarket — average credit score on applications, eviction rate, late-payment / NSF rate, and stable-employment percentage? A property-management company in the area should have these aggregated.
- How much new for-sale + rental construction is in the pipeline within 1–3 miles? Heavy new supply typically softens prices + rents 12–24 months out; constrained supply supports both.
Investment metrics
- 1% rule
- 0.89% ✗
- Cap rate
- 7.17%
- Cash-on-cash
- 3.14%
- DSCR
- 1.14
- GRM
- 9.3
CMA / ARV
- ARV (median comp)
- $394,222
- List price
- $325,000
- Delta
- -17.56%
- Verdict
- UNDERPRICED
- Comps
- 3 within 2.0 mi
Projected returns pro-forma
-3.0% appreciation · 3.0% rent growth · sell at horizon
- IRR
- -11.4%
- Equity multiple
- 0.59×
- Total profit
- $-37,547
- Equity at exit
- $48,459
- IRR
- -2.2%
- Equity multiple
- 0.85×
- Total profit
- $-13,430
- Equity at exit
- $28,100
Cash invested: $91,000 (down + closing). Projections, not guarantees.
Landlord ↔ Tenant lean methodology
- Overall (STATE)
- 46 Balanced
- State Minnesota
- 46 Balanced · D+2
- County
- — inherits STATE
- City
- — inherits STATE
ZIP-level market 55391
- Active inventory
- 204
- Price-to-rent
- 9.3×
Monthly cashflow live
- Estimated rent
- $2,907 medium interval (Pro) →
- Mortgage (P&I)
- −$1,704
- Tax from tax record
- −$218 /mo · $2,615/yr
- Insurance
- −$135
- HOA
- −$0
- Vacancy / Maint / Mgmt
- −$610
- Net cashflow
- $238
Break-even live
UW: 25.0% down · 7.5% · 30yr · 1.5% tax · 5.0% vac · 8.0% maint · 8.0% mgmt
Financing live
Cash to close
- Down payment
- $81,250
- Closing costs
- $9,750
- Reserves months
- —
- Total cash needed
- —
Loan-product check · same deal, 3 products live
Conventional
25% down · 7.5% · 30yr
- Down + closing
- —
- Monthly P&I
- —
- Monthly cashflow
- —
- DSCR
- —
- Eligible?
- —
Personal DTI + credit; lowest rate.
DSCR
20% down · 8.5% · 30yr
- Down + closing
- —
- Monthly P&I
- —
- Monthly cashflow
- —
- DSCR
- —
- Eligible?
- —
No personal income docs; deal must DSCR.
Hard money
10% down · 12.0% · 12mo
- Down + closing
- —
- Monthly P&I
- —
- Monthly cashflow
- —
- DSCR
- —
- Eligible?
- —
Short-term bridge; refi at stabilization.
Rent comps 1 comps
| Address | Beds | Baths | Sqft | Rent | $/sqft | DOM | Units | Dist |
|---|---|---|---|---|---|---|---|---|
| 4201 Sunset Dr Spring Park, MN | 1.0–2.0 | 1.0–2.5 | 1369 | $4,052 | $2.96 | 1d | 1 | 0.50mi |
Listing history 15 events
-
2026-05-02price $350,000 660-char remark
Show marketing remark (660 chars)
Fantastic twin home in the heart of Lake Minnetonka with NO HOA on over a 1/2 acre. This 3-bedroom, 2-bathroom home boasts many updates throughout, including all new LVP flooring, carpet, and a fresh coat of paint from top to bottom. The main-level vaulted kitchen features all-new stainless-steel appliances and a casual dining space. Generously-sized bedrooms with private views. The lower-level walkout family room opens up to an expansive flat backyard and oversized patio. New windows in 2022. A half-acre of privacy all to yourself! Quiet street and convenient location to the Dakota Trail, breweries & restaurants, lake access, and much, much more.
-
2026-04-15$375,000 Active 660-char remark
Show marketing remark (660 chars)
Fantastic twin home in the heart of Lake Minnetonka with NO HOA on over a 1/2 acre. This 3-bedroom, 2-bathroom home boasts many updates throughout, including all new LVP flooring, carpet, and a fresh coat of paint from top to bottom. The main-level vaulted kitchen features all-new stainless-steel appliances and a casual dining space. Generously-sized bedrooms with private views. The lower-level walkout family room opens up to an expansive flat backyard and oversized patio. New windows in 2022. A half-acre of privacy all to yourself! Quiet street and convenient location to the Dakota Trail, breweries & restaurants, lake access, and much, much more.
-
2001-08-24soldstatus $164,000
-
1997-09-02soldstatus $110,000
-
1997-08-12soldstatus $110,000
-
1997-08-12soldstatus $110,000
-
1997-08-11historical
-
1997-06-25historical
-
1997-05-15$118,000
-
1997-05-15$118,000
-
1995-06-01soldstatus $97,000
-
1995-03-27historical
-
1995-03-03historical
-
1994-11-21$99,900
-
1994-11-04$99,900
ⓘ Source: listings_history table (triggers on properties + properties_extension) + one-shot
backfill from property_details.listing_events for pre-trigger history.
Tax reassessment forecast MN · Partial reset (capped growth)
- Current annual tax
- $2,615 · $218/mo
- Projected year-2 tax
- $3,128 · $261/mo
- Expected delta
- +$512/yr (+$43/mo · 19.6%)
ⓘ Screening estimate from a state-policy table — verify with the county assessor before closing.
Climate risk First Street
- Flood 1/10 Low FEMA zone X (unshaded) · 0% chance over 30 yrs
- Wildfire 1/10 Low
- Heat 2/10 Low 7 d/yr ≥98°F today · 14 d/yr by 30 yrs out
- Wind 2/10 Low
- Air quality 2/10 Low 1 unhealthy d/yr today · 1 by 30 yrs out
Nearby sold comps map
Loading sold comps map…
Walkable amenities ~0.75 mi
Loading nearby amenities…
Taxation est. · year 1
- Rental income
- $34,879
- − Mortgage interest
- −$18,205
- − Property taxes
- −$2,615
- − Insurance
- −$1,625
- − Repairs & maintenance
- −$2,790
- − Management
- −$2,790
- − Depreciation
- −$9,455
- Taxable loss
- −$2,602
- Est. tax savings @ 24.0%
- +$624
- After-tax cash flow
- $3,486/yr
For passive investors: Depreciation is non-cash, so a rental often shows a tax loss while cash-flowing — sheltering income. Rental losses are passive: they offset passive income freely, and up to $25,000/yr can offset ordinary (W-2) income if you actively participate and your MAGI is under $100k (phasing out to $0 by $150k); unused losses carry forward. On sale, claimed depreciation is recaptured at up to 25%, and gains may owe capital-gains tax (a 1031 exchange can defer both). Figures are a year-1 estimate at your 24.0% rate — not tax advice; consult a CPA.
Schools (NCES district)
- District
- Westonka Public School District
- NCES district ID
- 2722920
- Math proficiency
- 65% ▼ -14.00%
- Reading proficiency
- 68% ▼ -10.00%
- Median HH income
- $80,965
- Composite
- 59.42/100
- National rank
- #928
- State rank
- #14 of 301 in MN
Livability — Orono
- Score
- 67/100
- State rank
- #457
- US rank
- #10907
Category grades
Schools grade is shown separately in the Schools card above.
Census & demographics
- Census place
- Orono, MN
- County
- Hennepin County · 1,150,272 people
- City population
- 5,696
- Metro
- Minneapolis-St. Paul-Bloomington, MN-WI
- Population (ZIP)
- 15,502
- Household income
- $174,301
- Rent vs Own
- Severe rent burden
- 396.0
Population outlook (Hennepin County) Hauer SSP2
- Today (2025)
- 1,405,227 people
- By 2030
- 1,492,650 · +6.2%
- By 2040
- 1,660,157 · +18.1%
- By 2050
- 1,823,498 · +29.8%
- By 2075
- 2,221,283 · +58.1%
- By 2100
- 2,509,976 · +78.6%
Race, ethnicity, and origin ACS 2023
- Neighborhood character
- Predominantly White (89%)
- Race & ethnicity
- White 89% Asian 4% Two or more races 4% Hispanic / Latino 3%
- Common ancestry
- Portuguese 11% Lithuanian 4% Romanian 4%
- Foreign-born
- 8% · Canada, China, Vietnam
- Languages at home
- 92% English-only · Chinese 3% Spanish 2% Russian/Polish/Slavic 1%
Political lean MEDSL · Hennepin
- 2024 margin
- Solid D (+42.6) · D 70.2% · R 27.5% · Other 2.3%
- 2008→2024 swing
- +14.0pp toward D · 2008: 28.6pp · 2024: 42.6pp
- All cycles
- 2024: D+42.6 2020: D+43.2 2016: D+35.3 2012: D+27.1 2008: D+28.6
Not yet ingested
- Civics
- —
Market trends
- HPI YoY
- ▼ -535.45%
- Current HPI
- 268.3001
- Rent YoY
- —
- Metro
- Minneapolis-St. Paul-Bloomington, MN-WI
- State GDP YoY
- ▲ 2.41%
- F500 in state
- 34
Industry mix (Fortune 500 HQ in MN)
| Industry | F500 HQs | Revenue |
|---|---|---|
| Healthcare | 2 | $407B |
|
||
| Retail | 2 | $150B |
|
||
| Consumer Goods | 2 | $32B |
|
||
| Industrial Machinery | 2 | $6B |
|
||
| Agriculture | 1 | $40B |
|
||
| Healthcare / Medical Devices | 1 | $32B |
|
||
Price history
+250.4% since first listed15 events — show timeline
- 2026-05-02 Price Changed $350,000 NORTHSTARMLS as Distributed by MLS Grid
- 2026-04-15 Listed $375,000 NORTHSTARMLS as Distributed by MLS Grid
- 2001-08-24 Sold (Public Records) $164,000 Public Records
- 1997-09-02 Sold (Public Records) $110,000 Public Records
- 1997-08-12 Sold (MLS) $110,000 NORTHSTARMLS as Distributed by MLS Grid
- 1997-08-12 Sold (MLS) $110,000 NORTHSTARMLS as Distributed by MLS Grid
- 1997-08-11 Listing Removed — NORTHSTARMLS as Distributed by MLS Grid
- 1997-06-25 Listing Removed — NORTHSTARMLS as Distributed by MLS Grid
- 1997-05-15 Listed $118,000 NORTHSTARMLS as Distributed by MLS Grid
- 1997-05-15 Listed $118,000 NORTHSTARMLS as Distributed by MLS Grid
- 1995-06-01 Sold (MLS) $97,000 NORTHSTARMLS as Distributed by MLS Grid
- 1995-03-27 Listing Removed — NORTHSTARMLS as Distributed by MLS Grid
- 1995-03-03 Listing Removed — NORTHSTARMLS as Distributed by MLS Grid
- 1994-11-21 Listed $99,900 NORTHSTARMLS as Distributed by MLS Grid
- 1994-11-04 Listed $99,900 NORTHSTARMLS as Distributed by MLS Grid
Property tax history
+3.3%/yrLatest (2025): $2,615 · -1.8% YoY. Source: county tax records.
Cash-flow waterfall
monthlySold comps — $/sqft
last 12 mo · ≤1 miLoading sold comps…