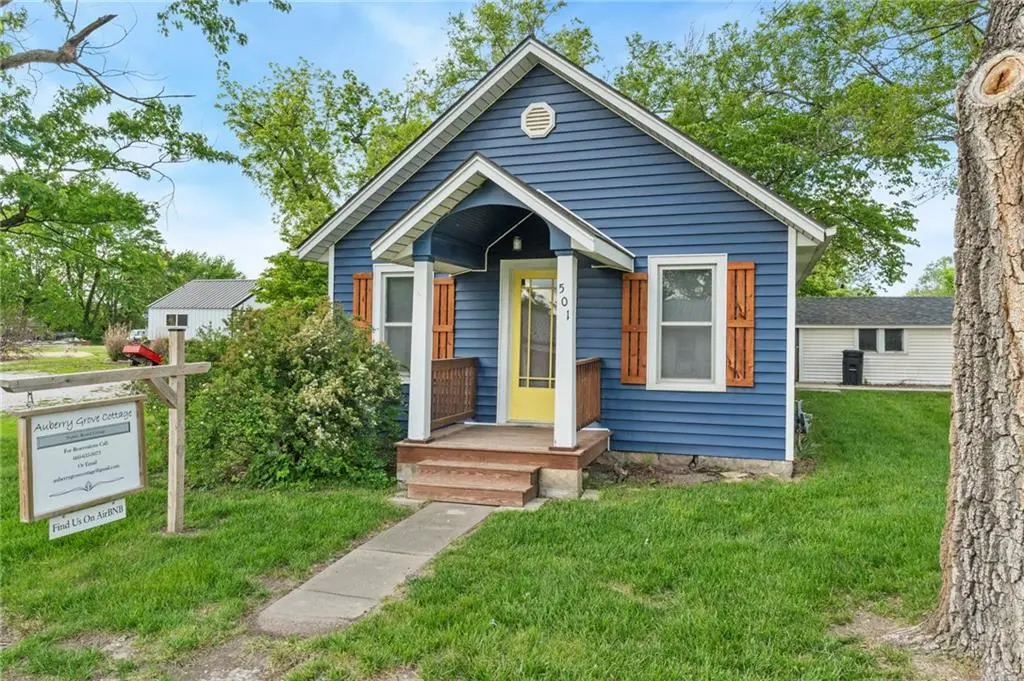
501 W Auberry Grove St · Jamesport, MO
Flood risk 1/10 · Minimal
- FEMA flood zone
- X (unshaded)
- Chance of flooding over 30 yrs
- 0.0%
- Est. flood insurance / yr
- $507 – $1,088
Fire risk 3/10 · Minor
- Est. fire insurance / yr
- $1,054 – $1,958
Heat risk 3/10 · Minor
- Hot days now (above 105°F)
- 7 days/yr
- Hot days in 30 yrs
- 15 days/yr
Wind risk 2/10 · Minimal
- Chance of severe wind over 30 yrs
- —
Air-quality risk 2/10 · Minimal
- Unhealthy air days now
- 0 days/yr
- Unhealthy air days in 30 yrs
- 1 days/yr
Risk factors via First Street. Map © Google.
Why this score? — see what drove the D grade
The composite is a weighted blend of 9 inputs, each scored 0–100. Each bar is that input's sub-score; the figure is the points it added to the 100-point composite (weight × sub-score).
- Cash flow +11.7/30.0
- ARV discount +7.5/15.0
- Appreciation +5.0/10.0
- Schools +4.4/10.0
- DSCR +3.4/10.0
- Livability +2.9/5.0
- Rent growth +2.5/5.0
- Condition / age +2.5/5.0
- 1% rule +2.2/10.0
$115,000
🖨 Deal sheet (PDF) 📄 Offer letter ✓ Due diligence
Listing remarks MLS
Charming home with 2 bedrooms and 1 bath, an updated kitchen, bath, pretty wood floors, newer windows and more. Enjoy coffee on the deck! Stop paying rent and invest your hard earned $. Reasonable utilities. Close to downtown and the school.
Key facts
- Shaded patio
- Mature trees
- Detached garage
Tags
Property features AI
Finance
- Other: Living area approximately 760 (per public records); Estimated age: 76–100 years
- HOA & community: No association fees
Exterior
- Parking: Detached 1-car garage
- Utilities: City/public water (verify); Public sewer
- Home design: Single-family residence; Ranch floor plan; Located inside city limits
- Construction: Frame construction with vinyl siding; Metal roof
- Exterior features: Patio; Fire pit; City lot on a corner; Paved road with public maintenance
Interior
- Kitchen: Electric range; Refrigerator
- Bedrooms: 2 bedrooms on the main level (both carpeted; primary bedroom has ceiling fan)
- Flooring: Carpet; Vinyl; Wood
- Bathrooms: 1 full bathroom (main level)
- Heating & cooling: Forced air heating (natural gas); Electric cooling
- Interior features: Gas fireplace; Workshop; Formal dining area
- Laundry & utility: Washer and dryer included; Laundry located on the main level off the kitchen
Neighborhood map
What this means for you Summary
Snapshot
- This is a 1-bed/3.0-bath other listed at $115k.
Deal economics
- At list price, monthly cash flow is $-33 ($-401/yr) — negative.
- To cash-flow at today's rent, offer at most $109k (5.1% below list).
- To meet the 1% rule (rent ≥ 1% of price), the offer needs to be $82k (28.4% below list).
- Recommended offer: $82k (28.4% below list) — sets the bar for 1% rule.
Location & tenants
- Location reads 58/100 on livability (#582 in MO) — a working-class tenant base; expect higher turnover. Strengths: cost of living A+, housing A+; Watch: crime F, amenities F, commute F.
- Tri-County R-VII (rural): math 45% / reading 55% proficiency, ranked #131 of 535 in MO (top 24%) — acceptable for families but not a draw, mixed tenant base, ~2y average lease.
- Zoned schools: Tri-County Elem. (math 75% / reading 75%, grade A, #10 of 1,115 statewide, top 1%, 94 students, 38% FRL); Tri-County High (math 27% / reading 47%, grade F, #291 of 521 statewide, top 60%, 95 students, 44% FRL).
- Market conditions: 7 active listings in the ZIP.
Forward outlook
- In year one you build about $4k of equity ($795 loan paydown + $3k appreciation (3.0% local appreciation)).
- Daviess County population projected at -17% by 2050 — secular population decline; favor cash flow + early exit over multi-decade hold.
- At projected returns (3.0% appreciation + 3.0% rent growth), your $32k cash investment doubles in ~7 years — after that, you're playing with house money.
- By year 8, paydown + projected appreciation supports a ~$31k cash-out refi (75% LTV) — recoverable capital for the next deal without selling this one.
Negotiation context
- It's been on market 22 days — a 2% lower offer ($113k) is reasonable based on typical stale-listing flexibility.
- 2 sale attempts since 8y ago with the ask held roughly flat each time — persistent listings suggest the price (not the market) is what's stuck; bring a comps-based counter.
Risks & watch-outs
- Watch-outs: built in 1930 — expect roof / HVAC / electrical / plumbing capex.
Questions for the listing agent
- What do current leases actually rent for vs. the listed asking? Can we see a recent rent roll and the last 12 months of T-12 income?
- Built in 1930 — when were the roof, HVAC, electrical panel, plumbing, and water heater last replaced?
- Is there a deadline driving the sale (1031 exchange, divorce, estate, relocation)? That informs how much negotiation room exists.
- Crime grade is F in this area — have there been break-ins, vandalism, or insurance claims at this property in the last 3 years? What carrier currently insures it and at what premium?
- The area grade is low — what's the realistic commute time and amenity access for the typical tenant pool here? Any planned neighborhood developments (good or bad) we should know about?
- What's the average days-on-market for RENTAL listings here right now (not sales)? A rising rental-DOM trend means longer vacancies and softer asking-rent achievability than the comps imply.
- What's the recent tenant-quality profile in this submarket — average credit score on applications, eviction rate, late-payment / NSF rate, and stable-employment percentage? A property-management company in the area should have these aggregated.
- How much new for-sale + rental construction is in the pipeline within 1–3 miles? Heavy new supply typically softens prices + rents 12–24 months out; constrained supply supports both.
Investment metrics
- 1% rule
- 0.72% ✗
- Cap rate
- 5.94%
- Cash-on-cash
- -1.24%
- DSCR
- 0.94
- GRM
- 11.6
CMA / ARV
No comps found within radius.
Projected returns pro-forma
3.0% appreciation · 3.0% rent growth · sell at horizon
- IRR
- 6.3%
- Equity multiple
- 1.36×
- Total profit
- $11,671
- Equity at exit
- $51,709
- IRR
- 9.2%
- Equity multiple
- 2.38×
- Total profit
- $44,469
- Equity at exit
- $79,690
Cash invested: $32,200 (down + closing). Projections, not guarantees.
Landlord ↔ Tenant lean methodology
- Overall (STATE)
- 81 Strongly Landlord-Friendly
- State Missouri
- 81 Strongly Landlord-Friendly · R+10
- County
- — inherits STATE
- City
- — inherits STATE
ZIP-level market 64648
- Active inventory
- 7
- Price-to-rent
- 11.6×
Monthly cashflow live
- Estimated rent
- $824 medium interval (Pro) →
- Mortgage (P&I)
- −$603
- Tax from tax record
- −$33 /mo · $399/yr
- Insurance
- −$48
- HOA
- −$0
- Vacancy / Maint / Mgmt
- −$173
- Net cashflow
- $-33
Break-even live
Sensitivity live
| Price | -10% $32 | -5% $-1 | +0% $-33 | +5% $-66 | +10% $-99 |
|---|---|---|---|---|---|
| Rent | -10% $-98 | -5% $-66 | +0% $-33 | +5% $-1 | +10% $32 |
| Rate | -1.0pp $25 | -0.5pp $-4 | base $-33 | +0.5pp $-63 | +1.0pp $-94 |
UW: 25.0% down · 7.5% · 30yr · 1.5% tax · 5.0% vac · 8.0% maint · 8.0% mgmt
Financing live
Cash to close
- Down payment
- $28,750
- Closing costs
- $3,450
- Reserves months
- —
- Total cash needed
- —
Loan-product check · same deal, 3 products live
Conventional
25% down · 7.5% · 30yr
- Down + closing
- —
- Monthly P&I
- —
- Monthly cashflow
- —
- DSCR
- —
- Eligible?
- —
Personal DTI + credit; lowest rate.
DSCR
20% down · 8.5% · 30yr
- Down + closing
- —
- Monthly P&I
- —
- Monthly cashflow
- —
- DSCR
- —
- Eligible?
- —
No personal income docs; deal must DSCR.
Hard money
10% down · 12.0% · 12mo
- Down + closing
- —
- Monthly P&I
- —
- Monthly cashflow
- —
- DSCR
- —
- Eligible?
- —
Short-term bridge; refi at stabilization.
Listing history 8 events
-
2026-06-04statusdays on market $115,000 Pending 22 DOM
-
2026-06-02days on market $115,000 Active 21 DOM
-
2026-06-01days on market $115,000 Active 20 DOM
-
2026-05-31days on market $115,000 Active 19 DOM
-
2026-05-12$115,000 Active 623-char remark
-
2018-09-21soldstatus Sold 241-char remark
Show marketing remark (241 chars)
Charming home with 2 bedrooms and 1 bath, an updated kitchen, bath, pretty wood floors, newer windows and more. Enjoy coffee on the deck! Stop paying rent and invest your hard earned $. Reasonable utilities. Close to downtown and the school.
-
2018-09-19status Pending 241-char remark
Show marketing remark (241 chars)
Charming home with 2 bedrooms and 1 bath, an updated kitchen, bath, pretty wood floors, newer windows and more. Enjoy coffee on the deck! Stop paying rent and invest your hard earned $. Reasonable utilities. Close to downtown and the school.
-
2018-07-31$32,000 Active 241-char remark
Show marketing remark (241 chars)
Charming home with 2 bedrooms and 1 bath, an updated kitchen, bath, pretty wood floors, newer windows and more. Enjoy coffee on the deck! Stop paying rent and invest your hard earned $. Reasonable utilities. Close to downtown and the school.
ⓘ Source: listings_history table (triggers on properties + properties_extension) + one-shot
backfill from property_details.listing_events for pre-trigger history.
Tax reassessment forecast MO · Resets to sale price
- Current annual tax
- $399 · $33/mo
- Projected year-2 tax
- $1,116 · $93/mo
- Expected delta
- +$716/yr (+$60/mo · 179.3%)
ⓘ Screening estimate from a state-policy table — verify with the county assessor before closing.
Climate risk First Street
- Flood 1/10 Low FEMA zone X (unshaded) · 0% chance over 30 yrs
- Wildfire 3/10 Moderate
- Heat 3/10 Moderate 7 d/yr ≥105°F today · 15 d/yr by 30 yrs out
- Wind 2/10 Low
- Air quality 2/10 Low 0 unhealthy d/yr today · 1 by 30 yrs out
Nearby sold comps map
Loading sold comps map…
Walkable amenities ~0.75 mi
Loading nearby amenities…
Taxation est. · year 1
- Rental income
- $9,887
- − Mortgage interest
- −$6,442
- − Property taxes
- −$399
- − Insurance
- −$575
- − Repairs & maintenance
- −$791
- − Management
- −$791
- − Depreciation
- −$3,345
- Taxable loss
- −$2,457
- Est. tax savings @ 24.0%
- +$590
- After-tax cash flow
- $189/yr
For passive investors: Depreciation is non-cash, so a rental often shows a tax loss while cash-flowing — sheltering income. Rental losses are passive: they offset passive income freely, and up to $25,000/yr can offset ordinary (W-2) income if you actively participate and your MAGI is under $100k (phasing out to $0 by $150k); unused losses carry forward. On sale, claimed depreciation is recaptured at up to 25%, and gains may owe capital-gains tax (a 1031 exchange can defer both). Figures are a year-1 estimate at your 24.0% rate — not tax advice; consult a CPA.
Schools (NCES district)
- District
- Tri-County R-VII
- NCES district ID
- 2930390
- Math proficiency
- 45% ▲ 5.00%
- Reading proficiency
- 55% ▬ 0.00%
- Median HH income
- $39,258
- Composite
- 43.76/100
- National rank
- #6368
- State rank
- #131 of 535 in MO
Livability — Jamesport
- Score
- 58/100
- State rank
- #582
- US rank
- #20731
Category grades
Schools grade is shown separately in the Schools card above.
Census & demographics
- Census place
- Jamesport, MO
- Population (ZIP)
- 2,422
Population outlook (Daviess County) Hauer SSP2
- Today (2025)
- 7,695 people
- By 2030
- 7,386 · -4.0%
- By 2040
- 6,860 · -10.9%
- By 2050
- 6,375 · -17.2%
- By 2075
- 5,084 · -33.9%
- By 2100
- 3,583 · -53.4%
Race, ethnicity, and origin ACS 2023
- Neighborhood character
- Predominantly White (95%)
- Race & ethnicity
- White 95% Hispanic / Latino 3% Two or more races 3% Black 1%
- Common ancestry
- Polish 11% Slovak 2% Italian 2%
- Foreign-born
- 1% · Canada, Guatemala
- Languages at home
- 63% English-only · German/W. Germanic 35% Russian/Polish/Slavic 1%
Political lean MEDSL · Daviess
- 2024 margin
- Solid R (+63.3) · D 17.9% · R 81.2%
- 2008→2024 swing
- -40.5pp toward R · 2008: -22.8pp · 2024: -63.3pp
- All cycles
- 2024: R+63.3 2020: R+60.2 2016: R+55.1 2012: R+33.0 2008: R+22.8
Not yet ingested
- Civics
- —
Market trends
- HPI YoY
- —
- Current HPI
- —
- Rent YoY
- —
- Metro
- —
- State GDP YoY
- ▲ 1.84%
- F500 in state
- 20
Industry mix (Fortune 500 HQ in MO)
| Industry | F500 HQs | Revenue |
|---|---|---|
| Healthcare | 1 | $163B |
|
||
| Insurance | 1 | $21B |
|
||
| Industrial Technology | 1 | $17B |
|
||
| Retail | 1 | $16B |
|
||
| Industrial Distribution | 1 | $10B |
|
||
| Utilities | 1 | $9B |
|
||
Price history
+259.4% since first listed6 events — show timeline
- 2026-06-10 Sold (MLS) — Heartland MLS as Distributed by MLS Grid
- 2026-06-03 Pending — Heartland MLS as Distributed by MLS Grid
- 2026-05-12 Listed $115,000 Heartland MLS as Distributed by MLS Grid
- 2018-09-21 Sold (MLS) — Heartland MLS as Distributed by MLS Grid
- 2018-09-19 Pending — Heartland MLS as Distributed by MLS Grid
- 2018-07-31 Listed $32,000 Heartland MLS as Distributed by MLS Grid
Property tax history
+2.4%/yrLatest (2025): $399 · +11.1% YoY. Source: county tax records.
Cash-flow waterfall
monthlySold comps — $/sqft
last 12 mo · ≤1 miLoading sold comps…