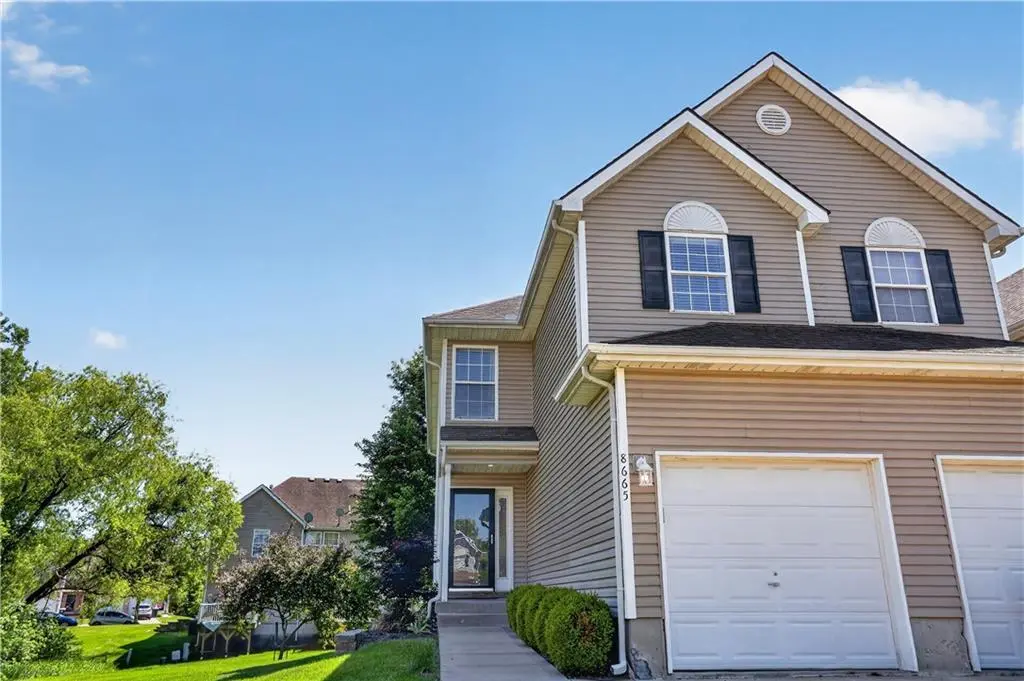
8665 NE 97th Ter · Kansas City, MO
Flood risk 6/10 · Moderate
- FEMA flood zone
- X (unshaded)
- Chance of flooding over 30 yrs
- 0.68%
- Est. flood insurance / yr
- $473 – $860
Fire risk 2/10 · Minimal
- Est. fire insurance / yr
- $1,054 – $1,958
Heat risk 4/10 · Minor
- Hot days now (above 106°F)
- 7 days/yr
- Hot days in 30 yrs
- 17 days/yr
Wind risk 2/10 · Minimal
- Chance of severe wind over 30 yrs
- —
Air-quality risk 3/10 · Minor
- Unhealthy air days now
- 3 days/yr
- Unhealthy air days in 30 yrs
- 4 days/yr
Risk factors via First Street. Map © Google.
Why this score? — see what drove the C grade
The composite is a weighted blend of 9 inputs, each scored 0–100. Each bar is that input's sub-score; the figure is the points it added to the 100-point composite (weight × sub-score).
- Cash flow +22.6/30.0
- DSCR +7.2/10.0
- 1% rule +5.8/10.0
- ARV discount +5.2/15.0
- Rent growth +4.9/5.0
- Schools +4.5/10.0
- Livability +3.9/5.0
- Condition / age +2.5/5.0
- Appreciation +0.0/10.0
$250,000
🖨 Deal sheet 📄 Offer letter ✓ Due diligence
Listing remarks MLS
One owner end unit townhome sitting on an oversized cul de sac lot with greenspace between buidings. Neutral decor. Spacious Master Bedroom with walk in closet, New tile in master bath. Mnt free living at it's best. Laundry on second level. All window treatments included. Beautifully landscaped.
Key facts
- $33 HOA
- Garage
- Community pool
Property features AI
Finance
- Other: Located inside city limits
- HOA & community: HOA managed by First Service Residential; Annual association fee (approximately $400) covering building maintenance, lawn service, roof replacement, and snow removal; Community amenities include pool, play area, and trails; Maintenance provided (per community)
Exterior
- Parking: Attached garage with garage door opener (garage faces front); 1 garage space
- Security: Smoke detector(s)
- Utilities: Public water; Public sewer; Cable, fiber, and high-speed internet available
- Home design: Attached townhouse; Residential property; 2 stories; Faces north; Living area approximately 1,607 (above grade)
- Construction: Frame construction with vinyl siding; Composition roof
- Exterior features: Deck; Patio; Cul-de-sac location; In-ground sprinkler system; Zero lot line; Paved road with public maintenance
Interior
- Kitchen: Dishwasher; Disposal; Microwave; Refrigerator; Electric range; Kitchen island; Pantry; Vinyl in kitchen area (per room features)
- Bedrooms: 3 bedrooms (primary and other bedrooms located on upper and main levels as noted in room layout)
- Flooring: Carpet; Laminate; Luxury vinyl; Tile; Vinyl
- Bathrooms: 2 full bathrooms; 1 half bathroom; Primary bathroom with double vanity, shower only, ceramic tile and walk-in closet(s); Upper bathroom with double vanity, shower over tub, vinyl
- Heating & cooling: Natural gas heating; Electric central cooling; Smart thermostat
- Interior features: Ceiling fans; Kitchen island; Pantry; Smart thermostat; Vaulted ceilings; Walk-in closets; Thermal windows; Storm doors; Smoke detector(s); Breakfast room; Formal living room; Breakfast area / Eat-in kitchen / Kitchen-dining combo
- Laundry & utility: Washer; Dryer; Laundry closet on upper level
Neighborhood map
What this means for you Summary
Snapshot
- This is a 3-bed/2.0-bath townhouse listed at $250k.
Deal economics
- At list price, monthly cash flow is $425 ($5k/yr) — positive.
- The deal already cash-flows at list — no discount required.
- Meets the 1% rule at list price ($3k rent vs $250k).
- Cap rate 8.3% vs local median 3.9% in Kansas City — top-decile yield for the area; either an underpriced asset or a hidden risk that comps aren't pricing in. Stress-test before assuming the spread holds.
Location & tenants
- Location reads 78/100 on livability (#28 in MO, #2,671 nationally) — a middle-class / working-renter tenant base. Strengths: amenities A+, commute A+, cost of living A+; Watch: crime F.
- Liberty 53 (suburban): math 41% / reading 59% proficiency, ranked #24 of 324 in MO (top 7%) — acceptable for families but not a draw, mixed tenant base, ~2y average lease; only 15% free/reduced lunch — higher-income household profile.
- Zoned schools: Shoal Creek Elem. (math 63% / reading 68%, grade B+, #63 of 1,115 statewide, top 6%, 883 students, 8% FRL); Liberty North High School (math 25% / reading 75%, grade D+, #116 of 521 statewide, top 22%, 2,326 students, 18% FRL) — zoned schools at 13% FRL track the district average.
- Market conditions: Rents rising fast (+9.5%/yr); 240 active listings in the ZIP; high-income renter base; 341 units permitted in Clay County in 2024 (40 in 5+ unit buildings).
Forward outlook
- Local home prices are declining (-3.0%/yr); year-one equity from $2k of loan paydown is wiped out by about $8k of value loss. Plan a longer hold.
- Clay County population projected at +24% by 2050 — long-run rental-demand tailwind backs the buy-and-hold thesis.
- At projected returns (-3.0% appreciation + 8.0% rent growth), your $70k cash investment doubles in ~9 years — after that, you're playing with house money.
Negotiation context
- Only 2 days on market — expect competitive offers; lowballing is unlikely to land.
- 3 sale attempts since 23y ago with the ask held roughly flat each time — persistent listings suggest the price (not the market) is what's stuck; bring a comps-based counter.
Risks & watch-outs
- Climate carrying-cost: major flood risk — expect insurance premiums to compound above CPI over the hold.
Questions for the listing agent
- What does the HOA fee cover, when was the last increase, and are there any pending special assessments or reserve-fund shortfalls?
- Is there a deadline driving the sale (1031 exchange, divorce, estate, relocation)? That informs how much negotiation room exists.
- Crime grade is F in this area — have there been break-ins, vandalism, or insurance claims at this property in the last 3 years? What carrier currently insures it and at what premium?
- What's the average days-on-market for RENTAL listings here right now (not sales)? A rising rental-DOM trend means longer vacancies and softer asking-rent achievability than the comps imply.
- What's the recent tenant-quality profile in this submarket — average credit score on applications, eviction rate, late-payment / NSF rate, and stable-employment percentage? A property-management company in the area should have these aggregated.
- How much new for-sale + rental construction is in the pipeline within 1–3 miles? Heavy new supply typically softens prices + rents 12–24 months out; constrained supply supports both.
Investment metrics
- 1% rule
- 1.08% ✓
- Cap rate
- 8.33%
- Cash-on-cash
- 7.29%
- DSCR
- 1.32
- GRM
- 7.7
CMA / ARV
- ARV (median comp)
- $237,925
- List price
- $250,000
- Delta
- 5.08%
- Verdict
- FAIR
- Comps
- 20 within 1.0 mi
Show comp detail 12 sales within ~0.75 mi
| Address | Dist | Beds/Ba | Sqft | Sold | Price | $/sf | Match |
|---|---|---|---|---|---|---|---|
| 8662 NE 97th Ter | 0.04mi | 3/2.5 | 1,607 (0%) | 7mo | $250,000 | $156 | 90 |
| 8633 NE 98th Ct | 0.07mi | 3/2.5 | 1,538 (-4%) | 3mo | $259,900 | $169 | 85 |
| 8616 NE 97th St | 0.05mi | 3/2.5 | 1,607 (0%) | 14mo | $257,000 | $160 | 84 |
| 8675 NE 97th St | 0.06mi | 3/2.5 | 1,607 (0%) | 14mo | $255,000 | $159 | 84 |
| 8635 NE 97th St | 0.07mi | 3/2.5 | 1,607 (0%) | 15mo | $245,000 | $152 | 83 |
| 8654 NE 97th St | 0.03mi | 3/2.5 | 1,520 (-5%) | 10mo | $265,000 | $174 | 80 |
| 9831 N Lewis Ave | 0.17mi | 3/2.5 | 1,519 (-6%) | 4mo | $239,888 | $158 | 78 |
| 8659 NE 97th Ter | 0.01mi | 3/2.5 | 1,498 (-7%) | 11mo | $255,000 | $170 | 77 |
| 8601 NE 97th St | 0.09mi | 3/2.5 | 1,517 (-6%) | 13mo | $235,000 | $155 | 74 |
| 8614 NE 98th Ct | 0.13mi | 2/2.5 (-1) | 1,451 (-10%) | 3mo | $229,900 | $158 | 69 |
| 9705 N Lewis Ave | 0.08mi | 2/2.5 (-1) | 1,451 (-10%) | 15mo | $237,500 | $164 | 61 |
| 9756 N Lewis Ave | 0.08mi | 2/2.5 (-1) | 1,451 (-10%) | 16mo | $245,000 | $169 | 60 |
Match score weights: distance 35% · size 25% · config 20% · recency 20%. Top-matched comps best support the ARV.
Projected returns pro-forma
-3.0% appreciation · 8.0% rent growth · sell at horizon
- IRR
- 0.3%
- Equity multiple
- 1.01×
- Total profit
- $829
- Equity at exit
- $37,276
- IRR
- 14.5%
- Equity multiple
- 2.44×
- Total profit
- $100,506
- Equity at exit
- $21,615
Cash invested: $70,000 (down + closing). Projections, not guarantees.
Landlord ↔ Tenant lean methodology
- Overall (STATE)
- 81 Strongly Landlord-Friendly
- State Missouri
- 81 Strongly Landlord-Friendly · R+10
- County
- — inherits STATE
- City
- — inherits STATE
ZIP-level market 64157
- Home prices YoY
- -18.1%
- Rents YoY
- 9.5%
- Active inventory
- 240
- Price-to-rent
- 7.7×
Monthly cashflow live
- Estimated rent
- $2,695 medium interval (Pro) →
- Mortgage (P&I)
- −$1,311
- Tax from tax record
- −$256 /mo · $3,068/yr
- Insurance
- −$104
- HOA
- −$33
- Vacancy / Maint / Mgmt
- −$566
- Net cashflow
- $425
Break-even live
UW: 25.0% down · 7.5% · 30yr · 1.5% tax · 5.0% vac · 8.0% maint · 8.0% mgmt
Financing live
Cash to close
- Down payment
- $62,500
- Closing costs
- $7,500
- Reserves months
- —
- Total cash needed
- —
Loan-product check · same deal, 3 products live
Conventional
25% down · 7.5% · 30yr
- Down + closing
- —
- Monthly P&I
- —
- Monthly cashflow
- —
- DSCR
- —
- Eligible?
- —
Personal DTI + credit; lowest rate.
DSCR
20% down · 8.5% · 30yr
- Down + closing
- —
- Monthly P&I
- —
- Monthly cashflow
- —
- DSCR
- —
- Eligible?
- —
No personal income docs; deal must DSCR.
Hard money
10% down · 12.0% · 12mo
- Down + closing
- —
- Monthly P&I
- —
- Monthly cashflow
- —
- DSCR
- —
- Eligible?
- —
Short-term bridge; refi at stabilization.
HOA detail
- Monthly dues
- $33 · $396/yr
Listing history 9 events
-
2026-05-17status Pending 450-char remark
-
2026-05-15$250,000 Active 450-char remark
-
2026-05-14historical $250,000 450-char remark
-
2021-11-01soldstatus
-
2021-10-29soldstatus Closed 296-char remark
Show marketing remark (296 chars)
One owner end unit townhome sitting on an oversized cul de sac lot with greenspace between buidings. Neutral decor. Spacious Master Bedroom with walk in closet, New tile in master bath. Mnt free living at it's best. Laundry on second level. All window treatments included. Beautifully landscaped.
-
2021-08-21status Pending 296-char remark
Show marketing remark (296 chars)
One owner end unit townhome sitting on an oversized cul de sac lot with greenspace between buidings. Neutral decor. Spacious Master Bedroom with walk in closet, New tile in master bath. Mnt free living at it's best. Laundry on second level. All window treatments included. Beautifully landscaped.
-
2021-08-18$190,000 Active 296-char remark
Show marketing remark (296 chars)
One owner end unit townhome sitting on an oversized cul de sac lot with greenspace between buidings. Neutral decor. Spacious Master Bedroom with walk in closet, New tile in master bath. Mnt free living at it's best. Laundry on second level. All window treatments included. Beautifully landscaped.
-
2003-08-22soldstatus
Show marketing remark (304 chars)
Beautiful 2 & 3 bdrm townhomes w/ 2.5 baths & 1 car gar. All have full bsmts, most have w/ outs, most exterior maintenance provided. All GE appliances in purchase price. Rm sizes are aapproximate. Govt financing add $1,200. Maintenance fee's $96.00 per month. Homes Assoc is $250.00 per year.
-
2003-01-02$128,900
Show marketing remark (304 chars)
Beautiful 2 & 3 bdrm townhomes w/ 2.5 baths & 1 car gar. All have full bsmts, most have w/ outs, most exterior maintenance provided. All GE appliances in purchase price. Rm sizes are aapproximate. Govt financing add $1,200. Maintenance fee's $96.00 per month. Homes Assoc is $250.00 per year.
ⓘ Source: listings_history table (triggers on properties + properties_extension) + one-shot
backfill from property_details.listing_events for pre-trigger history.
Tax reassessment forecast MO · Resets to sale price
- Current annual tax
- $3,068 · $256/mo
- Projected year-2 tax
- $3,068 · $256/mo
- Expected delta
- $0/yr ($0/mo · 0.0%)
ⓘ Screening estimate from a state-policy table — verify with the county assessor before closing.
Climate risk First Street
- Flood 6/10 Major FEMA zone X (unshaded) · 68% chance over 30 yrs
- Wildfire 2/10 Low
- Heat 4/10 Moderate 7 d/yr ≥106°F today · 17 d/yr by 30 yrs out
- Wind 2/10 Low
- Air quality 3/10 Moderate 3 unhealthy d/yr today · 4 by 30 yrs out
Nearby sold comps map
Loading sold comps map…
Walkable amenities ~0.75 mi
Loading nearby amenities…
Taxation est. · year 1
- Rental income
- $32,338
- − Mortgage interest
- −$14,004
- − Property taxes
- −$3,068
- − Insurance
- −$1,250
- − Repairs & maintenance
- −$2,587
- − Management
- −$2,587
- − HOA
- −$396
- − Depreciation
- −$7,273
- Taxable income
- $1,173
- Est. tax owed @ 24.0%
- −$282
- After-tax cash flow
- $4,819/yr
For passive investors: Depreciation is non-cash, so a rental often shows a tax loss while cash-flowing — sheltering income. Rental losses are passive: they offset passive income freely, and up to $25,000/yr can offset ordinary (W-2) income if you actively participate and your MAGI is under $100k (phasing out to $0 by $150k); unused losses carry forward. On sale, claimed depreciation is recaptured at up to 25%, and gains may owe capital-gains tax (a 1031 exchange can defer both). Figures are a year-1 estimate at your 24.0% rate — not tax advice; consult a CPA.
Schools (NCES district)
- District
- Liberty 53
- NCES district ID
- 2918540
- Math proficiency
- 41% ▼ -9.00%
- Reading proficiency
- 59% ▼ -3.00%
- Median HH income
- $78,226
- Composite
- 45.41/100
- National rank
- #2624
- State rank
- #24 of 324 in MO
Livability — Kansas City
- Score
- 78/100
- State rank
- #28
- US rank
- #2671
Category grades
Schools grade is shown separately in the Schools card above.
Census & demographics
- Census place
- Kansas City, MO
- County
- Clay County · 220,651 people
- City population
- 439,467
- Metro
- Kansas City, MO-KS
- Population (ZIP)
- 23,030
- Household income
- $149,526
- Rent vs Own
- Severe rent burden
- 87.0
Population outlook (Clay County) Hauer SSP2
- Today (2025)
- 266,022 people
- By 2030
- 280,057 · +5.3%
- By 2040
- 306,153 · +15.1%
- By 2050
- 328,630 · +23.5%
- By 2075
- 375,182 · +41.0%
- By 2100
- 392,861 · +47.7%
Race, ethnicity, and origin ACS 2023
- Neighborhood character
- Predominantly White (82%)
- Race & ethnicity
- White 82% Asian 7% Two or more races 6% Hispanic / Latino 5% Black 3%
- Common ancestry
- Slovak 3% Italian 2% Lithuanian 2%
- Foreign-born
- 6% · Canada, Vietnam, China
- Languages at home
- 92% English-only · Spanish 3% Other Asian/Pacific 2% Vietnamese 1%
Political lean MEDSL · Clay
- 2024 margin
- Lean R (+5.6) · D 46.4% · R 52.0% · Other 1.6%
- 2008→2024 swing
- -4.9pp toward R · 2008: -0.7pp · 2024: -5.6pp
- All cycles
- 2024: R+5.6 2020: R+4.1 2016: R+11.1 2012: R+8.4 2008: R+0.7
Not yet ingested
- Civics
- —
Market trends
- HPI YoY
- ▼ -43.38%
- Current HPI
- 195.9921
- Rent YoY
- ▲ 9.50%
- Metro
- Kansas City, MO-KS
- State GDP YoY
- ▲ 1.84%
- F500 in state
- 20
Industry mix (Fortune 500 HQ in MO)
| Industry | F500 HQs | Revenue |
|---|---|---|
| Healthcare | 1 | $163B |
|
||
| Insurance | 1 | $21B |
|
||
| Industrial Technology | 1 | $17B |
|
||
| Retail | 1 | $16B |
|
||
| Industrial Distribution | 1 | $10B |
|
||
| Utilities | 1 | $9B |
|
||
Price history
+93.9% since first listed9 events — show timeline
- 2026-05-17 Pending — Heartland MLS as Distributed by MLS Grid
- 2026-05-15 Listed $250,000 Heartland MLS as Distributed by MLS Grid
- 2026-05-14 Coming Soon $250,000 Heartland MLS as Distributed by MLS Grid
- 2021-11-01 Sold (Public Records) — Public Records
- 2021-10-29 Sold (MLS) — Heartland MLS as Distributed by MLS Grid
- 2021-08-21 Pending — Heartland MLS as Distributed by MLS Grid
- 2021-08-18 Listed $190,000 Heartland MLS as Distributed by MLS Grid
- 2003-08-22 Sold (MLS) — Heartland MLS as Distributed by MLS Grid
- 2003-01-02 Listed $128,900 Heartland MLS as Distributed by MLS Grid
Property tax history
+3.5%/yrLatest (2025): $3,068 · +8.8% YoY. Source: county tax records.
Cash-flow waterfall
monthlySold comps — $/sqft
last 12 mo · ≤1 miLoading sold comps…