 Multi-family
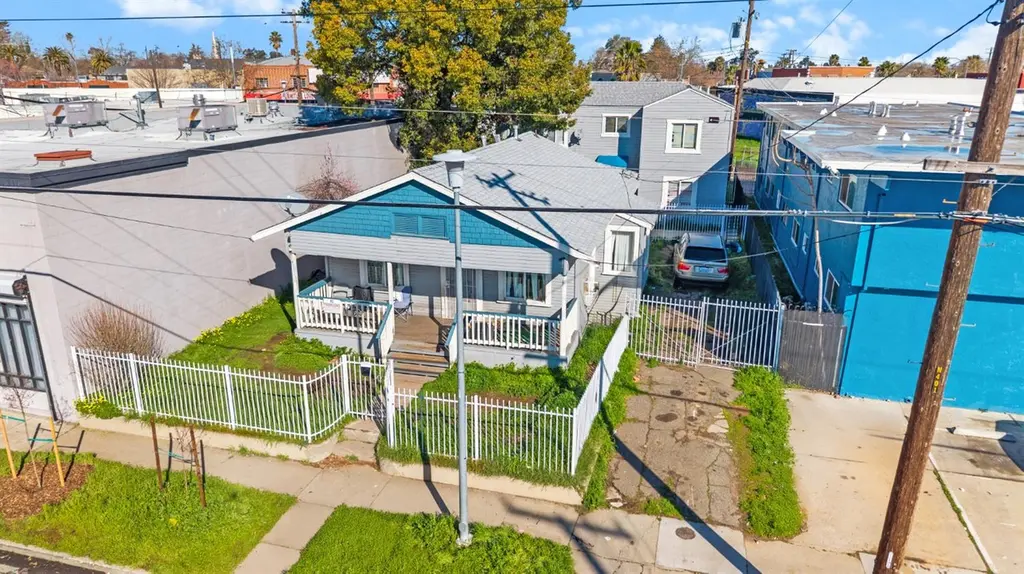
715 Dixieanne Ave · Sacramento, CA
Flood risk 6/10 · Moderate
- FEMA flood zone
- X
- Chance of flooding over 30 yrs
- 0.27%
- Est. flood insurance / yr
- $507 – $1,088
Fire risk 4/10 · Minor
- Est. fire insurance / yr
- $659 – $1,223
Heat risk 7/10 · Major
- Hot days now (above 102°F)
- 7 days/yr
- Hot days in 30 yrs
- 15 days/yr
Wind risk 1/10 · Minimal
- Chance of severe wind over 30 yrs
- —
Air-quality risk 10/10 · Severe
- Unhealthy air days now
- 27 days/yr
- Unhealthy air days in 30 yrs
- 33 days/yr
Risk factors via First Street. Map © Google.
Why this score? — see what drove the C+ grade
The composite is a weighted blend of 9 inputs, each scored 0–100. Each bar is that input's sub-score; the figure is the points it added to the 100-point composite (weight × sub-score).
- Cash flow +27.7/30.0
- DSCR +9.8/10.0
- ARV discount +7.5/15.0
- 1% rule +7.3/10.0
- Livability +3.6/5.0
- Schools +3.1/10.0
- Rent growth +2.9/5.0
- Condition / age +2.5/5.0
- Appreciation +0.0/10.0
$599,000
🖨 Deal sheet 📄 Offer letter ✓ Due diligence
Multi-family units
County records classify this as Multi-Family (5+ Unit). Listing-text estimate: 1 unit. estimate disagrees with records
5+ unit building — per-unit beds/baths from public records are typically unavailable; the breakdown below (if shown) is an estimate from the listing text.
Listing remarks
We are pleased to present 715 Dixieanne Ave, a 5-unit multifamily community located in Old North Sacramento sub-market. The subject property is situated on 0.15 acre lot with 3,276 rentable square feet consisting of a 3bedroom/1bathroom Single Family home in the front facing Dixieanne Avenue. The back 4plex faces the alley and consists of one Studio apartment, one 2bedroom/1bathroom + office, one 1bedroom/1bathroom + Office and one 1bedroom/1bathroom unit. The complex consists of two buildings with open parking in the front and back.
Key facts
- 3
- Single family home
- Old north sacramento
Tags
Neighborhood map
What this means for you Summary
Snapshot
- This is a 8-bed/1.0-bath multifamily listed at $599k.
Deal economics
- At list price, monthly cash flow is $2k ($22k/yr) — positive.
- The deal already cash-flows at list — no discount required.
- Meets the 1% rule at list price ($7k rent vs $599k).
- Recommended offer: $581k (3.0% below list) — sets the bar for market timing.
- Cap rate 9.9% vs local median 3.0% in Sacramento — top-decile yield for the area; either an underpriced asset or a hidden risk that comps aren't pricing in. Stress-test before assuming the spread holds.
Location & tenants
- Location reads 71/100 on livability (#218 in CA) — a middle-class / working-renter tenant base. Strengths: amenities A+, commute A+, housing A; Watch: schools D+, crime F, cost of living F.
- Twin Rivers Unified (suburban): math 29% / reading 37% proficiency, ranked #970 of 1,400 in CA (top 69%) — families likely to look elsewhere, expect single-tenant / working-renter base with shorter leases; 76% free/reduced lunch — lower-income household profile, screen leases tightly.
- Market conditions: Rents rising (+1.5%/yr); 98 active listings in the ZIP; 6,825 units permitted in Sacramento County in 2024 (1,752 in 5+ unit buildings).
- At $7,366/mo this rent would consume 147% of the median local household income ($60k/yr) (locally 1877% of renters already pay >50% of income on rent) — very limited rent-growth headroom before tenants either downsize or default.
Forward outlook
- Local home prices are declining (-3.0%/yr); year-one equity from $4k of loan paydown is wiped out by about $18k of value loss. Plan a longer hold.
- Sacramento County population projected at +17% by 2050 — long-run rental-demand tailwind backs the buy-and-hold thesis.
Negotiation context
- It's been on market 42 days — a 3% lower offer ($581k) is reasonable based on typical stale-listing flexibility.
Risks & watch-outs
- Watch-outs: built in 1920 — expect roof / HVAC / electrical / plumbing capex.
- Climate carrying-cost: major flood risk; extreme-heat days projected 7→15/yr by 2055 (HVAC capex compounding) — expect insurance premiums to compound above CPI over the hold.
Questions for the listing agent
- It's been on market 42 days. Have you received any prior offers? Is the seller open to a 3% concession, seller financing, or rate buy-down credit?
- Built in 1920 — when were the roof, HVAC, electrical panel, plumbing, and water heater last replaced?
- Is there a deadline driving the sale (1031 exchange, divorce, estate, relocation)? That informs how much negotiation room exists.
- Schools are D-rated, which usually means shorter tenancies and higher turnover. Who's the typical renter profile here, and what's been the actual vacancy rate?
- Crime grade is F in this area — have there been break-ins, vandalism, or insurance claims at this property in the last 3 years? What carrier currently insures it and at what premium?
- What's the average days-on-market for RENTAL listings here right now (not sales)? A rising rental-DOM trend means longer vacancies and softer asking-rent achievability than the comps imply.
- What's the recent tenant-quality profile in this submarket — average credit score on applications, eviction rate, late-payment / NSF rate, and stable-employment percentage? A property-management company in the area should have these aggregated.
- How much new apartment / multifamily construction is in the pipeline within 1–3 miles? Heavy new supply (>2% of stock underway) typically softens rents 12–24 months out; light construction supports rent growth.
Investment metrics
- 1% rule
- 1.23% ✓
- Cap rate
- 9.92%
- Cash-on-cash
- 12.96%
- DSCR
- 1.58
- GRM
- 6.8
CMA / ARV
- ARV (median comp)
- $388,576
- List price
- $599,000
- Delta
- 54.15%
- Verdict
- OVERPRICED
- Comps
- 11 within 1.0 mi
Projected returns pro-forma
-3.0% appreciation · 1.52% rent growth · sell at horizon
- IRR
- 1.2%
- Equity multiple
- 1.04×
- Total profit
- $7,498
- Equity at exit
- $89,313
- IRR
- 9.3%
- Equity multiple
- 1.67×
- Total profit
- $112,117
- Equity at exit
- $51,791
Cash invested: $167,720 (down + closing). Projections, not guarantees.
Landlord ↔ Tenant lean methodology
- Overall (STATE)
- 18 Strongly Tenant-Friendly
- State California
- 18 Strongly Tenant-Friendly · D+13
- County
- — inherits STATE
- City
- — inherits STATE
ZIP-level market 95815
- Home prices YoY
- -32.2%
- Rents YoY
- 1.5%
- Active inventory
- 98
- Price-to-rent
- 27.0×
Monthly cashflow live
- Estimated rent
- $7,366 high interval (Pro) →
- Mortgage (P&I)
- −$3,141
- Tax from tax record
- −$617 /mo · $7,408/yr
- Insurance
- −$250
- HOA
- −$0
- Vacancy / Maint / Mgmt
- −$1,547
- Net cashflow
- $1,811
Break-even live
5-unit breakdown (identical units grouped — click to expand)
| Units | Beds | Baths | Est. rent |
|---|---|---|---|
| 1× unit | 3 | 1 | $1,847 |
| 3× units | 1 | 1 | $4,065 |
| #2 | 1 | 1 | $1,355 |
| #4 | 1 | 1 | $1,355 |
| #5 | 1 | 1 | $1,355 |
| 1× unit | 2 | 1 | $1,454 |
| Total (5 units) | $7,366 | ||
UW: 25.0% down · 7.5% · 30yr · 1.5% tax · 5.0% vac · 8.0% maint · 8.0% mgmt
Financing live
Cash to close
- Down payment
- $149,750
- Closing costs
- $17,970
- Reserves months
- —
- Total cash needed
- —
Loan-product check · same deal, 3 products live
Conventional
25% down · 7.5% · 30yr
- Down + closing
- —
- Monthly P&I
- —
- Monthly cashflow
- —
- DSCR
- —
- Eligible?
- —
Personal DTI + credit; lowest rate.
DSCR
20% down · 8.5% · 30yr
- Down + closing
- —
- Monthly P&I
- —
- Monthly cashflow
- —
- DSCR
- —
- Eligible?
- —
No personal income docs; deal must DSCR.
Hard money
10% down · 12.0% · 12mo
- Down + closing
- —
- Monthly P&I
- —
- Monthly cashflow
- —
- DSCR
- —
- Eligible?
- —
Short-term bridge; refi at stabilization.
Listing history 21 events
-
2026-06-18days on market $599,000 Active 42 DOM
-
2026-06-17days on market $599,000 Active 41 DOM
-
2026-06-16days on market $599,000 Active 40 DOM
-
2026-06-15days on market $599,000 Active 39 DOM
-
2026-06-13days on market $599,000 Active 37 DOM
-
2026-06-13days on market $599,000 Active 36 DOM
-
2026-06-09days on market $599,000 Active 33 DOM
-
2026-06-08days on market $599,000 Active 32 DOM
-
2026-06-07days on market $599,000 Active 31 DOM
-
2026-06-03days on market $599,000 Active 27 DOM
-
2026-06-02days on market $599,000 Active 26 DOM
-
2026-06-01days on market $599,000 Active 25 DOM
-
2026-05-31days on market $599,000 Active 24 DOM
-
2021-12-15soldstatus $535,000
-
2021-07-23soldstatus $380,000
-
2002-02-01soldstatus $172,000
-
1998-03-31soldstatus $33,500
-
1989-01-23soldstatus $90,000
-
1982-06-10soldstatus $45,000
-
1982-06-10soldstatus $55,000
-
1979-11-28soldstatus $37,500
ⓘ Source: listings_history table (triggers on properties + properties_extension) + one-shot
backfill from property_details.listing_events for pre-trigger history.
Tax reassessment forecast CA · Resets to sale price
- Current annual tax
- $7,408 · $617/mo
- Projected year-2 tax
- $7,408 · $617/mo
- Expected delta
- $0/yr ($0/mo · 0.0%)
ⓘ Screening estimate from a state-policy table — verify with the county assessor before closing.
Climate risk First Street
- Flood 6/10 Major FEMA zone X · 27% chance over 30 yrs
- Wildfire 4/10 Moderate
- Heat 7/10 Severe 7 d/yr ≥102°F today · 15 d/yr by 30 yrs out
- Wind 1/10 Low
- Air quality 10/10 Extreme 27 unhealthy d/yr today · 33 by 30 yrs out
Nearby sold comps map
Loading sold comps map…
Walkable amenities ~0.75 mi
Loading nearby amenities…
Taxation est. · year 1
- Rental income
- $88,392
- − Mortgage interest
- −$33,553
- − Property taxes
- −$7,408
- − Insurance
- −$2,995
- − Repairs & maintenance
- −$7,071
- − Management
- −$7,071
- − Depreciation
- −$17,425
- Taxable income
- $12,867
- Est. tax owed @ 24.0%
- −$3,088
- After-tax cash flow
- $18,644/yr
For passive investors: Depreciation is non-cash, so a rental often shows a tax loss while cash-flowing — sheltering income. Rental losses are passive: they offset passive income freely, and up to $25,000/yr can offset ordinary (W-2) income if you actively participate and your MAGI is under $100k (phasing out to $0 by $150k); unused losses carry forward. On sale, claimed depreciation is recaptured at up to 25%, and gains may owe capital-gains tax (a 1031 exchange can defer both). Figures are a year-1 estimate at your 24.0% rate — not tax advice; consult a CPA.
Schools (NCES district)
- District
- Twin Rivers Unified
- NCES district ID
- 0601332
- Math proficiency
- 29% ▲ 2.00%
- Reading proficiency
- 37% ▲ 2.00%
- Median HH income
- $42,481
- Composite
- 30.67/100
- National rank
- #11437
- State rank
- #970 of 1400 in CA
Livability — Sacramento
- Score
- 71/100
- State rank
- #218
- US rank
- #6957
Category grades
Schools grade is shown separately in the Schools card above.
Census & demographics
- Census place
- Sacramento, CA
- County
- Sacramento County · 1,539,646 people
- City population
- 761,410
- Metro
- Sacramento-Roseville-Folsom, CA
- Population (ZIP)
- 26,658
- Household income
- $60,097
- Rent vs Own
- Severe rent burden
- 1877.0
Population outlook (Sacramento County) Hauer SSP2
- Today (2025)
- 1,660,763 people
- By 2030
- 1,732,990 · +4.3%
- By 2040
- 1,855,755 · +11.7%
- By 2050
- 1,941,335 · +16.9%
- By 2075
- 2,046,162 · +23.2%
- By 2100
- 1,961,444 · +18.1%
Race, ethnicity, and origin ACS 2023
- Neighborhood character
- Highly diverse neighborhood (Simpson 0.72)
- Race & ethnicity
- Hispanic / Latino 42% White 28% Two or more races 14% Black 12% Asian 11% Native American 3%
- Hispanic origin (detail)
- Mexican 36%
- Common ancestry
- Russian 1% Italian 1% Romanian 1%
- Foreign-born
- 23% · Canada, China, Vietnam
- Languages at home
- 58% English-only · Spanish 28% Other Asian/Pacific 6% Other Indo-European 2%
Political lean MEDSL · Sacramento
- 2024 margin
- D (+19.7) · D 58.1% · R 38.4% · Other 3.5%
- 2008→2024 swing
- +0.7pp no change · 2008: 19.0pp · 2024: 19.7pp
- All cycles
- 2024: D+19.7 2020: D+25.3 2016: D+23.7 2012: D+16.3 2008: D+19.0
Not yet ingested
- Civics
- —
Market trends
- HPI YoY
- ▼ -213.04%
- Current HPI
- 449.1398
- Rent YoY
- ▲ 1.52%
- Metro
- Sacramento-Roseville-Folsom, CA
- State GDP YoY
- ▲ 3.21%
- F500 in state
- 116
Industry mix (Fortune 500 HQ in CA)
| Industry | F500 HQs | Revenue |
|---|---|---|
| Technology | 27 | $1,492B |
|
||
| Financial Services | 3 | $174B |
|
||
| Retail | 3 | $44B |
|
||
| Insurance | 3 | $26B |
|
||
| Media / Entertainment | 2 | $115B |
|
||
| Pharmaceuticals / Biotech | 2 | $62B |
|
||
Price history
+1326.7% since first listed8 events — show timeline
- 2021-12-15 Sold (Public Records) $535,000 Public Records
- 2021-07-23 Sold (Public Records) $380,000 Public Records
- 2002-02-01 Sold (Public Records) $172,000 Public Records
- 1998-03-31 Sold (Public Records) $33,500 Public Records
- 1989-01-23 Sold (Public Records) $90,000 Public Records
- 1982-06-10 Sold (Public Records) $55,000 Public Records
- 1982-06-10 Sold (Public Records) $45,000 Public Records
- 1979-11-28 Sold (Public Records) $37,500 Public Records
Property tax history
+6.0%/yrLatest (2025): $7,408 · -5.9% YoY. Source: county tax records.
Cash-flow waterfall
monthlySold comps — $/sqft
last 12 mo · ≤1 miLoading sold comps…