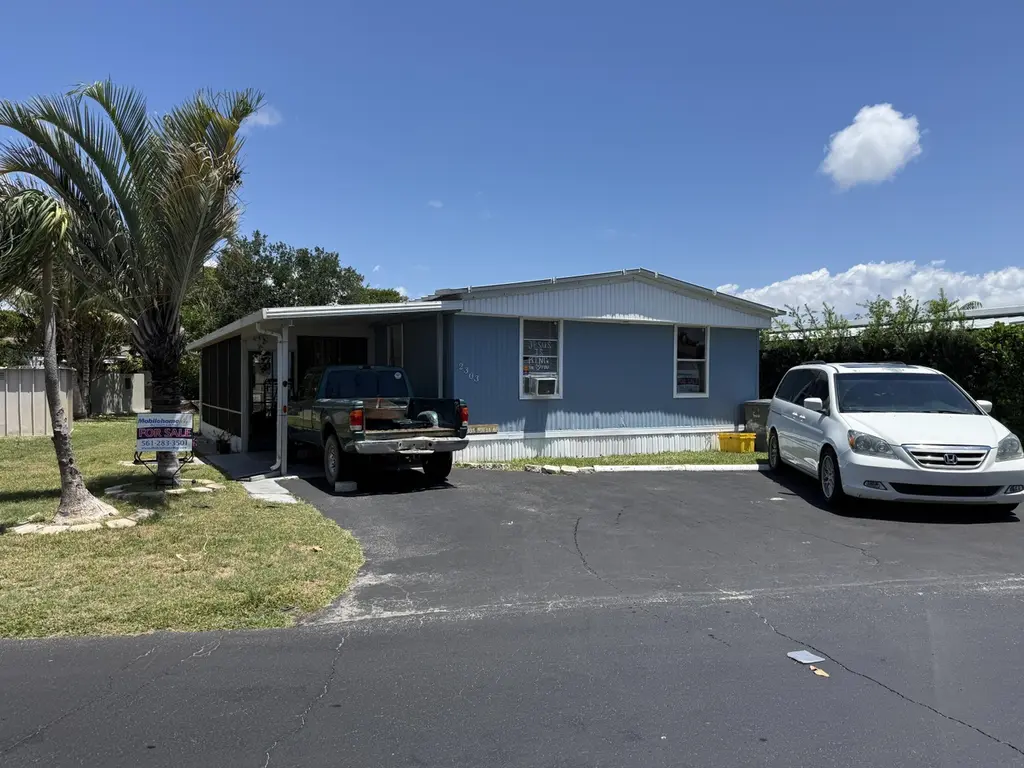
2303 NW 14th Ave #534 · Boynton Beach, FL
Flood risk 1/10 · Minimal
- FEMA flood zone
- X (unshaded)
- Chance of flooding over 30 yrs
- 0.0%
- Est. flood insurance / yr
- $507 – $1,088
Fire risk 1/10 · Minimal
- Est. fire insurance / yr
- $947 – $1,759
Heat risk 10/10 · Severe
- Hot days now (above 105°F)
- 7 days/yr
- Hot days in 30 yrs
- 27 days/yr
Wind risk 10/10 · Severe
- Chance of severe wind over 30 yrs
- 99.0%
Air-quality risk 2/10 · Minimal
- Unhealthy air days now
- 1 days/yr
- Unhealthy air days in 30 yrs
- 2 days/yr
Risk factors via First Street. Map © Google.
Why this score? — see what drove the B grade
The composite is a weighted blend of 9 inputs, each scored 0–100. Each bar is that input's sub-score; the figure is the points it added to the 100-point composite (weight × sub-score).
- Cash flow +29.5/30.0
- 1% rule +10.0/10.0
- DSCR +10.0/10.0
- ARV discount +7.5/15.0
- Schools +4.3/10.0
- Condition / age +4.0/5.0
- Livability +3.6/5.0
- Rent growth +2.4/5.0
- Appreciation +0.0/10.0
$84,900
🖨 Deal sheet 📄 Offer letter ✓ Due diligence
Listing remarks
Charming remodeled mobile home featuring 3BR/2BA, All age, -Sand and Sea, a Beautiful kitchen, laundry room, renovated kitchen, and a spacious, breezy porch perfect for relaxing with modern finishes. Perfect for creating memories. This is a rare opportunity to own a home that truly has it all!. Enjoy the community amenities. All measurements are approximate. This property is available for purchase with Financing or Cash. Call the listing agent today to schedule your private tour.
Key facts
- Community amenities
- Renovated kitchen
- 2 garage spots
Tags
Property features AI
Finance
- Financial info: Pets allowed with possible breed restrictions
- HOA & community: Association with amenities including pool, dog park, parking and sidewalks; Association fee paid monthly; Association fee includes grounds maintenance and sewer
Exterior
- Parking: 3 total parking spaces; 2-space garage; 1-space carport; Attached carport and detached garage
- Utilities: Public water; Public sewer; Electricity connected; Natural gas available; Cable available
- Home design: Single-story mobile home; Faces northeast; Resale condition
- Construction: Aluminum siding; Metal siding; Metal frame construction; Built with metal and aluminum roof
- Exterior features: Not waterfront; Aluminum and metal roofing
Interior
- Kitchen: Electric range, microwave, refrigerator
- Bedrooms: No main-level bedrooms listed
- Flooring: Ceramic tile; Vinyl
- Bathrooms: 2 full bathrooms
- Heating & cooling: Wall/window cooling units
- Interior features: Electric range, microwave, refrigerator; Ceramic tile and vinyl flooring
Neighborhood map
What this means for you Summary
Snapshot
- This is a 3-bed/2.0-bath manufactured listed at $85k. Condition is rated good.
Deal economics
- At list price, monthly cash flow is $303 ($4k/yr) — positive.
- The deal already cash-flows at list — no discount required.
- Meets the 1% rule at list price ($3k rent vs $85k).
- Recommended offer: $84k (1.5% below list) — sets the bar for market timing.
- Cap rate 10.6% vs local median 4.3% in Boynton Beach — top-decile yield for the area; either an underpriced asset or a hidden risk that comps aren't pricing in. Stress-test before assuming the spread holds.
Location & tenants
- Location reads 72/100 on livability (#351 in FL) — a middle-class / working-renter tenant base. Strengths: housing A+, health & safety B+, cost of living B; Watch: amenities D+, crime D-, commute F.
- Palm Beach (suburban): math 46% / reading 53% proficiency, ranked #34 of 73 in FL (top 47%) — families likely to look elsewhere, expect single-tenant / working-renter base with shorter leases.
- Zoned schools: Citrus Cove Elementary School (math 47% / reading 57%, grade C-, #990 of 2,144 statewide, top 48%, 1,026 students, 59% FRL); Congress Community Middle School (math 21% / reading 28%, grade F, #522 of 571 statewide, top 93%, 988 students, 72% FRL); Boynton Beach Community High (math 13% / reading 25%, grade F, #565 of 667 statewide, top 85%, 1,547 students, 65% FRL).
- Zoned-school proficiency averages 32% at this address vs 50% district-wide (-18 pts) — the specific schools serving this property underperform the Palm Beach average; the district grade overstates school quality for this exact location.
- Market conditions: Rents soft (-0.6%/yr); 445 active listings in the ZIP; 40 comparable units currently listed for rent nearby; rentals at typical pace (median 17d on market — plan ~3-4 weeks tenant-placement turnaround); solid renter incomes; 3,974 units permitted in Palm Beach County in 2024 (1,012 in 5+ unit buildings).
- This rent runs 42% of the median local income ($76k/yr) — at the standard rent-burdened threshold; future hikes will face affordability resistance.
Forward outlook
- Local home prices are declining (-3.0%/yr); year-one equity from $587 of loan paydown is wiped out by about $3k of value loss. Plan a longer hold.
- Palm Beach County population projected at +30% by 2050 — long-run rental-demand tailwind backs the buy-and-hold thesis.
Negotiation context
- It's been on market 26 days — a 2% lower offer ($84k) is reasonable based on typical stale-listing flexibility.
Risks & watch-outs
- Watch-outs: HOA is 45% of rent.
- Climate carrying-cost: severe wind risk, 99% chance of damaging wind over 30y; extreme-heat days projected 7→27/yr by 2055 (HVAC capex compounding) — expect insurance premiums to compound above CPI over the hold.
Questions for the listing agent
- Built in 1979 — when were the roof, HVAC, electrical panel, plumbing, and water heater last replaced?
- What does the HOA fee cover, when was the last increase, and are there any pending special assessments or reserve-fund shortfalls?
- Is there a deadline driving the sale (1031 exchange, divorce, estate, relocation)? That informs how much negotiation room exists.
- Crime grade is D in this area — have there been break-ins, vandalism, or insurance claims at this property in the last 3 years? What carrier currently insures it and at what premium?
- What's the average days-on-market for RENTAL listings here right now (not sales)? A rising rental-DOM trend means longer vacancies and softer asking-rent achievability than the comps imply.
- What's the recent tenant-quality profile in this submarket — average credit score on applications, eviction rate, late-payment / NSF rate, and stable-employment percentage? A property-management company in the area should have these aggregated.
- How much new for-sale + rental construction is in the pipeline within 1–3 miles? Heavy new supply typically softens prices + rents 12–24 months out; constrained supply supports both.
Investment metrics
- 1% rule
- 3.12% ✓
- Cap rate
- 10.57%
- Cash-on-cash
- 15.28%
- DSCR
- 1.68
- GRM
- 2.7
CMA / ARV
No comps found within radius.
Projected returns pro-forma
-3.0% appreciation · 0.0% rent growth · sell at horizon
- IRR
- -1.7%
- Equity multiple
- 0.94×
- Total profit
- $-1,449
- Equity at exit
- $12,659
- IRR
- -3.1%
- Equity multiple
- 0.86×
- Total profit
- $-3,229
- Equity at exit
- $7,341
Cash invested: $23,772 (down + closing). Projections, not guarantees.
Landlord ↔ Tenant lean methodology
- Overall (STATE)
- 87 Strongly Landlord-Friendly
- State Florida
- 87 Strongly Landlord-Friendly · R+3
- County
- — inherits STATE
- City
- — inherits STATE
ZIP-level market 33436
- Home prices YoY
- -26.0%
- Rents YoY
- -0.6%
- Active inventory
- 445
- Price-to-rent
- 2.7×
Monthly cashflow live
- Estimated rent
- $2,645 high interval (Pro) →
- Mortgage (P&I)
- −$445
- Tax est. 1.5%
- −$106 /mo · $1,274/yr
- Insurance
- −$35
- HOA
- −$1,200
- Vacancy / Maint / Mgmt
- −$555
- Net cashflow
- $303
Break-even live
UW: 25.0% down · 7.5% · 30yr · 1.5% tax · 5.0% vac · 8.0% maint · 8.0% mgmt
Financing live
Cash to close
- Down payment
- $21,225
- Closing costs
- $2,547
- Reserves months
- —
- Total cash needed
- —
Loan-product check · same deal, 3 products live
Conventional
25% down · 7.5% · 30yr
- Down + closing
- —
- Monthly P&I
- —
- Monthly cashflow
- —
- DSCR
- —
- Eligible?
- —
Personal DTI + credit; lowest rate.
DSCR
20% down · 8.5% · 30yr
- Down + closing
- —
- Monthly P&I
- —
- Monthly cashflow
- —
- DSCR
- —
- Eligible?
- —
No personal income docs; deal must DSCR.
Hard money
10% down · 12.0% · 12mo
- Down + closing
- —
- Monthly P&I
- —
- Monthly cashflow
- —
- DSCR
- —
- Eligible?
- —
Short-term bridge; refi at stabilization.
Rent comps 40 comps
| Address | Beds | Baths | Sqft | Rent | $/sqft | DOM | Units | Dist |
|---|---|---|---|---|---|---|---|---|
| 220 Savannah Lakes Dr Boynton Beach, FL | 2.0 | 2.0 | 1098 | $2,365 | $2.15 | 3d | 1 | 0.26mi |
| 3736 Coelebs Ave Boynton Beach, FL | 3.0 | 2.0 | 1232 | $3,000 | $2.44 | 24d | 1 | 0.34mi |
| 3561 Oberon Ave Boynton Beach, FL | 3.0 | 2.0 | 1248 | $2,850 | $2.28 | 20d | 1 | 0.39mi |
| 3500 Sandpiper Dr Boynton Beach, FL | 1.0–2.0 | 1.0–2.0 | 1147 | $2,579 | $2.25 | 22d | 22 | 0.43mi |
| 2 Renaissance Way #305 Boynton Beach, FL | 3.0 | 2.0 | 1367 | $3,200 | $2.34 | 3d | 1 | 0.48mi |
| 2401 Renaissance Way Boynton Beach, FL | 2.0 | 2.0 | 1048 | $2,400 | $2.29 | 24d | 1 | 0.48mi |
| 4408 Renaissance Way Boynton Beach, FL | 2.0 | 2.0 | 1048 | $2,350 | $2.24 | 12d | 1 | 0.48mi |
| 4408 Renaissance Way Unit 408 Boynton Beach, FL | 2.0 | 2.0 | 1048 | $2,350 | $2.24 | 17d | 1 | 0.48mi |
| 3308 Renaissance Way Boynton Beach, FL | 2.0 | 2.0 | 1119 | $2,300 | $2.06 | 5d | 1 | 0.48mi |
| 920 Sun Acres Ln Boynton Beach, FL | 2.0 | 2.0 | 1352 | $2,200 | $1.63 | 24d | 1 | 0.51mi |
| 1100 Audace Ave Boynton Beach, FL | 1.0–3.0 | 1.0–2.0 | 1063 | $2,970 | $2.79 | 2d | 24 | 0.54mi |
| 1701 Renaissance Commons Blvd Boynton Beach, FL | 1.0–2.0 | 1.0–2.0 | 846 | $2,912 | $3.44 | 1d | 1 | 0.54mi |
| 1701 Renaissance Commons Blvd Boynton Beach, FL | 2.0 | 2.0 | 922 | $2,629 | $2.85 | 11d | 1 | 0.54mi |
| 3930 Max Pl Boynton Beach, FL | 3.0 | 2.0 | 1550 | $2,825 | $1.82 | 24d | 1 | 0.55mi |
| 1605 Renaissance Commons Blvd Boynton Beach, FL | 1.0–3.0 | 1.0–2.0 | 1148 | $3,126 | $2.72 | 2d | 12 | 0.55mi |
| 4101 Mahogany Dr Boynton Beach, FL | 1.0–2.0 | 1.0–2.0 | 950 | $2,169 | $2.28 | 3d | 11 | 0.57mi |
| 3962 Winfield Rd Boynton Beach, FL | 4.0 | 2.0 | 1592 | $3,300 | $2.07 | 15d | 1 | 0.61mi |
| 3962 Winfield Rd Unit 3962 Boynton Beach, FL | 4.0 | 2.0 | 1592 | $3,300 | $2.07 | 14d | 1 | 0.61mi |
| 1660 Renaissance Commons Blvd #2122 Boynton Beach, FL | 2.0 | 2.0 | 1012 | $2,450 | $2.42 | 24d | 1 | 0.61mi |
| 1831 Renaissance Commons Blvd Boynton Beach, FL | 2.0 | 2.0 | 975 | $2,230 | $2.29 | 5d | 1 | 0.62mi |
| 1831 Renaissance Commons Blvd Boynton Beach, FL | 2.0 | 2.0 | 975 | $2,210 | $2.27 | 24d | 1 | 0.62mi |
| 2303 N Congress Ave #15 Boynton Beach, FL | 2.0 | 1.0 | 925 | $1,950 | $2.11 | 24d | 1 | 0.62mi |
| 1690 Renaissance Commons Blvd Boynton Beach, FL | 2.0 | 2.0 | 1074 | $2,275 | $2.12 | 18d | 3 | 0.63mi |
| 1690 Renaissance Commons Blvd Boynton Beach, FL | 1.0–2.0 | 1.0–2.0 | 977 | $2,350 | $2.41 | 20d | 3 | 0.63mi |
| 1690 Renaissance Commons Blvd Boynton Beach, FL | 2.0 | 2.0 | 1137 | $2,325 | $2.04 | 5d | 2 | 0.63mi |
| 1000 Audace Ave Boynton Beach, FL | 2.0 | 2.0 | 1165 | $2,800 | $2.40 | 24d | 1 | 0.64mi |
| 1660 Renaissance Commons Blvd Boynton Beach, FL | 1.0–2.0 | 1.0–2.0 | 932 | $2,450 | $2.63 | 17d | 2 | 0.64mi |
| 2305 N Congress Ave #18 Boynton Beach, FL | 3.0 | 2.0 | 1217 | $2,600 | $2.14 | 15d | 1 | 0.65mi |
| 2307 N Congress Ave #24 Boynton Beach, FL | 2.0 | 1.0 | 902 | $1,700 | $1.88 | 3d | 1 | 0.67mi |
| 9746 Nickels Blvd Boynton Beach, FL | 2.0 | 2.0 | 1215 | $2,800 | $2.30 | 24d | 1 | 0.69mi |
| 1515 Arezzo Cir Boynton Beach, FL | 2.0 | 2.5 | 1286 | $2,750 | $2.14 | 24d | 1 | 0.72mi |
| 1859 Via Granada Boynton Beach, FL | 3.0 | 3.0 | 1805 | $2,995 | $1.66 | 24d | 1 | 0.73mi |
| 2317 N Congress Ave #24 Boynton Beach, FL | 2.0 | 1.0 | 902 | $2,300 | $2.55 | 5d | 1 | 0.76mi |
| 2319 N Congress Ave #28 Boynton Beach, FL | 2.0 | 2.0 | 1172 | $1,945 | $1.66 | 7d | 1 | 0.76mi |
| 3665 Silver Lace Ln #77 Boynton Beach, FL | 3.0 | 2.5 | 1570 | $2,800 | $1.78 | 24d | 1 | 0.77mi |
| 1620 Cetona Dr Boynton Beach, FL | 4.0 | 2.0 | 1681 | $3,200 | $1.90 | 24d | 1 | 0.79mi |
| 9766 Kamena Cir Boynton Beach, FL | 3.0 | 2.5 | 1596 | $3,300 | $2.07 | 5d | 1 | 0.81mi |
| 8949 Oak St Boynton Beach, FL | 2.0 | 2.0 | 1040 | $1,300 | $1.25 | 24d | 1 | 0.82mi |
| 600 Sealofts Dr Boynton Beach, FL | 1.0–3.0 | 1.0–2.5 | 1217 | $3,535 | $2.90 | 1d | 17 | 0.83mi |
| 600 Sealofts Dr Boynton Beach, FL | 2.0 | 2.0 | 1066 | $2,716 | $2.55 | 3d | 1 | 0.83mi |
HOA detail
- Monthly dues
- $1,200 · $14,400/yr
Listing history 14 events
-
2026-06-18days on market $84,900 Active 26 DOM
-
2026-06-17days on market $84,900 Active 25 DOM
-
2026-06-16days on market $84,900 Active 24 DOM
-
2026-06-15days on market $84,900 Active 23 DOM
-
2026-06-13days on market $84,900 Active 21 DOM
-
2026-06-09days on market $84,900 Active 17 DOM
-
2026-06-08days on market $84,900 Active 16 DOM
-
2026-06-07days on market $84,900 Active 15 DOM
-
2026-06-04days on market $84,900 Active 12 DOM
-
2026-06-03days on market $84,900 Active 11 DOM
-
2026-06-02days on market $84,900 Active 10 DOM
-
2026-06-01days on market $84,900 Active 9 DOM
-
2026-05-31days on market $84,900 Active 8 DOM
-
2026-05-23$84,900 Active
ⓘ Source: listings_history table (triggers on properties + properties_extension) + one-shot
backfill from property_details.listing_events for pre-trigger history.
Climate risk First Street
- Flood 1/10 Low FEMA zone X (unshaded) · 0% chance over 30 yrs
- Wildfire 1/10 Low
- Heat 10/10 Extreme 7 d/yr ≥105°F today · 27 d/yr by 30 yrs out
- Wind 10/10 Extreme 99% chance of damaging wind over 30 yrs
- Air quality 2/10 Low 1 unhealthy d/yr today · 2 by 30 yrs out
Nearby sold comps map
Loading sold comps map…
Walkable amenities ~0.75 mi
Loading nearby amenities…
Taxation est. · year 1
- Rental income
- $31,739
- − Mortgage interest
- −$4,756
- − Property taxes
- −$1,274
- − Insurance
- −$424
- − Repairs & maintenance
- −$2,539
- − Management
- −$2,539
- − HOA
- −$14,400
- − Depreciation
- −$2,470
- Taxable income
- $3,337
- Est. tax owed @ 24.0%
- −$801
- After-tax cash flow
- $2,832/yr
For passive investors: Depreciation is non-cash, so a rental often shows a tax loss while cash-flowing — sheltering income. Rental losses are passive: they offset passive income freely, and up to $25,000/yr can offset ordinary (W-2) income if you actively participate and your MAGI is under $100k (phasing out to $0 by $150k); unused losses carry forward. On sale, claimed depreciation is recaptured at up to 25%, and gains may owe capital-gains tax (a 1031 exchange can defer both). Figures are a year-1 estimate at your 24.0% rate — not tax advice; consult a CPA.
Condition & rehab AI · 23 photos
This remodeled mobile home is in good condition with modern finishes and a spacious porch, making it a great investment opportunity.
Value-add opportunities
- Both landscaping — enhances curb appeal and adds value
- Both painting — refreshes the interior and exterior
- Resale upgrading appliances — attracts more buyers
- Resale upgrading fixtures — attracts more buyers
Renovation cost estimate screening
Value-add ROI direction
- Both landscaping — enhances curb appeal and adds value ↑
- Both painting — refreshes the interior and exterior ↑
- Resale upgrading appliances — attracts more buyers ↑
- Resale upgrading fixtures — attracts more buyers ↑
ⓘ Cost ranges are severity-bucket heuristics (US national rule-of-thumb). Get contractor quotes + a written scope before underwriting a rehab budget.
Schools (NCES district)
- District
- Palm Beach
- NCES district ID
- 1201500
- Math proficiency
- 46% ▼ -16.00%
- Reading proficiency
- 53% ▼ -4.00%
- Median HH income
- $53,943
- Composite
- 42.72/100
- National rank
- #3160
- State rank
- #34 of 73 in FL
Livability — Boynton Beach
- Score
- 72/100
- State rank
- #351
- US rank
- #6098
Category grades
Schools grade is shown separately in the Schools card above.
Census & demographics
- County
- Palm Beach County · 1,438,312 people
- City population
- 148,060
- Metro
- Miami-Fort Lauderdale-Pompano Beach, FL
- Population (ZIP)
- 48,743
- Household income
- $75,789
- Rent vs Own
- Severe rent burden
- 1813.0
Population outlook (Palm Beach County) Hauer SSP2
- Today (2025)
- 1,637,487 people
- By 2030
- 1,743,255 · +6.5%
- By 2040
- 1,948,712 · +19.0%
- By 2050
- 2,132,979 · +30.3%
- By 2075
- 2,530,027 · +54.5%
- By 2100
- 2,706,979 · +65.3%
Race, ethnicity, and origin ACS 2023
- Neighborhood character
- Diverse neighborhood (Simpson 0.64)
- Race & ethnicity
- White 52% Black 24% Hispanic / Latino 19% Two or more races 10% Asian 2%
- Hispanic origin (detail)
- Mexican 2% Puerto Rican 4% Cuban 3% Dominican 1%
- Common ancestry
- Hispanic 12% Romanian 3% Scotch-Irish 2%
- Foreign-born
- 27% · Canada, Jamaica, Vietnam
- Languages at home
- 64% English-only · Spanish 14% French/Haitian/Cajun 13% Other Indo-European 2%
Political lean MEDSL · Palm Beach
- 2024 margin
- Toss-up / Even · D 50.0% · R 49.2%
- 2008→2024 swing
- -22.1pp toward R · 2008: 22.9pp · 2024: 0.8pp
- All cycles
- 2024: D+0.8 2020: D+12.8 2016: D+15.3 2012: D+17.0 2008: D+22.9
Not yet ingested
- Civics
- —
Market trends
- HPI YoY
- ▼ -109.59%
- Current HPI
- 311.7742
- Rent YoY
- ▼ -0.57%
- Metro
- Miami-Fort Lauderdale-Pompano Beach, FL
- State GDP YoY
- ▲ 3.28%
- F500 in state
- 36
Industry mix (Fortune 500 HQ in FL)
| Industry | F500 HQs | Revenue |
|---|---|---|
| Industrial Technology | 2 | $29B |
|
||
| Insurance | 2 | $17B |
|
||
| Retail | 1 | $60B |
|
||
| Technology Distribution | 1 | $58B |
|
||
| Homebuilding | 1 | $35B |
|
||
| Technology Manufacturing | 1 | $35B |
|
||
Price history
1 event — show timeline
- 2026-05-23 Listed $84,900 Beaches MLS
Cash-flow waterfall
monthlySold comps — $/sqft
last 12 mo · ≤1 miLoading sold comps…