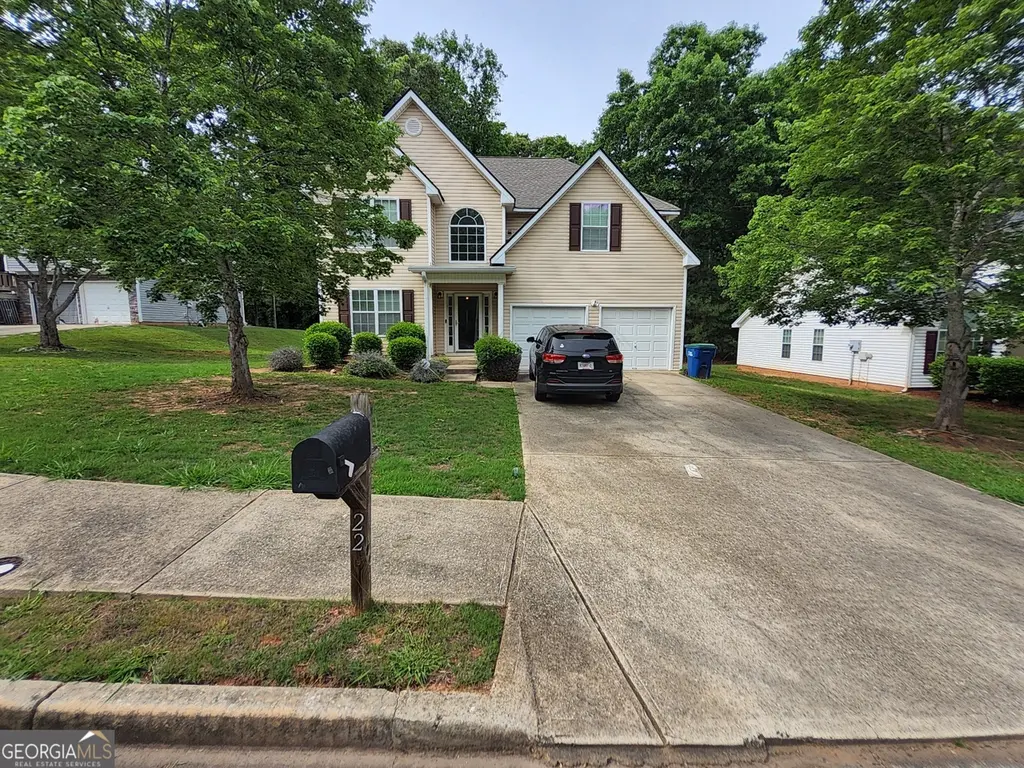
220 Laura Cir · South Fulton, GA
Flood risk 1/10 · Minimal
- FEMA flood zone
- X (unshaded)
- Chance of flooding over 30 yrs
- 0.0%
- Est. flood insurance / yr
- $507 – $1,088
Fire risk 2/10 · Minimal
- Est. fire insurance / yr
- $963 – $1,789
Heat risk 6/10 · Moderate
- Hot days now (above 104°F)
- 7 days/yr
- Hot days in 30 yrs
- 19 days/yr
Wind risk 6/10 · Moderate
- Chance of severe wind over 30 yrs
- 27.0%
Air-quality risk 4/10 · Minor
- Unhealthy air days now
- 4 days/yr
- Unhealthy air days in 30 yrs
- 6 days/yr
Risk factors via First Street. Map © Google.
Why this score? — see what drove the C+ grade
The composite is a weighted blend of 9 inputs, each scored 0–100. Each bar is that input's sub-score; the figure is the points it added to the 100-point composite (weight × sub-score).
- Cash flow +16.8/30.0
- ARV discount +12.5/15.0
- Appreciation +10.0/10.0
- DSCR +5.2/10.0
- Schools +4.5/10.0
- 1% rule +3.6/10.0
- Rent growth +2.7/5.0
- Livability +2.5/5.0
- Condition / age +2.5/5.0
$255,000
🖨 Deal sheet 📄 Offer letter ✓ Due diligence
Listing remarks
Beautiful 4-bedroom, 2.5-bath home offering 2,095 sq ft of comfortable living space in College Park. This well-maintained property features a new roof installed in 2025, HVAC updated in 2023-2024, and fully renovated bathrooms completed in 2022. Enjoy a spacious layout perfect for everyday living and entertaining. Plumbing and electrical systems are in great condition with no known issues. Conveniently located near shopping, dining, and major highways. Property sold AS-IS.
Key facts
- Renovated bathrooms
- Updated hvac
- New roof
Tags
Property features AI
Finance
- Other: Property located in Fulton County, GA; Lot is approximately 0.182 acres
- HOA & community: No HOA
Exterior
- Parking: Attached garage with space for 2 vehicles
- Utilities: Public water; Public sewer; Sewer and water available
- Home design: Single-family residence; House; Two levels; Resale property
- Construction: Built in 2005; Wood siding; Composition roof; No basement
- Exterior features: Level lot
Interior
- Kitchen: No appliances included
- Bedrooms: 4 bedrooms
- Flooring: Carpet; Tile
- Bathrooms: 2 full bathrooms; 1 half bathroom; Lower level contains 1 full bathroom
- Heating & cooling: Electric forced-air heating; Central air conditioning
- Interior features: High ceilings; One fireplace
- Laundry & utility: Laundry closet
Neighborhood map
What this means for you Summary
Snapshot
- This is a 3-bed/2.5-bath single-family listed at $255k.
Deal economics
- At list price, monthly cash flow is $163 ($2k/yr) — positive.
- The deal already cash-flows at list — no discount required.
- To meet the 1% rule (rent ≥ 1% of price), the offer needs to be $219k (14.0% below list).
- Recommended offer: $219k (14.0% below list) — sets the bar for 1% rule.
- Cap rate 7.1% vs local median 4.6% in South Fulton — top-decile yield for the area; either an underpriced asset or a hidden risk that comps aren't pricing in. Stress-test before assuming the spread holds.
Location & tenants
- Location reads: area grade C — affects rentability + tenant quality, not the cash-flow math above.
- Fulton County (suburban): math 49% / reading 53% proficiency, ranked #12 of 174 in GA (top 7%) — acceptable for families but not a draw, mixed tenant base, ~2y average lease.
- Zoned schools: Camp Creek Middle School (math 17% / reading 32%, grade F, #301 of 470 statewide, top 66%, 644 students, 100% FRL); Langston Hughes High School (math 8% / reading 17%, grade F, #336 of 424 statewide, top 80%, 1,964 students, 65% FRL) — zoned schools average 82% FRL vs 41% district-wide (41 pts higher); higher-poverty schools than district average — tighter screening recommended.
- Zoned-school proficiency averages 18% at this address vs 51% district-wide (-33 pts) — the specific schools serving this property underperform the Fulton County average; the district grade overstates school quality for this exact location.
- Market conditions: Rents flat; 651 active listings in the ZIP; 20 comparable units currently listed for rent nearby; rentals at typical pace (median 22d on market — plan ~3-4 weeks tenant-placement turnaround); 11,565 units permitted in Fulton County in 2024 (8,159 in 5+ unit buildings).
- This rent runs 39% of the median local income ($67k/yr) — at the standard rent-burdened threshold; future hikes will face affordability resistance.
Forward outlook
- In year one you build about $27k of equity ($2k loan paydown + $26k appreciation (10.0% local appreciation)).
- Fulton County population projected at +38% by 2050 — long-run rental-demand tailwind backs the buy-and-hold thesis.
- At projected returns (10.0% appreciation + 0.9% rent growth), your $71k cash investment doubles in ~3 years — after that, you're playing with house money.
- By year 2, paydown + projected appreciation supports a ~$44k cash-out refi (75% LTV) — recoverable capital for the next deal without selling this one.
Negotiation context
- It's been on market 25 days — a 2% lower offer ($251k) is reasonable based on typical stale-listing flexibility.
Risks & watch-outs
- Climate carrying-cost: major wind risk, 27% chance of damaging wind over 30y; extreme-heat days projected 7→19/yr by 2055 (HVAC capex compounding) — expect insurance premiums to compound above CPI over the hold.
Questions for the listing agent
- Is there a deadline driving the sale (1031 exchange, divorce, estate, relocation)? That informs how much negotiation room exists.
- What's the average days-on-market for RENTAL listings here right now (not sales)? A rising rental-DOM trend means longer vacancies and softer asking-rent achievability than the comps imply.
- What's the recent tenant-quality profile in this submarket — average credit score on applications, eviction rate, late-payment / NSF rate, and stable-employment percentage? A property-management company in the area should have these aggregated.
- How much new for-sale + rental construction is in the pipeline within 1–3 miles? Heavy new supply typically softens prices + rents 12–24 months out; constrained supply supports both.
Investment metrics
- 1% rule
- 0.86% ✗
- Cap rate
- 7.06%
- Cash-on-cash
- 2.74%
- DSCR
- 1.12
- GRM
- 9.7
CMA / ARV
- ARV (on-the-fly)
- $287,015
- Comps found
- 4
Show comp detail 4 sales within ~0.75 mi
| Address | Dist | Beds/Ba | Sqft | Sold | Price | $/sf | Match |
|---|---|---|---|---|---|---|---|
| 4232 Kensington Cv | 0.08mi | 4/2.5 (+1) | 2,142 (+2%) | 7mo | $190,000 | $89 | 82 |
| 225 Laura Cir | 0.03mi | 4/2.5 (+1) | 1,888 (-10%) | 2mo | $235,000 | $124 | 76 |
| 4145 Morning Trl | 0.19mi | 3/2.5 | 1,788 (-15%) | 7mo | $270,000 | $151 | 61 |
| 4811 Westgate Blvd | 0.70mi | 4/2.5 (+1) | 2,074 (-1%) | 12mo | $285,000 | $137 | 51 |
Match score weights: distance 35% · size 25% · config 20% · recency 20%. Top-matched comps best support the ARV.
Projected returns pro-forma
10.0% appreciation · 0.95% rent growth · sell at horizon
- IRR
- 25.6%
- Equity multiple
- 3.03×
- Total profit
- $144,747
- Equity at exit
- $229,724
- IRR
- 22.0%
- Equity multiple
- 6.74×
- Total profit
- $409,653
- Equity at exit
- $495,409
Cash invested: $71,400 (down + closing). Projections, not guarantees.
Landlord ↔ Tenant lean methodology
- Overall (STATE)
- 90 Strongly Landlord-Friendly
- State Georgia
- 90 Strongly Landlord-Friendly · R+3
- County
- — inherits STATE
- City
- — inherits STATE
ZIP-level market 30349
- Home prices YoY
- 4.6%
- Rents YoY
- 0.9%
- Active inventory
- 651
- Price-to-rent
- 9.7×
Monthly cashflow live
- Estimated rent
- $2,194 high interval (Pro) →
- Mortgage (P&I)
- −$1,337
- Tax from tax record
- −$127 /mo · $1,519/yr
- Insurance
- −$106
- HOA
- −$0
- Vacancy / Maint / Mgmt
- −$461
- Net cashflow
- $163
Break-even live
UW: 25.0% down · 7.5% · 30yr · 1.5% tax · 5.0% vac · 8.0% maint · 8.0% mgmt
Financing live
Cash to close
- Down payment
- $63,750
- Closing costs
- $7,650
- Reserves months
- —
- Total cash needed
- —
Loan-product check · same deal, 3 products live
Conventional
25% down · 7.5% · 30yr
- Down + closing
- —
- Monthly P&I
- —
- Monthly cashflow
- —
- DSCR
- —
- Eligible?
- —
Personal DTI + credit; lowest rate.
DSCR
20% down · 8.5% · 30yr
- Down + closing
- —
- Monthly P&I
- —
- Monthly cashflow
- —
- DSCR
- —
- Eligible?
- —
No personal income docs; deal must DSCR.
Hard money
10% down · 12.0% · 12mo
- Down + closing
- —
- Monthly P&I
- —
- Monthly cashflow
- —
- DSCR
- —
- Eligible?
- —
Short-term bridge; refi at stabilization.
Rent comps 20 comps
| Address | Beds | Baths | Sqft | Rent | $/sqft | DOM | Units | Dist |
|---|---|---|---|---|---|---|---|---|
| 4253 Kensington Cv Atlanta, GA | 4.0 | 2.5 | 2695 | $2,415 | $0.90 | 22d | 1 | 0.08mi |
| 435 Skif Pond Ct Atlanta, GA | 4.0 | 3.0 | 1567 | $2,273 | $1.45 | 20d | 1 | 0.15mi |
| 4910 Heritage Cir Atlanta, GA | 4.0 | 2.0 | 2229 | $2,355 | $1.06 | 24d | 1 | 0.75mi |
| 4569 Parkway Cir Atlanta, GA | 3.0 | 2.5 | 1622 | $2,150 | $1.33 | 43d | 1 | 0.84mi |
| 4561 Parkway Cir Atlanta, GA | 3.0 | 2.5 | 1773 | $1,950 | $1.10 | 5d | 1 | 0.85mi |
| 4683 Highpoint Way Atlanta, GA | 3.0 | 2.5 | 1575 | $1,885 | $1.20 | 24d | 1 | 0.86mi |
| 4595 Blazing Trl Atlanta, GA | 4.0 | 2.5 | 2248 | $2,650 | $1.18 | 43d | 1 | 0.86mi |
| 5100 Welcome All Rd SW Atlanta, GA | 1.0–3.0 | 1.0–2.5 | 1057 | $1,600 | $1.51 | 5d | 5 | 0.87mi |
| 4779 Highpoint Way College Park, GA | 4.0 | 2.5 | 1950 | $2,201 | $1.13 | 5d | 1 | 0.87mi |
| 4761 Highpoint Way #139 Atlanta, GA | 3.0 | 2.5 | 1670 | $2,500 | $1.50 | 5d | 1 | 0.90mi |
| 4209 Legacy Sq Atlanta, GA | 3.0 | 2.5 | 1520 | $1,750 | $1.15 | 43d | 1 | 0.90mi |
| 3730 Las Olas Dr Atlanta, GA | 3.0 | 2.5 | 1533 | $2,100 | $1.37 | 43d | 1 | 0.90mi |
| 3740 Will Lee Rd Atlanta, GA | 3.0 | 2.0 | 1542 | $2,010 | $1.30 | 18d | 1 | 0.91mi |
| 3730 Will Lee Rd Atlanta, GA | 3.0 | 2.0 | 1462 | $1,939 | $1.33 | 5d | 1 | 0.93mi |
| 4709 Tradition Pkwy #2 Atlanta, GA | 4.0 | 2.5 | 1868 | $2,200 | $1.18 | 43d | 1 | 0.95mi |
| 479 Thistle Cv Atlanta, GA | 3.0 | 2.0 | 1694 | $1,785 | $1.05 | 43d | 1 | 1.06mi |
| 3635 Las Olas Dr Atlanta, GA | 3.0 | 2.5 | 1788 | $1,599 | $0.89 | 12d | 1 | 1.06mi |
| 5051 Larkspur Ln Atlanta, GA | 3.0 | 2.0 | 1403 | $1,885 | $1.34 | 5d | 1 | 1.28mi |
| 4040 Alveston Dr Atlanta, GA | 4.0 | 2.5 | 2440 | $2,500 | $1.02 | 18d | 1 | 1.40mi |
| 4813 Brookwood Pl Atlanta, GA | 3.0 | 2.5 | 1624 | $2,075 | $1.28 | 43d | 1 | 1.46mi |
Listing history 12 events
-
2026-06-17status $255,000 Under Contract 25 DOM
-
2026-06-17statusdays on market $255,000 Active 25 DOM
-
2026-06-16days on market $255,000 Price Change 24 DOM
-
2026-06-15pricestatusdays on market $255,000 Price Change 23 DOM
-
2026-06-13days on market $260,000 Active 21 DOM
-
2026-06-09days on market $260,000 Active 17 DOM
-
2026-06-08days on market $260,000 Active 16 DOM
-
2026-06-07statusdays on market $260,000 Active 15 DOM
-
2026-06-03statusdays on market $260,000 Under Contract 12 DOM
-
2026-06-01days on market $260,000 New 11 DOM
-
2026-05-31days on market $260,000 New 10 DOM
-
2026-05-21$260,000 New
ⓘ Source: listings_history table (triggers on properties + properties_extension) + one-shot
backfill from property_details.listing_events for pre-trigger history.
Tax reassessment forecast GA · Resets to sale price
- Current annual tax
- $1,519 · $127/mo
- Projected year-2 tax
- $2,346 · $196/mo
- Expected delta
- +$827/yr (+$69/mo · 54.4%)
ⓘ Screening estimate from a state-policy table — verify with the county assessor before closing.
Climate risk First Street
- Flood 1/10 Low FEMA zone X (unshaded) · 0% chance over 30 yrs
- Wildfire 2/10 Low
- Heat 6/10 Major 7 d/yr ≥104°F today · 19 d/yr by 30 yrs out
- Wind 6/10 Major 27% chance of damaging wind over 30 yrs
- Air quality 4/10 Moderate 4 unhealthy d/yr today · 6 by 30 yrs out
Nearby sold comps map
Loading sold comps map…
Walkable amenities ~0.75 mi
Loading nearby amenities…
Taxation est. · year 1
- Rental income
- $26,327
- − Mortgage interest
- −$14,284
- − Property taxes
- −$1,519
- − Insurance
- −$1,275
- − Repairs & maintenance
- −$2,106
- − Management
- −$2,106
- − Depreciation
- −$7,418
- Taxable loss
- −$2,382
- Est. tax savings @ 24.0%
- +$572
- After-tax cash flow
- $2,529/yr
For passive investors: Depreciation is non-cash, so a rental often shows a tax loss while cash-flowing — sheltering income. Rental losses are passive: they offset passive income freely, and up to $25,000/yr can offset ordinary (W-2) income if you actively participate and your MAGI is under $100k (phasing out to $0 by $150k); unused losses carry forward. On sale, claimed depreciation is recaptured at up to 25%, and gains may owe capital-gains tax (a 1031 exchange can defer both). Figures are a year-1 estimate at your 24.0% rate — not tax advice; consult a CPA.
Schools (NCES district)
- District
- Fulton County
- NCES district ID
- 1302280
- Math proficiency
- 49% ▼ -2.00%
- Reading proficiency
- 53% ▬ 0.00%
- Median HH income
- $68,035
- Composite
- 45.33/100
- National rank
- #2640
- State rank
- #12 of 174 in GA
Livability — South Fulton
No livability data for this city. (Only ~50 U.S. cities are tracked.)
Census & demographics
- Census place
- South Fulton, GA
- County
- Fulton County · 1,094,430 people
- City population
- 10,694
- Metro
- Atlanta-Sandy Springs-Alpharetta, GA
- Population (ZIP)
- 79,872
- Household income
- $67,023
- Rent vs Own
- Severe rent burden
- 4258.0
Population outlook (Fulton County) Hauer SSP2
- Today (2025)
- 1,203,707 people
- By 2030
- 1,299,706 · +8.0%
- By 2040
- 1,488,256 · +23.6%
- By 2050
- 1,664,580 · +38.3%
- By 2075
- 2,036,072 · +69.2%
- By 2100
- 2,222,402 · +84.6%
Race, ethnicity, and origin ACS 2023
- Neighborhood character
- Predominantly Black (89%)
- Race & ethnicity
- Black 89% Hispanic / Latino 5% Two or more races 4% White 3%
- Foreign-born
- 9% · Canada
- Languages at home
- 88% English-only · Spanish 6% French/Haitian/Cajun 1%
Political lean MEDSL · Fulton
- 2024 margin
- Solid D (+44.9) · D 71.9% · R 27.0% · Other 1.1%
- 2008→2024 swing
- +9.8pp toward D · 2008: 35.0pp · 2024: 44.9pp
- All cycles
- 2024: D+44.9 2020: D+46.4 2016: D+42.1 2012: D+29.6 2008: D+35.0
Not yet ingested
- Civics
- —
Market trends
- HPI YoY
- ▲ 18.01%
- Current HPI
- 407.99
- Rent YoY
- ▲ 0.95%
- Metro
- Atlanta-Sandy Springs-Alpharetta, GA
- State GDP YoY
- ▲ 2.66%
- F500 in state
- 28
Industry mix (Fortune 500 HQ in GA)
| Industry | F500 HQs | Revenue |
|---|---|---|
| Paper / Packaging | 2 | $29B |
|
||
| Retail | 1 | $160B |
|
||
| Transportation / Logistics | 1 | $91B |
|
||
| Airlines | 1 | $62B |
|
||
| Consumer Goods | 1 | $47B |
|
||
| Utilities | 1 | $25B |
|
||
Price history
1 event — show timeline
- 2026-05-21 Listed $260,000 GAMLS
Property tax history
-2.3%/yrLatest (2025): $1,519 · +4.3% YoY. Source: county tax records.
Cash-flow waterfall
monthlySold comps — $/sqft
last 12 mo · ≤1 miLoading sold comps…