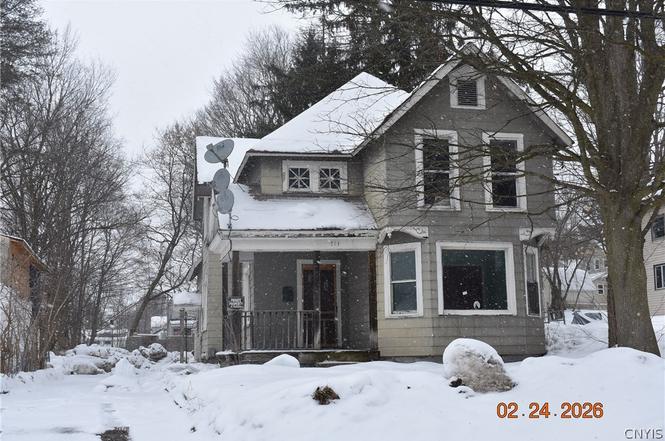
713 Oneida St · Fulton, NY
Flood risk 1/10 · Minimal
- FEMA flood zone
- X (unshaded)
- Chance of flooding over 30 yrs
- 0.0%
- Est. flood insurance / yr
- $473 – $860
Fire risk 2/10 · Minimal
- Est. fire insurance / yr
- $691 – $1,283
Heat risk 2/10 · Minimal
- Hot days now (above 95°F)
- 7 days/yr
- Hot days in 30 yrs
- 16 days/yr
Wind risk 1/10 · Minimal
- Chance of severe wind over 30 yrs
- 1.0%
Air-quality risk 2/10 · Minimal
- Unhealthy air days now
- 1 days/yr
- Unhealthy air days in 30 yrs
- 1 days/yr
Risk factors via First Street. Map © Google.
Why this score? — see what drove the B+ grade
The composite is a weighted blend of 9 inputs, each scored 0–100. Each bar is that input's sub-score; the figure is the points it added to the 100-point composite (weight × sub-score).
- Cash flow +30.0/30.0
- 1% rule +10.0/10.0
- DSCR +10.0/10.0
- Appreciation +8.4/10.0
- ARV discount +7.5/15.0
- Livability +3.1/5.0
- Schools +3.0/10.0
- Rent growth +2.5/5.0
- Condition / age +2.5/5.0
$49,900
🖨 Deal sheet 📄 Offer letter ✓ Due diligence
Listing remarks MLS
Over 2,200 square feet of living space. 4 bedrooms and two full baths. Large 2 car garage on the rear of the property. Only $19,500.
Key facts
- 4,884 sq ft lot
- Built 1940
- Listed 13 days
Neighborhood map
What this means for you Summary
Snapshot
- This is a 4-bed/2.0-bath single-family listed at $50k.
Deal economics
- At list price, monthly cash flow is $1k ($13k/yr) — positive.
- The deal already cash-flows at list — no discount required.
- Meets the 1% rule at list price ($2k rent vs $50k).
- Cap rate 33.1% vs local median 6.9% in Fulton — top-decile yield for the area; either an underpriced asset or a hidden risk that comps aren't pricing in. Stress-test before assuming the spread holds.
Location & tenants
- Location reads 61/100 on livability (#907 in NY) — a middle-class / working-renter tenant base. Strengths: cost of living A+, housing A+; Watch: employment D, schools D-, crime F.
- Fulton City School District (town): math 29% / reading 43% proficiency, ranked #554 of 590 in NY (top 94%) — families likely to look elsewhere, expect single-tenant / working-renter base with shorter leases.
- Market conditions: 115 active listings in the ZIP; 1 comparable units currently listed for rent nearby; 172 units permitted in Oswego County in 2024 (27 in 5+ unit buildings).
Forward outlook
- In year one you build about $4k of equity ($345 loan paydown + $3k appreciation (6.8% local appreciation)).
- Oswego County population projected at -23% by 2050 — secular population decline; favor cash flow + early exit over multi-decade hold.
- At projected returns (6.8% appreciation + 3.0% rent growth), your $14k cash investment doubles in ~1 year — after that, you're playing with house money.
- By year 9, paydown + projected appreciation supports a ~$34k cash-out refi (75% LTV) — recoverable capital for the next deal without selling this one.
Negotiation context
- Only 13 days on market — expect competitive offers; lowballing is unlikely to land.
- 2 sale attempts since 9y ago with the ask held roughly flat each time — persistent listings suggest the price (not the market) is what's stuck; bring a comps-based counter.
- Current owner paid $19k; list at $50k implies a 163% gain — meaningful room to come down on a strong offer.
Risks & watch-outs
- Watch-outs: built in 1940 — expect roof / HVAC / electrical / plumbing capex.
Questions for the listing agent
- Built in 1940 — when were the roof, HVAC, electrical panel, plumbing, and water heater last replaced?
- Is there a deadline driving the sale (1031 exchange, divorce, estate, relocation)? That informs how much negotiation room exists.
- Schools are D-rated, which usually means shorter tenancies and higher turnover. Who's the typical renter profile here, and what's been the actual vacancy rate?
- Crime grade is F in this area — have there been break-ins, vandalism, or insurance claims at this property in the last 3 years? What carrier currently insures it and at what premium?
- What's the average days-on-market for RENTAL listings here right now (not sales)? A rising rental-DOM trend means longer vacancies and softer asking-rent achievability than the comps imply.
- What's the recent tenant-quality profile in this submarket — average credit score on applications, eviction rate, late-payment / NSF rate, and stable-employment percentage? A property-management company in the area should have these aggregated.
- How much new for-sale + rental construction is in the pipeline within 1–3 miles? Heavy new supply typically softens prices + rents 12–24 months out; constrained supply supports both.
Investment metrics
- 1% rule
- 3.71% ✓
- Cap rate
- 33.15%
- Cash-on-cash
- 95.90%
- DSCR
- 5.27
- GRM
- 2.2
CMA / ARV
- ARV (on-the-fly)
- $179,093
- Comps found
- 10
Show comp detail 10 sales within ~0.75 mi
| Address | Dist | Beds/Ba | Sqft | Sold | Price | $/sf | Match |
|---|---|---|---|---|---|---|---|
| 608 Seneca St | 0.11mi | 4/2.0 | 1,942 (-14%) | 0mo | $149,900 | $77 | 71 |
| 413 Cayuga St | 0.27mi | 4/1.0 | 2,288 (+1%) | 15mo | $75,000 | $33 | 69 |
| 717 Oneida St | 0.01mi | 4/2.0 | 1,945 (-14%) | 24mo | $149,900 | $77 | 56 |
| 205 S 4th St | 0.44mi | 4/1.5 | 2,004 (-12%) | 8mo | $215,000 | $107 | 52 |
| 306 Academy St | 0.52mi | 4/1.5 | 2,128 (-6%) | 14mo | $220,000 | $103 | 52 |
| 515 Highland St | 0.38mi | 4/2.0 | 1,974 (-13%) | 15mo | $80,000 | $41 | 48 |
| 264 S 5th St | 0.48mi | 3/3.0 (-1) | 2,034 (-10%) | 9mo | $193,500 | $95 | 44 |
| 407 S S 4th St | 0.67mi | 4/1.5 | 2,198 (-3%) | 23mo | $205,000 | $93 | 43 |
| 406 Park St | 0.71mi | 5/2.0 (+1) | 2,028 (-10%) | 10mo | $159,900 | $79 | 36 |
| 408 S 4th St | 0.68mi | 5/2.0 (+1) | 2,576 (+14%) | 16mo | $182,470 | $71 | 27 |
Match score weights: distance 35% · size 25% · config 20% · recency 20%. Top-matched comps best support the ARV.
Projected returns pro-forma
6.75% appreciation · 3.0% rent growth · sell at horizon
- IRR
- —
- Equity multiple
- 7.28×
- Total profit
- $87,797
- Equity at exit
- $33,754
- IRR
- 99.9%
- Equity multiple
- 15.47×
- Total profit
- $202,130
- Equity at exit
- $63,383
Cash invested: $13,972 (down + closing). Projections, not guarantees.
Landlord ↔ Tenant lean methodology
- Overall (STATE)
- 15 Strongly Tenant-Friendly
- State New York
- 15 Strongly Tenant-Friendly · D+10
- County
- — inherits STATE
- City
- — inherits STATE
ZIP-level market 13069
- Home prices YoY
- 2.3%
- Active inventory
- 115
- Price-to-rent
- 2.2×
Monthly cashflow live
- Estimated rent
- $1,850 medium interval (Pro) →
- Mortgage (P&I)
- −$262
- Tax est. 1.5%
- −$62 /mo · $748/yr
- Insurance
- −$21
- HOA
- −$0
- Vacancy / Maint / Mgmt
- −$388
- Net cashflow
- $1,117
Break-even live
UW: 25.0% down · 7.5% · 30yr · 1.5% tax · 5.0% vac · 8.0% maint · 8.0% mgmt
Financing live
Cash to close
- Down payment
- $12,475
- Closing costs
- $1,497
- Reserves months
- —
- Total cash needed
- —
Loan-product check · same deal, 3 products live
Conventional
25% down · 7.5% · 30yr
- Down + closing
- —
- Monthly P&I
- —
- Monthly cashflow
- —
- DSCR
- —
- Eligible?
- —
Personal DTI + credit; lowest rate.
DSCR
20% down · 8.5% · 30yr
- Down + closing
- —
- Monthly P&I
- —
- Monthly cashflow
- —
- DSCR
- —
- Eligible?
- —
No personal income docs; deal must DSCR.
Hard money
10% down · 12.0% · 12mo
- Down + closing
- —
- Monthly P&I
- —
- Monthly cashflow
- —
- DSCR
- —
- Eligible?
- —
Short-term bridge; refi at stabilization.
Rent comps 1 comps
| Address | Beds | Baths | Sqft | Rent | $/sqft | DOM | Units | Dist |
|---|---|---|---|---|---|---|---|---|
| 303 S 5th St Fulton, NY | 4.0 | 1.5 | 1800 | $1,850 | $1.03 | 14d | 1 | 0.49mi |
Listing history 9 events
-
2026-03-13status Pending
-
2026-02-28$49,900 Active
-
2017-11-08soldstatus $19,000 Closed Sale or Rented 133-char remark
Show marketing remark (133 chars)
Over 2,200 square feet of living space. 4 bedrooms and two full baths. Large 2 car garage on the rear of the property. Only $19,500.
-
2017-10-31status Under Contract- Do Not Show 133-char remark
Show marketing remark (133 chars)
Over 2,200 square feet of living space. 4 bedrooms and two full baths. Large 2 car garage on the rear of the property. Only $19,500.
-
2017-09-15price $19,500 133-char remark
Show marketing remark (133 chars)
Over 2,200 square feet of living space. 4 bedrooms and two full baths. Large 2 car garage on the rear of the property. Only $19,500.
-
2017-06-30price $24,900 133-char remark
Show marketing remark (133 chars)
Over 2,200 square feet of living space. 4 bedrooms and two full baths. Large 2 car garage on the rear of the property. Only $19,500.
-
2017-05-10$29,900 Active 133-char remark
Show marketing remark (133 chars)
Over 2,200 square feet of living space. 4 bedrooms and two full baths. Large 2 car garage on the rear of the property. Only $19,500.
-
2007-03-30soldstatus $49,000
-
2002-03-25soldstatus $45,000
ⓘ Source: listings_history table (triggers on properties + properties_extension) + one-shot
backfill from property_details.listing_events for pre-trigger history.
Climate risk First Street
- Flood 1/10 Low FEMA zone X (unshaded) · 0% chance over 30 yrs
- Wildfire 2/10 Low
- Heat 2/10 Low 7 d/yr ≥95°F today · 16 d/yr by 30 yrs out
- Wind 1/10 Low 100% chance of damaging wind over 30 yrs
- Air quality 2/10 Low 1 unhealthy d/yr today · 1 by 30 yrs out
Nearby sold comps map
Loading sold comps map…
Walkable amenities ~0.75 mi
Loading nearby amenities…
Taxation est. · year 1
- Rental income
- $22,200
- − Mortgage interest
- −$2,795
- − Property taxes
- −$748
- − Insurance
- −$250
- − Repairs & maintenance
- −$1,776
- − Management
- −$1,776
- − Depreciation
- −$1,452
- Taxable income
- $13,403
- Est. tax owed @ 24.0%
- −$3,217
- After-tax cash flow
- $10,183/yr
For passive investors: Depreciation is non-cash, so a rental often shows a tax loss while cash-flowing — sheltering income. Rental losses are passive: they offset passive income freely, and up to $25,000/yr can offset ordinary (W-2) income if you actively participate and your MAGI is under $100k (phasing out to $0 by $150k); unused losses carry forward. On sale, claimed depreciation is recaptured at up to 25%, and gains may owe capital-gains tax (a 1031 exchange can defer both). Figures are a year-1 estimate at your 24.0% rate — not tax advice; consult a CPA.
Schools (NCES district)
- District
- Fulton City School District
- NCES district ID
- 3611700
- Math proficiency
- 29% ▼ -11.00%
- Reading proficiency
- 43% ▲ 5.00%
- Median HH income
- $43,337
- Composite
- 30.49/100
- National rank
- #6220
- State rank
- #554 of 590 in NY
Livability — Fulton
- Score
- 61/100
- State rank
- #907
- US rank
- #17723
Category grades
Schools grade is shown separately in the Schools card above.
Census & demographics
- Census place
- Fulton, NY
- Population (ZIP)
- 23,176
Population outlook (Oswego County) Hauer SSP2
- Today (2025)
- 114,465 people
- By 2030
- 109,968 · -3.9%
- By 2040
- 99,205 · -13.3%
- By 2050
- 87,979 · -23.1%
- By 2075
- 65,100 · -43.1%
- By 2100
- 47,117 · -58.8%
Race, ethnicity, and origin ACS 2023
- Neighborhood character
- Predominantly White (93%)
- Race & ethnicity
- White 93% Hispanic / Latino 4% Two or more races 3%
- Common ancestry
- Lithuanian 6% Romanian 6% Iranian 2%
- Foreign-born
- 2% · Canada
- Languages at home
- 96% English-only · Spanish 2% German/W. Germanic 1%
Political lean MEDSL · Oswego
- 2024 margin
- Strong R (+24.2) · D 37.9% · R 62.1%
- 2008→2024 swing
- -26.6pp toward R · 2008: 2.5pp · 2024: -24.2pp
- All cycles
- 2024: R+24.2 2020: R+20.2 2016: R+23.2 2012: D+7.9 2008: D+2.5
Not yet ingested
- Civics
- —
Market trends
- HPI YoY
- ▲ 6.75%
- Current HPI
- 304.443
- Rent YoY
- —
- Metro
- —
- State GDP YoY
- ▲ 2.60%
- F500 in state
- 92
Industry mix (Fortune 500 HQ in NY)
| Industry | F500 HQs | Revenue |
|---|---|---|
| Financial Services | 10 | $950B |
|
||
| Consumer Goods | 9 | $162B |
|
||
| Insurance | 4 | $225B |
|
||
| Telecommunications | 2 | $144B |
|
||
| Pharmaceuticals | 2 | $112B |
|
||
| Media / Entertainment | 2 | $69B |
|
||
Price history
+10.9% since first listed9 events — show timeline
- 2026-03-13 Pending — CNYIS
- 2026-02-28 Listed $49,900 CNYIS
- 2017-11-08 Sold (MLS) $19,000 CNYIS
- 2017-10-31 Pending — CNYIS
- 2017-09-15 Price Changed $19,500 CNYIS
- 2017-06-30 Price Changed $24,900 CNYIS
- 2017-05-10 Listed $29,900 CNYIS
- 2007-03-30 Sold (Public Records) $49,000 Public Records
- 2002-03-25 Sold (Public Records) $45,000 Public Records
Property tax history
+0.3%/yrLatest (2025): $3,703 · +2.2% YoY. Source: county tax records.
Cash-flow waterfall
monthlySold comps — $/sqft
last 12 mo · ≤1 miLoading sold comps…