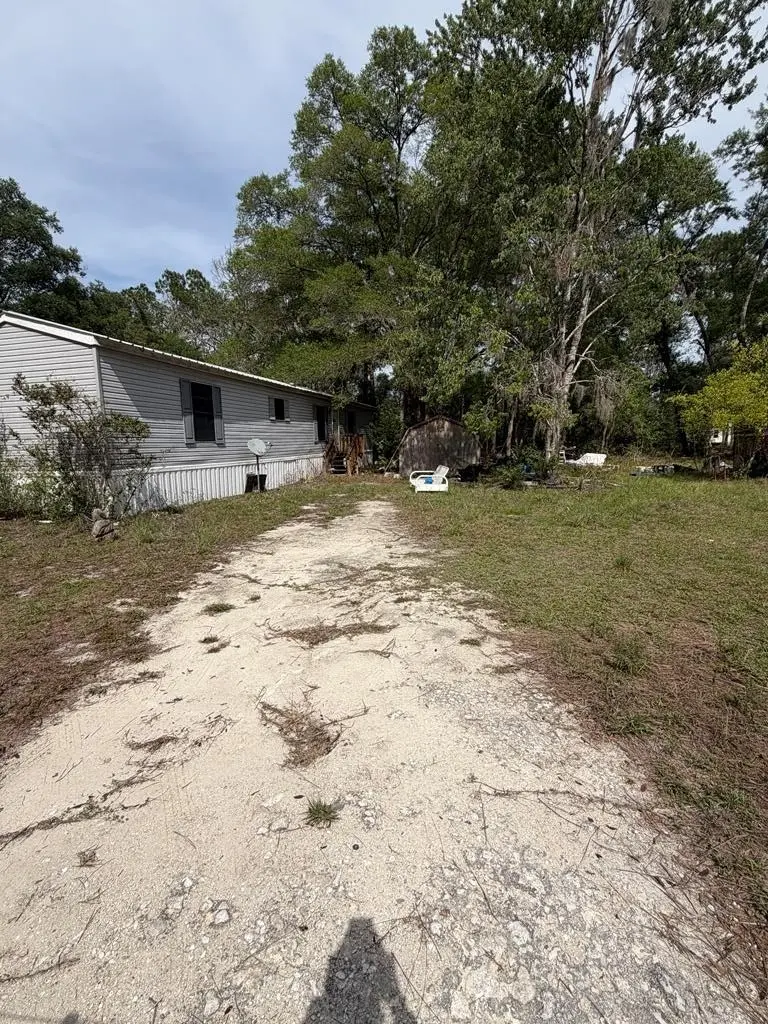
73 SE 455th St · Cross City, FL
Flood risk 1/10 · Minimal
- FEMA flood zone
- X (unshaded)
- Chance of flooding over 30 yrs
- 0.0%
- Est. flood insurance / yr
- $507 – $1,088
Fire risk 6/10 · Moderate
- Est. fire insurance / yr
- $947 – $1,759
Heat risk 8/10 · Major
- Hot days now (above 106°F)
- 7 days/yr
- Hot days in 30 yrs
- 22 days/yr
Wind risk 9/10 · Severe
- Chance of severe wind over 30 yrs
- 99.0%
Air-quality risk 2/10 · Minimal
- Unhealthy air days now
- 1 days/yr
- Unhealthy air days in 30 yrs
- 2 days/yr
Risk factors via First Street. Map © Google.
Why this score? — see what drove the C+ grade
The composite is a weighted blend of 9 inputs, each scored 0–100. Each bar is that input's sub-score; the figure is the points it added to the 100-point composite (weight × sub-score).
- Cash flow +16.8/30.0
- ARV discount +15.0/15.0
- Appreciation +10.0/10.0
- DSCR +5.2/10.0
- 1% rule +4.4/10.0
- Schools +4.2/10.0
- Livability +3.5/5.0
- Rent growth +2.5/5.0
- Condition / age +2.5/5.0
$73,500
🖨 Deal sheet (PDF) 📄 Offer letter ✓ Due diligence
Listing remarks
Opportunity awaits in the heart of Old Town! Situated on 1.1 acres, this handyman special is full of potential for the right buyer with a vision. Whether you're looking for a fixer-upper, investment property, weekend getaway, or a place to create your own slice of country living, this property offers plenty of room to make it your own. Enjoy the peaceful setting with space for boats, RVs, animals, gardens, or additional storage buildings. With no shortage of possibilities, this property is ready for someone to bring it back to life. Conveniently located just a short drive to the Suwannee River, Gulf access, and nearby springs, this is your chance to own acreage in Old Florida at an affordab
Key facts
- 1.1 acres
- Space for animals
- Space for gardens
Tags
Property features AI
Finance
- Other: Property listed with eXp Realty LLC
Exterior
- Utilities: Well water (private)
- Home design: Residential mobile home; Located in Old Town Hammock subdivision
- Construction: Vinyl siding
- Exterior features: Level, irregular-shaped lot; Located on a 1.1-acre lot; Directions: Leaving Cross City, turn right on 55A, then left on SE 97th Ave; house is at the end
Interior
- Kitchen: Refrigerator
- Flooring: Carpet; Vinyl
- Bathrooms: 2 full bathrooms
- Interior features: Refrigerator; Carpet and vinyl flooring; Crawl space basement
Neighborhood map
What this means for you Summary
Snapshot
- This is a 3-bed/2.0-bath manufactured listed at $74k.
Deal economics
- At list price, monthly cash flow is $48 ($573/yr) — positive.
- The deal already cash-flows at list — no discount required.
- To meet the 1% rule (rent ≥ 1% of price), the offer needs to be $69k (5.7% below list).
- Recommended offer: $69k (5.7% below list) — sets the bar for 1% rule.
- Cap rate 7.1% vs local median 4.0% in Cross City — top-decile yield for the area; either an underpriced asset or a hidden risk that comps aren't pricing in. Stress-test before assuming the spread holds.
Location & tenants
- Location reads 70/100 on livability (#412 in FL) — a middle-class / working-renter tenant base. Strengths: cost of living A+, housing A+, health & safety A+; Watch: amenities F, commute F, employment F.
- Dixie (rural): math 52% / reading 50% proficiency, ranked #36 of 73 in FL (top 49%) — acceptable for families but not a draw, mixed tenant base, ~2y average lease; 85% free/reduced lunch — lower-income household profile, screen leases tightly.
- Zoned schools: Old Town Elementary School (math 73% / reading 58%, grade B+, #500 of 2,144 statewide, top 24%, 456 students, 80% FRL); Ruth Rains Middle School (math 48% / reading 49%, grade C-, #274 of 571 statewide, top 50%, 431 students, 76% FRL); Dixie County High School (math 31% / reading 42%, grade F, #351 of 667 statewide, top 54%, 714 students, 70% FRL).
- Market conditions: 263 active listings in the ZIP; 1 comparable units currently listed for rent nearby; 49 units permitted in Dixie County in 2024 (0 in 5+ unit buildings).
Forward outlook
- In year one you build about $8k of equity ($508 loan paydown + $7k appreciation (10.0% local appreciation)).
- Dixie County population projected at -16% by 2050 — secular population decline; favor cash flow + early exit over multi-decade hold.
- At projected returns (10.0% appreciation + 3.0% rent growth), your $21k cash investment doubles in ~3 years — after that, you're playing with house money.
- By year 5, paydown + projected appreciation supports a ~$37k cash-out refi (75% LTV) — recoverable capital for the next deal without selling this one.
Negotiation context
- It's been on market 23 days — a 2% lower offer ($72k) is reasonable based on typical stale-listing flexibility.
Risks & watch-outs
- Climate carrying-cost: severe wind risk, 99% chance of damaging wind over 30y; major wildfire risk; extreme-heat days projected 7→22/yr by 2055 (HVAC capex compounding) — expect insurance premiums to compound above CPI over the hold.
Questions for the listing agent
- Is there a deadline driving the sale (1031 exchange, divorce, estate, relocation)? That informs how much negotiation room exists.
- What's the average days-on-market for RENTAL listings here right now (not sales)? A rising rental-DOM trend means longer vacancies and softer asking-rent achievability than the comps imply.
- What's the recent tenant-quality profile in this submarket — average credit score on applications, eviction rate, late-payment / NSF rate, and stable-employment percentage? A property-management company in the area should have these aggregated.
- How much new for-sale + rental construction is in the pipeline within 1–3 miles? Heavy new supply typically softens prices + rents 12–24 months out; constrained supply supports both.
Investment metrics
- 1% rule
- 0.94% ✗
- Cap rate
- 7.07%
- Cash-on-cash
- 2.78%
- DSCR
- 1.12
- GRM
- 8.8
CMA / ARV
- ARV (on-the-fly)
- $93,324
- Comps found
- 1
Show comp detail 1 sale within ~0.75 mi
| Address | Dist | Beds/Ba | Sqft | Sold | Price | $/sf | Match |
|---|---|---|---|---|---|---|---|
| 210 SE 460th St | 0.23mi | 2/1.0 (-1) | 888 (-4%) | 8mo | $90,000 | $101 | 67 |
Match score weights: distance 35% · size 25% · config 20% · recency 20%. Top-matched comps best support the ARV.
Projected returns pro-forma
10.0% appreciation · 3.0% rent growth · sell at horizon
- IRR
- 26.3%
- Equity multiple
- 3.09×
- Total profit
- $43,077
- Equity at exit
- $66,215
- IRR
- 23.1%
- Equity multiple
- 7.05×
- Total profit
- $124,474
- Equity at exit
- $142,794
Cash invested: $20,580 (down + closing). Projections, not guarantees.
Landlord ↔ Tenant lean methodology
- Overall (STATE)
- 87 Strongly Landlord-Friendly
- State Florida
- 87 Strongly Landlord-Friendly · R+3
- County
- — inherits STATE
- City
- — inherits STATE
ZIP-level market 32680
- Home prices YoY
- 2.5%
- Active inventory
- 263
- Price-to-rent
- 8.8×
Monthly cashflow live
- Estimated rent
- $693 medium interval (Pro) →
- Mortgage (P&I)
- −$385
- Tax from tax record
- −$84 /mo · $1,004/yr
- Insurance
- −$31
- HOA
- −$0
- Lot rent leased land?
- −$0
- Vacancy / Maint / Mgmt
- −$146
- Net cashflow
- $48
Break-even live
Sensitivity live
| Price | -10% $89 | -5% $69 | +0% $48 | +5% $27 | +10% $6 |
|---|---|---|---|---|---|
| Rent | -10% $-7 | -5% $20 | +0% $48 | +5% $75 | +10% $103 |
| Rate | -1.0pp $85 | -0.5pp $66 | base $48 | +0.5pp $29 | +1.0pp $9 |
UW: 25.0% down · 7.5% · 30yr · 1.5% tax · 5.0% vac · 8.0% maint · 8.0% mgmt
Financing live
Cash to close
- Down payment
- $18,375
- Closing costs
- $2,205
- Reserves months
- —
- Total cash needed
- —
Loan-product check · same deal, 3 products live
Conventional
25% down · 7.5% · 30yr
- Down + closing
- —
- Monthly P&I
- —
- Monthly cashflow
- —
- DSCR
- —
- Eligible?
- —
Personal DTI + credit; lowest rate.
DSCR
20% down · 8.5% · 30yr
- Down + closing
- —
- Monthly P&I
- —
- Monthly cashflow
- —
- DSCR
- —
- Eligible?
- —
No personal income docs; deal must DSCR.
Hard money
10% down · 12.0% · 12mo
- Down + closing
- —
- Monthly P&I
- —
- Monthly cashflow
- —
- DSCR
- —
- Eligible?
- —
Short-term bridge; refi at stabilization.
Rent comps 1 comps
| Address | Beds | Baths | Sqft | Rent | $/sqft | DOM | Units | Dist |
|---|---|---|---|---|---|---|---|---|
| 88 SE 411th St Unit 7 Cross City, FL | 2.0 | 1.0 | 900 | $900 | $1.00 | 15d | 1 | 0.81mi |
Listing history 10 events
-
2026-06-22days on market $73,500 Active 23 DOM
-
2026-06-21days on market $73,500 Active 22 DOM
-
2026-06-21days on market $73,500 Active 21 DOM
-
2026-06-18days on market $73,500 Active 19 DOM
-
2026-06-17days on market $73,500 Active 18 DOM
-
2026-06-16days on market $73,500 Active 17 DOM
-
2026-06-15days on market $73,500 Active 16 DOM
-
2026-06-13days on market $73,500 Active 14 DOM
-
2026-06-12remarks 699-char remark
-
2026-06-12$73,500 Active 13 DOM
ⓘ Source: listings_history table (triggers on properties + properties_extension) + one-shot
backfill from property_details.listing_events for pre-trigger history.
Tax reassessment forecast FL · Resets to sale price
- Current annual tax
- $1,004 · $84/mo
- Projected year-2 tax
- $1,004 · $84/mo
- Expected delta
- $0/yr ($0/mo · 0.0%)
ⓘ Screening estimate from a state-policy table — verify with the county assessor before closing.
Climate risk First Street
- Flood 1/10 Low FEMA zone X (unshaded) · 0% chance over 30 yrs
- Wildfire 6/10 Major
- Heat 8/10 Severe 7 d/yr ≥106°F today · 22 d/yr by 30 yrs out
- Wind 9/10 Extreme 99% chance of damaging wind over 30 yrs
- Air quality 2/10 Low 1 unhealthy d/yr today · 2 by 30 yrs out
Nearby sold comps map
Loading sold comps map…
Walkable amenities ~0.75 mi
Loading nearby amenities…
Taxation est. · year 1
- Rental income
- $8,316
- − Mortgage interest
- −$4,117
- − Property taxes
- −$1,004
- − Insurance
- −$368
- − Repairs & maintenance
- −$665
- − Management
- −$665
- − Depreciation
- −$2,138
- Taxable loss
- −$641
- Est. tax savings @ 24.0%
- +$154
- After-tax cash flow
- $727/yr
For passive investors: Depreciation is non-cash, so a rental often shows a tax loss while cash-flowing — sheltering income. Rental losses are passive: they offset passive income freely, and up to $25,000/yr can offset ordinary (W-2) income if you actively participate and your MAGI is under $100k (phasing out to $0 by $150k); unused losses carry forward. On sale, claimed depreciation is recaptured at up to 25%, and gains may owe capital-gains tax (a 1031 exchange can defer both). Figures are a year-1 estimate at your 24.0% rate — not tax advice; consult a CPA.
Schools (NCES district)
- District
- Dixie
- NCES district ID
- 1200450
- Math proficiency
- 52% ▼ -3.00%
- Reading proficiency
- 50% ▼ -4.00%
- Median HH income
- $34,799
- Composite
- 42.18/100
- National rank
- #3290
- State rank
- #36 of 73 in FL
Livability — Cross City
- Score
- 70/100
- State rank
- #412
- US rank
- #7340
Category grades
Schools grade is shown separately in the Schools card above.
Census & demographics
- Population (ZIP)
- 10,445
Population outlook (Dixie County) Hauer SSP2
- Today (2025)
- 15,122 people
- By 2030
- 14,521 · -4.0%
- By 2040
- 13,503 · -10.7%
- By 2050
- 12,671 · -16.2%
- By 2075
- 10,857 · -28.2%
- By 2100
- 8,344 · -44.8%
Race, ethnicity, and origin ACS 2023
- Neighborhood character
- Predominantly White (94%)
- Race & ethnicity
- White 94% Two or more races 4% Hispanic / Latino 3% Black 1%
- Common ancestry
- Romanian 2% Slovak 1% Italian 1%
- Foreign-born
- 3% · Canada
- Languages at home
- 99% English-only · Spanish 1%
Political lean MEDSL · Dixie
- 2024 margin
- Solid R (+70.4) · D 14.5% · R 84.9%
- 2008→2024 swing
- -25.4pp toward R · 2008: -45.0pp · 2024: -70.4pp
- All cycles
- 2024: R+70.4 2020: R+66.0 2016: R+63.2 2012: R+46.9 2008: R+45.0
Not yet ingested
- Civics
- —
Market trends
- HPI YoY
- ▲ 10.22%
- Current HPI
- 424.0037
- Rent YoY
- —
- Metro
- —
- State GDP YoY
- ▲ 3.28%
- F500 in state
- 36
Industry mix (Fortune 500 HQ in FL)
| Industry | F500 HQs | Revenue |
|---|---|---|
| Industrial Technology | 2 | $29B |
|
||
| Insurance | 2 | $17B |
|
||
| Retail | 1 | $60B |
|
||
| Technology Distribution | 1 | $58B |
|
||
| Homebuilding | 1 | $35B |
|
||
| Technology Manufacturing | 1 | $35B |
|
||
Price history
1 event — show timeline
- 2026-05-30 Listed $73,500 DGLMLS
Property tax history
+21.0%/yrLatest (2025): $1,004 · +223.8% YoY. Source: county tax records.
Cash-flow waterfall
monthlySold comps — $/sqft
last 12 mo · ≤1 miLoading sold comps…