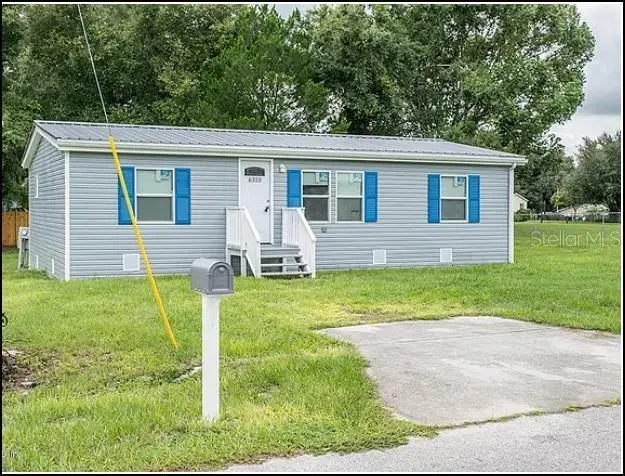
6310 SE 142nd Ln · Belleview, FL
Flood risk 1/10 · Minimal
- FEMA flood zone
- X (unshaded)
- Chance of flooding over 30 yrs
- 0.0%
- Est. flood insurance / yr
- $507 – $1,088
Fire risk 5/10 · Moderate
- Est. fire insurance / yr
- $947 – $1,759
Heat risk 8/10 · Major
- Hot days now (above 109°F)
- 7 days/yr
- Hot days in 30 yrs
- 21 days/yr
Wind risk 9/10 · Severe
- Chance of severe wind over 30 yrs
- 99.0%
Air-quality risk 3/10 · Minor
- Unhealthy air days now
- 2 days/yr
- Unhealthy air days in 30 yrs
- 2 days/yr
Risk factors via First Street. Map © Google.
Why this score? — see what drove the B+ grade
The composite is a weighted blend of 9 inputs, each scored 0–100. Each bar is that input's sub-score; the figure is the points it added to the 100-point composite (weight × sub-score).
- Cash flow +30.0/30.0
- ARV discount +15.0/15.0
- 1% rule +10.0/10.0
- DSCR +10.0/10.0
- Schools +3.6/10.0
- Livability +3.5/5.0
- Rent growth +2.5/5.0
- Condition / age +2.5/5.0
- Appreciation +0.0/10.0
$108,000
🖨 Deal sheet (PDF) 📄 Offer letter ✓ Due diligence
Listing remarks MLS
Welcome to this completely and newly remodeled mobile home on a large corner lot. This home features Luxury Vinyl Tile throughout the living areas and ceramic tile in wet areas. All new sub-flooring, floor coverings, tiled bathroom showers, vanities, faucets, appliances, air-conditioning units, thermal pane low-e glass aluminum windows, doors, lighting fixtures and interior sheet rock. Inside freshly painted and new exterior steps, landings and porches, vinyl siding, gutters and downspouts. 6" baseboard and crown molding. This is a real beauty and waiting for you to make it your home. Don't miss this great home.
Key facts
- 0.24 acre lot
- Built 1998
Neighborhood map
What this means for you Summary
Snapshot
- This is a 3-bed/2.0-bath manufactured listed at $108k.
Deal economics
- At list price, monthly cash flow is $839 ($10k/yr) — positive.
- The deal already cash-flows at list — no discount required.
- Meets the 1% rule at list price ($2k rent vs $108k).
- Cap rate 15.6% vs local median 4.5% in Belleview — top-decile yield for the area; either an underpriced asset or a hidden risk that comps aren't pricing in. Stress-test before assuming the spread holds.
Location & tenants
- Location reads 69/100 on livability (#458 in FL) — a middle-class / working-renter tenant base. Strengths: cost of living A+, housing A+, health & safety A+; Watch: crime F, amenities F, commute F.
- Marion (rural): math 42% / reading 43% proficiency, ranked #61 of 73 in FL (top 84%) — families likely to look elsewhere, expect single-tenant / working-renter base with shorter leases; 61% free/reduced lunch — lower-income household profile, screen leases tightly.
- Zoned schools: Harbour View Elementary School (math 41% / reading 38%, grade F, #1,513 of 2,144 statewide, top 73%, 819 students, 71% FRL); Belleview Middle School (math 49% / reading 50%, grade C, #259 of 571 statewide, top 46%, 1,573 students, 60% FRL); Belleview High School (math 31% / reading 46%, grade F, #321 of 667 statewide, top 49%, 1,783 students, 56% FRL) — zoned schools at 62% FRL track the district average.
- Market conditions: 713 active listings in the ZIP; 5 comparable units currently listed for rent nearby; rentals at typical pace (median 23d on market — plan ~3-4 weeks tenant-placement turnaround); 7,071 units permitted in Marion County in 2024 (534 in 5+ unit buildings).
- This rent runs 35% of the median local income ($67k/yr) — at the standard rent-burdened threshold; future hikes will face affordability resistance.
Forward outlook
- Local home prices are declining (-3.0%/yr); year-one equity from $747 of loan paydown is wiped out by about $3k of value loss. Plan a longer hold.
- Marion County population projected at +13% by 2050 — modest demand growth; plan on rents tracking national, not racing it.
- At projected returns (-3.0% appreciation + 3.0% rent growth), your $30k cash investment doubles in ~4 years — after that, you're playing with house money.
Negotiation context
- Only 1 days on market — expect competitive offers; lowballing is unlikely to land.
- 8 sale attempts since 14y ago with the ask held roughly flat each time — persistent listings suggest the price (not the market) is what's stuck; bring a comps-based counter.
- Current owner paid $74k; 46% above their basis — modest negotiation headroom, anchor on the comps not their cost.
Risks & watch-outs
- Climate carrying-cost: severe wind risk, 99% chance of damaging wind over 30y; moderate wildfire risk; extreme-heat days projected 7→21/yr by 2055 (HVAC capex compounding) — expect insurance premiums to compound above CPI over the hold.
Questions for the listing agent
- Is there a deadline driving the sale (1031 exchange, divorce, estate, relocation)? That informs how much negotiation room exists.
- Schools are D-rated, which usually means shorter tenancies and higher turnover. Who's the typical renter profile here, and what's been the actual vacancy rate?
- Crime grade is F in this area — have there been break-ins, vandalism, or insurance claims at this property in the last 3 years? What carrier currently insures it and at what premium?
- What's the average days-on-market for RENTAL listings here right now (not sales)? A rising rental-DOM trend means longer vacancies and softer asking-rent achievability than the comps imply.
- What's the recent tenant-quality profile in this submarket — average credit score on applications, eviction rate, late-payment / NSF rate, and stable-employment percentage? A property-management company in the area should have these aggregated.
- How much new for-sale + rental construction is in the pipeline within 1–3 miles? Heavy new supply typically softens prices + rents 12–24 months out; constrained supply supports both.
Investment metrics
- 1% rule
- 1.81% ✓
- Cap rate
- 15.61%
- Cash-on-cash
- 33.28%
- DSCR
- 2.48
- GRM
- 4.6
CMA / ARV
- ARV (on-the-fly)
- $160,920
- Comps found
- 1
Show comp detail 1 sale within ~0.75 mi
| Address | Dist | Beds/Ba | Sqft | Sold | Price | $/sf | Match |
|---|---|---|---|---|---|---|---|
| 14127 SE 62nd Ct | 0.20mi | 3/2.0 | 1,216 (+13%) | 4mo | $181,000 | $149 | 67 |
Match score weights: distance 35% · size 25% · config 20% · recency 20%. Top-matched comps best support the ARV.
Projected returns pro-forma
-3.0% appreciation · 3.0% rent growth · sell at horizon
- IRR
- 28.5%
- Equity multiple
- 2.19×
- Total profit
- $35,926
- Equity at exit
- $16,103
- IRR
- 35.9%
- Equity multiple
- 4.31×
- Total profit
- $100,090
- Equity at exit
- $9,338
Cash invested: $30,240 (down + closing). Projections, not guarantees.
Landlord ↔ Tenant lean methodology
- Overall (STATE)
- 87 Strongly Landlord-Friendly
- State Florida
- 87 Strongly Landlord-Friendly · R+3
- County
- — inherits STATE
- City
- — inherits STATE
ZIP-level market 34491
- Home prices YoY
- -35.0%
- Active inventory
- 713
- Price-to-rent
- 4.6×
Monthly cashflow live
- Estimated rent
- $1,954 high interval (Pro) →
- Mortgage (P&I)
- −$566
- Tax from tax record
- −$94 /mo · $1,127/yr
- Insurance
- −$45
- HOA
- −$0
- Vacancy / Maint / Mgmt
- −$410
- Net cashflow
- $839
Break-even live
Sensitivity live
| Price | -10% $900 | -5% $869 | +0% $839 | +5% $808 | +10% $778 |
|---|---|---|---|---|---|
| Rent | -10% $684 | -5% $762 | +0% $839 | +5% $916 | +10% $993 |
| Rate | -1.0pp $893 | -0.5pp $866 | base $839 | +0.5pp $811 | +1.0pp $782 |
UW: 25.0% down · 7.5% · 30yr · 1.5% tax · 5.0% vac · 8.0% maint · 8.0% mgmt
Financing live
Cash to close
- Down payment
- $27,000
- Closing costs
- $3,240
- Reserves months
- —
- Total cash needed
- —
Loan-product check · same deal, 3 products live
Conventional
25% down · 7.5% · 30yr
- Down + closing
- —
- Monthly P&I
- —
- Monthly cashflow
- —
- DSCR
- —
- Eligible?
- —
Personal DTI + credit; lowest rate.
DSCR
20% down · 8.5% · 30yr
- Down + closing
- —
- Monthly P&I
- —
- Monthly cashflow
- —
- DSCR
- —
- Eligible?
- —
No personal income docs; deal must DSCR.
Hard money
10% down · 12.0% · 12mo
- Down + closing
- —
- Monthly P&I
- —
- Monthly cashflow
- —
- DSCR
- —
- Eligible?
- —
Short-term bridge; refi at stabilization.
Rent comps 5 comps
| Address | Beds | Baths | Sqft | Rent | $/sqft | DOM | Units | Dist |
|---|---|---|---|---|---|---|---|---|
| 14025 SE 54th Ct Summerfield, FL | 2.0 | 1.5 | 1008 | $1,500 | $1.49 | 15d | 1 | 0.84mi |
| 13678 SE 55th Ave Summerfield, FL | 3.0 | 2.0 | 960 | $1,499 | $1.56 | 22d | 1 | 0.99mi |
| 13705 SE 54th Ct Summerfield, FL | 3.0 | 2.0 | 1416 | $1,895 | $1.34 | 22d | 1 | 1.01mi |
| 13609 SE 53rd Ave Summerfield, FL | 3.0 | 2.0 | 1270 | $1,940 | $1.53 | 22d | 1 | 1.16mi |
| 16152 SE 77th Ct Summerfield, FL | 1.0–3.0 | 1.0–2.0 | 1140 | $2,185 | $1.92 | 15d | 15 | 1.33mi |
Listing history 20 events
-
2026-04-13status Pending
-
2026-04-13$108,000 Active
-
2025-11-13historical
-
2025-11-10$108,000 Active
-
2018-02-09soldstatus $74,000 624-char remark
Show marketing remark (624 chars)
Welcome to this completely and newly remodeled mobile home on a large corner lot. This home features Luxury Vinyl Tile throughout the living areas and ceramic tile in wet areas. All new sub-flooring, floor coverings, tiled bathroom showers, vanities, faucets, appliances, air-conditioning units, thermal pane low-e glass aluminum windows, doors, lighting fixtures and interior sheet rock. Inside freshly painted and new exterior steps, landings and porches, vinyl siding, gutters and downspouts. 6" baseboard and crown molding. This is a real beauty and waiting for you to make it your home. Don't miss this great home.
-
2018-02-07soldstatus $74,000
-
2017-08-31$85,000
-
2017-08-27$85,000 624-char remark
Show marketing remark (624 chars)
Welcome to this completely and newly remodeled mobile home on a large corner lot. This home features Luxury Vinyl Tile throughout the living areas and ceramic tile in wet areas. All new sub-flooring, floor coverings, tiled bathroom showers, vanities, faucets, appliances, air-conditioning units, thermal pane low-e glass aluminum windows, doors, lighting fixtures and interior sheet rock. Inside freshly painted and new exterior steps, landings and porches, vinyl siding, gutters and downspouts. 6" baseboard and crown molding. This is a real beauty and waiting for you to make it your home. Don't miss this great home.
-
2016-07-29soldstatus $9,000
-
2016-07-27soldstatus $9,000
-
2016-07-26soldstatus $9,000
-
2015-11-10$10,000
-
2015-11-10$10,000
-
2015-03-25soldstatus $5,500
-
2014-03-26$5,500
-
2012-04-30soldstatus $7,000
-
2012-04-25soldstatus $7,000
-
2012-04-24$9,000
-
1999-04-07soldstatus $15,000
-
1996-10-11soldstatus $12,900
ⓘ Source: listings_history table (triggers on properties + properties_extension) + one-shot
backfill from property_details.listing_events for pre-trigger history.
Tax reassessment forecast FL · Resets to sale price
- Current annual tax
- $1,127 · $94/mo
- Projected year-2 tax
- $1,127 · $94/mo
- Expected delta
- $0/yr ($0/mo · 0.0%)
ⓘ Screening estimate from a state-policy table — verify with the county assessor before closing.
Climate risk First Street
- Flood 1/10 Low FEMA zone X (unshaded) · 0% chance over 30 yrs
- Wildfire 5/10 Major
- Heat 8/10 Severe 7 d/yr ≥109°F today · 21 d/yr by 30 yrs out
- Wind 9/10 Extreme 99% chance of damaging wind over 30 yrs
- Air quality 3/10 Moderate 2 unhealthy d/yr today · 2 by 30 yrs out
Nearby sold comps map
Loading sold comps map…
Walkable amenities ~0.75 mi
Loading nearby amenities…
Taxation est. · year 1
- Rental income
- $23,454
- − Mortgage interest
- −$6,050
- − Property taxes
- −$1,127
- − Insurance
- −$540
- − Repairs & maintenance
- −$1,876
- − Management
- −$1,876
- − Depreciation
- −$3,142
- Taxable income
- $8,843
- Est. tax owed @ 24.0%
- −$2,122
- After-tax cash flow
- $7,943/yr
For passive investors: Depreciation is non-cash, so a rental often shows a tax loss while cash-flowing — sheltering income. Rental losses are passive: they offset passive income freely, and up to $25,000/yr can offset ordinary (W-2) income if you actively participate and your MAGI is under $100k (phasing out to $0 by $150k); unused losses carry forward. On sale, claimed depreciation is recaptured at up to 25%, and gains may owe capital-gains tax (a 1031 exchange can defer both). Figures are a year-1 estimate at your 24.0% rate — not tax advice; consult a CPA.
Schools (NCES district)
- District
- Marion
- NCES district ID
- 1201260
- Math proficiency
- 42% ▼ -7.00%
- Reading proficiency
- 43% ▼ -4.00%
- Median HH income
- $40,015
- Composite
- 35.61/100
- National rank
- #4890
- State rank
- #61 of 73 in FL
Livability — Belleview
- Score
- 69/100
- State rank
- #458
- US rank
- #8314
Category grades
Schools grade is shown separately in the Schools card above.
Census & demographics
- County
- Marion County · 315,796 people
- City population
- 19,167
- Metro
- Ocala, FL
- Population (ZIP)
- 33,318
- Household income
- $66,679
- Rent vs Own
- Severe rent burden
- 256.0
Population outlook (Marion County) Hauer SSP2
- Today (2025)
- 365,905 people
- By 2030
- 376,768 · +3.0%
- By 2040
- 396,555 · +8.4%
- By 2050
- 412,723 · +12.8%
- By 2075
- 446,090 · +21.9%
- By 2100
- 436,193 · +19.2%
Race, ethnicity, and origin ACS 2023
- Neighborhood character
- Predominantly White (77%)
- Race & ethnicity
- White 77% Hispanic / Latino 14% Two or more races 9% Black 4% Asian 2%
- Hispanic origin (detail)
- Mexican 3% Puerto Rican 6% Cuban 1%
- Common ancestry
- Lithuanian 3% Slovak 2% Romanian 2%
- Foreign-born
- 8% · Canada, Vietnam, Jamaica
- Languages at home
- 85% English-only · Spanish 11% Vietnamese 1% French/Haitian/Cajun 1%
Political lean MEDSL · Marion
- 2024 margin
- Solid R (+31.6) · D 33.8% · R 65.5%
- 2008→2024 swing
- -20.0pp toward R · 2008: -11.6pp · 2024: -31.6pp
- All cycles
- 2024: R+31.6 2020: R+25.9 2016: R+26.2 2012: R+16.2 2008: R+11.6
Not yet ingested
- Civics
- —
Market trends
- HPI YoY
- ▼ -107.67%
- Current HPI
- 200.0792
- Rent YoY
- —
- Metro
- Ocala, FL
- State GDP YoY
- ▲ 3.28%
- F500 in state
- 36
Industry mix (Fortune 500 HQ in FL)
| Industry | F500 HQs | Revenue |
|---|---|---|
| Industrial Technology | 2 | $29B |
|
||
| Insurance | 2 | $17B |
|
||
| Retail | 1 | $60B |
|
||
| Technology Distribution | 1 | $58B |
|
||
| Homebuilding | 1 | $35B |
|
||
| Technology Manufacturing | 1 | $35B |
|
||
Price history
+737.2% since first listed20 events — show timeline
- 2026-04-13 Pending — Stellar MLS as Distributed by MLS Grid
- 2026-04-13 Listed $108,000 Stellar MLS as Distributed by MLS Grid
- 2025-11-13 Listing Removed — Stellar MLS as Distributed by MLS Grid
- 2025-11-10 Listed $108,000 Stellar MLS as Distributed by MLS Grid
- 2018-02-09 Sold (MLS) $74,000 Stellar MLS as Distributed by MLS Grid
- 2018-02-07 Sold (MLS) $74,000 Stellar MLS as Distributed by MLS Grid
- 2017-08-31 Listed $85,000 Stellar MLS as Distributed by MLS Grid
- 2017-08-27 Listed $85,000 Stellar MLS as Distributed by MLS Grid
- 2016-07-29 Sold (Public Records) $9,000 Public Records
- 2016-07-27 Sold (MLS) $9,000 Stellar MLS as Distributed by MLS Grid
- 2016-07-26 Sold (MLS) $9,000 Stellar MLS as Distributed by MLS Grid
- 2015-11-10 Listed $10,000 Stellar MLS as Distributed by MLS Grid
- 2015-11-10 Listed $10,000 Stellar MLS as Distributed by MLS Grid
- 2015-03-25 Sold (MLS) $5,500 Stellar MLS as Distributed by MLS Grid
- 2014-03-26 Listed $5,500 Stellar MLS as Distributed by MLS Grid
- 2012-04-30 Sold (Public Records) $7,000 Public Records
- 2012-04-25 Sold (MLS) $7,000 Stellar MLS as Distributed by MLS Grid
- 2012-04-24 Listed $9,000 Stellar MLS as Distributed by MLS Grid
- 1999-04-07 Sold (Public Records) $15,000 Public Records
- 1996-10-11 Sold (Public Records) $12,900 Public Records
Property tax history
+23.7%/yrLatest (2025): $1,127 · +16.1% YoY. Source: county tax records.
Cash-flow waterfall
monthlySold comps — $/sqft
last 12 mo · ≤1 miLoading sold comps…