 🏗️ New Construction
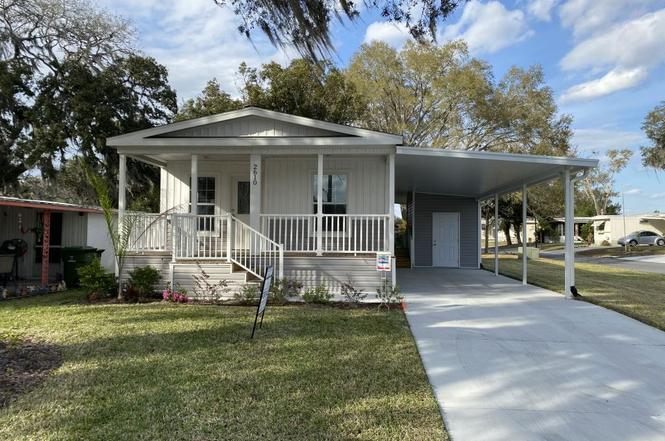
Maitland Plan · Leesburg, FL
Flood risk 1/10 · Minimal
- FEMA flood zone
- X (unshaded)
- Chance of flooding over 30 yrs
- 0.0%
- Est. flood insurance / yr
- $507 – $1,088
Fire risk 3/10 · Minor
- Est. fire insurance / yr
- $947 – $1,759
Heat risk 8/10 · Major
- Hot days now (above 108°F)
- 7 days/yr
- Hot days in 30 yrs
- 22 days/yr
Wind risk 9/10 · Severe
- Chance of severe wind over 30 yrs
- 99.0%
Air-quality risk 2/10 · Minimal
- Unhealthy air days now
- 1 days/yr
- Unhealthy air days in 30 yrs
- 1 days/yr
Risk factors via First Street. Map © Google.
Why this score? — see what drove the B- grade
The composite is a weighted blend of 9 inputs, each scored 0–100. Each bar is that input's sub-score; the figure is the points it added to the 100-point composite (weight × sub-score).
- Cash flow +30.0/30.0
- 1% rule +10.0/10.0
- DSCR +10.0/10.0
- ARV discount +7.5/15.0
- Schools +4.2/10.0
- Livability +3.1/5.0
- Condition / age +2.5/5.0
- Rent growth +2.3/5.0
- Appreciation +0.0/10.0
$109,400
🖨 Deal sheet 📄 Offer letter ✓ Due diligence
Listing remarks
55+ age qualified community. Welcome to Coachwood Colony a 55+ age-qualified active and vibrant community, where you can find yourself in your dream home. We have a beautiful 2022 2 bed, 2 bath home for sale or rent featuring 1000.00 sq ft of beautifully designed living space. Located in Leesburg, this property offers the perfect blend of modern amenities and timeless charm. BUY OR RENT W/ OPTION TO BUY! Step inside to find plenty of natural light. The modern kitchen boasts stainless steel appliances, perfect for both everyday living and entertaining. The spacious primary suite offers a peaceful retreat, complete with en-suite bathroom and a walk-in closet. Additional bedrooms provide vers
Key facts
- Shuffleboard courts
- Clubhouse
- Covered patio
Tags
Property features AI
Finance
- Other: Address: 2607 Leisure Ln, Leesburg FL 34748; List price available
- Financial info: Listing is active
Exterior
- Home design: Maitland plan (new construction plan)
- Construction: Built as part of a new construction plan
- Exterior features: Living area of approximately 1000
Interior
- Bedrooms: 2 bedrooms
- Bathrooms: 2 full bathrooms
- Interior features: Virtual tour available
Neighborhood map
What this means for you Summary
Snapshot
- This is a 2-bed/2.0-bath manufactured listed at $109k.
Deal economics
- At list price, monthly cash flow is $605 ($7k/yr) — positive.
- The deal already cash-flows at list — no discount required.
- Meets the 1% rule at list price ($2k rent vs $109k).
- Recommended offer: $96k (12.0% below list) — sets the bar for market timing.
- Cap rate 14.3% vs local median 4.5% in Leesburg — top-decile yield for the area; either an underpriced asset or a hidden risk that comps aren't pricing in. Stress-test before assuming the spread holds.
Location & tenants
- Location reads 62/100 on livability (#751 in FL) — a middle-class / working-renter tenant base. Strengths: cost of living A+, housing A+; Watch: schools D+, crime D, amenities F.
- Lake (suburban): math 49% / reading 50% proficiency, ranked #37 of 73 in FL (top 51%) — families likely to look elsewhere, expect single-tenant / working-renter base with shorter leases.
- Market conditions: Rents soft (-0.9%/yr); 783 active listings in the ZIP; 19 comparable units currently listed for rent nearby; rentals at typical pace (median 15d on market — plan ~3-4 weeks tenant-placement turnaround); 4,799 units permitted in Lake County in 2024 (814 in 5+ unit buildings).
- This rent runs 32% of the median local income ($58k/yr) — at the standard rent-burdened threshold; future hikes will face affordability resistance.
Forward outlook
- Local home prices are declining (-3.0%/yr); year-one equity from $629 of loan paydown is wiped out by about $3k of value loss. Plan a longer hold.
- Lake County population projected at +37% by 2050 — long-run rental-demand tailwind backs the buy-and-hold thesis.
- At projected returns (-3.0% appreciation + 0.0% rent growth), your $25k cash investment doubles in ~5 years — after that, you're playing with house money.
Negotiation context
- It's been on market 129 days — a 12% lower offer ($96k) is reasonable based on typical stale-listing flexibility.
Risks & watch-outs
- Climate carrying-cost: severe wind risk, 99% chance of damaging wind over 30y; extreme-heat days projected 7→22/yr by 2055 (HVAC capex compounding) — expect insurance premiums to compound above CPI over the hold.
Questions for the listing agent
- It's been on market 129 days. Have you received any prior offers? Is the seller open to a 12% concession, seller financing, or rate buy-down credit?
- Why hasn't it sold? Are there any deal-killer items the seller is aware of (foundation, flood, title, zoning, code violations)?
- Is there a deadline driving the sale (1031 exchange, divorce, estate, relocation)? That informs how much negotiation room exists.
- Schools are D-rated, which usually means shorter tenancies and higher turnover. Who's the typical renter profile here, and what's been the actual vacancy rate?
- Crime grade is D in this area — have there been break-ins, vandalism, or insurance claims at this property in the last 3 years? What carrier currently insures it and at what premium?
- What's the average days-on-market for RENTAL listings here right now (not sales)? A rising rental-DOM trend means longer vacancies and softer asking-rent achievability than the comps imply.
- What's the recent tenant-quality profile in this submarket — average credit score on applications, eviction rate, late-payment / NSF rate, and stable-employment percentage? A property-management company in the area should have these aggregated.
- How much new for-sale + rental construction is in the pipeline within 1–3 miles? Heavy new supply typically softens prices + rents 12–24 months out; constrained supply supports both.
Investment metrics
- 1% rule
- 1.72% ✓
- Cap rate
- 14.28%
- Cash-on-cash
- 28.52%
- DSCR
- 2.27
- GRM
- 4.9
CMA / ARV
- ARV (on-the-fly)
- $91,000
- Comps found
- 2
Show comp detail 2 sales within ~0.75 mi
| Address | Dist | Beds/Ba | Sqft | Sold | Price | $/sf | Match |
|---|---|---|---|---|---|---|---|
| 616 Old Colony Rd | 0.20mi | 2/2.0 | 1,008 (+1%) | 3mo | $92,000 | $91 | 87 |
| 715 Surrey Pl | 0.15mi | 2/2.0 | 1,100 (+10%) | 12mo | $80,000 | $73 | 66 |
Match score weights: distance 35% · size 25% · config 20% · recency 20%. Top-matched comps best support the ARV.
Projected returns pro-forma
-3.0% appreciation · 0.0% rent growth · sell at horizon
- IRR
- 19.3%
- Equity multiple
- 1.76×
- Total profit
- $19,262
- Equity at exit
- $13,568
- IRR
- 25.5%
- Equity multiple
- 2.92×
- Total profit
- $48,830
- Equity at exit
- $7,868
Cash invested: $25,480 (down + closing). Projections, not guarantees.
Landlord ↔ Tenant lean methodology
- Overall (STATE)
- 87 Strongly Landlord-Friendly
- State Florida
- 87 Strongly Landlord-Friendly · R+3
- County
- — inherits STATE
- City
- — inherits STATE
ZIP-level market 34748
- Home prices YoY
- -25.3%
- Rents YoY
- -0.9%
- Active inventory
- 783
- Price-to-rent
- 5.8×
Monthly cashflow live
- Estimated rent
- $1,562 high interval (Pro) →
- Mortgage (P&I)
- −$477
- Tax est. 1.5%
- −$114 /mo · $1,365/yr
- Insurance
- −$38
- HOA
- −$0
- Vacancy / Maint / Mgmt
- −$328
- Net cashflow
- $605
Break-even live
UW: 25.0% down · 7.5% · 30yr · 1.5% tax · 5.0% vac · 8.0% maint · 8.0% mgmt
Financing live
Cash to close
- Down payment
- $22,750
- Closing costs
- $2,730
- Reserves months
- —
- Total cash needed
- —
Loan-product check · same deal, 3 products live
Conventional
25% down · 7.5% · 30yr
- Down + closing
- —
- Monthly P&I
- —
- Monthly cashflow
- —
- DSCR
- —
- Eligible?
- —
Personal DTI + credit; lowest rate.
DSCR
20% down · 8.5% · 30yr
- Down + closing
- —
- Monthly P&I
- —
- Monthly cashflow
- —
- DSCR
- —
- Eligible?
- —
No personal income docs; deal must DSCR.
Hard money
10% down · 12.0% · 12mo
- Down + closing
- —
- Monthly P&I
- —
- Monthly cashflow
- —
- DSCR
- —
- Eligible?
- —
Short-term bridge; refi at stabilization.
Rent comps 19 comps
| Address | Beds | Baths | Sqft | Rent | $/sqft | DOM | Units | Dist |
|---|---|---|---|---|---|---|---|---|
| 2602 Houston Pl Leesburg, FL | 2.0 | 2.0 | 960 | $1,895 | $1.97 | 4d | 1 | 0.18mi |
| 513 Old Colony Rd Leesburg, FL | 3.0 | 2.0 | 1198 | $1,699 | $1.42 | 4d | 1 | 0.39mi |
| 502 Old Colony Rd Leesburg, FL | 3.0 | 2.0 | 1456 | $1,299 | $0.89 | 23d | 1 | 0.43mi |
| 1004 Royal Oak Blvd Unit 1004 Leesburg, FL | 2.0 | 2.5 | 1244 | $1,550 | $1.25 | 4d | 1 | 0.43mi |
| 822 S Lone Oak Dr Unit B Leesburg, FL | 2.0 | 1.0 | 900 | $1,195 | $1.33 | 23d | 1 | 0.44mi |
| 2920 Pecan Ave Leesburg, FL | 2.0 | 2.5 | 1288 | $1,700 | $1.32 | 23d | 1 | 0.45mi |
| 2940 Peach St Leesburg, FL | 2.0 | 2.5 | 1288 | $1,750 | $1.36 | 17d | 1 | 0.49mi |
| 210 N Lone Oak Dr Unit 1 Leesburg, FL | 2.0 | 1.0 | 912 | $1,250 | $1.37 | 14d | 1 | 0.93mi |
| 1604 Woodlyn Dr Leesburg, FL | 3.0 | 1.5 | 1088 | $1,500 | $1.38 | 23d | 1 | 0.94mi |
| 1317 Cambridge Dr Leesburg, FL | 3.0 | 1.5 | 1240 | $1,600 | $1.29 | 23d | 1 | 0.95mi |
| 114 N Chester St Leesburg, FL | 1.0 | 1.0 | 702 | $850 | $1.21 | 4d | 1 | 0.98mi |
| 200 S Moss St Leesburg, FL | 3.0 | 2.0 | 968 | $1,500 | $1.55 | 23d | 1 | 1.02mi |
| 1801 Center St Unit 2 Leesburg, FL | 2.0 | 1.0 | 754 | $1,300 | $1.72 | 23d | 1 | 1.13mi |
| 1220 W Dixie Ave Leesburg, FL | 3.0 | 2.0 | 1304 | $1,600 | $1.23 | 4d | 1 | 1.28mi |
| 1401 Floradel Ave Leesburg, FL | 2.0 | 1.0 | 1190 | $1,495 | $1.26 | 3d | 1 | 1.38mi |
| 1403 Old Harbor Blvd Leesburg, FL | 1.0–4.0 | 1.0–3.0 | 1079 | $1,366 | $1.27 | 2d | 9 | 1.40mi |
| 1001 Crawford St Unit 1 Leesburg, FL | 3.0 | 1.0 | 800 | $1,100 | $1.38 | 14d | 1 | 1.40mi |
| 1001 Crawford St Leesburg, FL | 3.0 | 1.0 | 800 | $1,100 | $1.38 | 11d | 1 | 1.40mi |
| 1009 Nebraska St Leesburg, FL | 3.0 | 1.0 | 864 | $1,850 | $2.14 | 12d | 1 | 1.43mi |
Listing history 13 events
-
2026-06-18days on market $109,400 Active 129 DOM
-
2026-06-17days on market $109,400 Active 128 DOM
-
2026-06-16days on market $109,400 Active 127 DOM
-
2026-06-15days on market $109,400 Active 126 DOM
-
2026-06-13days on market $109,400 Active 124 DOM
-
2026-06-09days on market $109,400 Active 120 DOM
-
2026-06-08days on market $109,400 Active 119 DOM
-
2026-06-07days on market $109,400 Active 118 DOM
-
2026-06-04days on market $109,400 Active 115 DOM
-
2026-06-03days on market $109,400 Active 114 DOM
-
2026-06-02days on market $109,400 Active 113 DOM
-
2026-06-02days on market $109,400 Active 112 DOM
-
2026-05-31days on market $109,400 Active 111 DOM
ⓘ Source: listings_history table (triggers on properties + properties_extension) + one-shot
backfill from property_details.listing_events for pre-trigger history.
Climate risk First Street
- Flood 1/10 Low FEMA zone X (unshaded) · 0% chance over 30 yrs
- Wildfire 3/10 Moderate
- Heat 8/10 Severe 7 d/yr ≥108°F today · 22 d/yr by 30 yrs out
- Wind 9/10 Extreme 99% chance of damaging wind over 30 yrs
- Air quality 2/10 Low 1 unhealthy d/yr today · 1 by 30 yrs out
Nearby sold comps map
Loading sold comps map…
Walkable amenities ~0.75 mi
Loading nearby amenities…
Taxation est. · year 1
- Rental income
- $18,750
- − Mortgage interest
- −$5,097
- − Property taxes
- −$1,365
- − Insurance
- −$455
- − Repairs & maintenance
- −$1,500
- − Management
- −$1,500
- − Depreciation
- −$2,647
- Taxable income
- $6,185
- Est. tax owed @ 24.0%
- −$1,484
- After-tax cash flow
- $5,781/yr
For passive investors: Depreciation is non-cash, so a rental often shows a tax loss while cash-flowing — sheltering income. Rental losses are passive: they offset passive income freely, and up to $25,000/yr can offset ordinary (W-2) income if you actively participate and your MAGI is under $100k (phasing out to $0 by $150k); unused losses carry forward. On sale, claimed depreciation is recaptured at up to 25%, and gains may owe capital-gains tax (a 1031 exchange can defer both). Figures are a year-1 estimate at your 24.0% rate — not tax advice; consult a CPA.
Schools (NCES district)
- District
- Lake
- NCES district ID
- 1201050
- Math proficiency
- 49% ▼ -7.00%
- Reading proficiency
- 50% ▼ -4.00%
- Median HH income
- $46,632
- Composite
- 42.05/100
- National rank
- #3327
- State rank
- #37 of 73 in FL
Livability — Leesburg
- Score
- 62/100
- State rank
- #751
- US rank
- #16429
Category grades
Schools grade is shown separately in the Schools card above.
Census & demographics
- Census place
- Leesburg, FL
- County
- Lake County · 364,602 people
- City population
- 70,232
- Metro
- Orlando-Kissimmee-Sanford, FL
- Population (ZIP)
- 48,095
- Household income
- $58,192
- Rent vs Own
- Severe rent burden
- 1745.0
Population outlook (Lake County) Hauer SSP2
- Today (2025)
- 386,640 people
- By 2030
- 417,107 · +7.9%
- By 2040
- 476,676 · +23.3%
- By 2050
- 531,296 · +37.4%
- By 2075
- 648,303 · +67.7%
- By 2100
- 698,530 · +80.7%
Race, ethnicity, and origin ACS 2023
- Neighborhood character
- Majority White (64%)
- Race & ethnicity
- White 64% Black 16% Hispanic / Latino 15% Two or more races 9% Asian 1%
- Hispanic origin (detail)
- Mexican 4% Puerto Rican 5% Cuban 3%
- Common ancestry
- Romanian 3% Lithuanian 3% Slovak 2%
- Foreign-born
- 9% · Canada, Vietnam, Jamaica
- Languages at home
- 88% English-only · Spanish 10% French/Haitian/Cajun 1%
Political lean MEDSL · Lake
- 2024 margin
- Strong R (+24.7) · D 37.3% · R 62.0%
- 2008→2024 swing
- -11.2pp toward R · 2008: -13.5pp · 2024: -24.7pp
- All cycles
- 2024: R+24.7 2020: R+20.0 2016: R+23.1 2012: R+17.1 2008: R+13.5
Not yet ingested
- Civics
- —
Market trends
- HPI YoY
- ▼ -88.97%
- Current HPI
- 262.1766
- Rent YoY
- ▼ -0.95%
- Metro
- Orlando-Kissimmee-Sanford, FL
- State GDP YoY
- ▲ 3.28%
- F500 in state
- 36
Industry mix (Fortune 500 HQ in FL)
| Industry | F500 HQs | Revenue |
|---|---|---|
| Industrial Technology | 2 | $29B |
|
||
| Insurance | 2 | $17B |
|
||
| Retail | 1 | $60B |
|
||
| Technology Distribution | 1 | $58B |
|
||
| Homebuilding | 1 | $35B |
|
||
| Technology Manufacturing | 1 | $35B |
|
||
Cash-flow waterfall
monthlySold comps — $/sqft
last 12 mo · ≤1 miLoading sold comps…