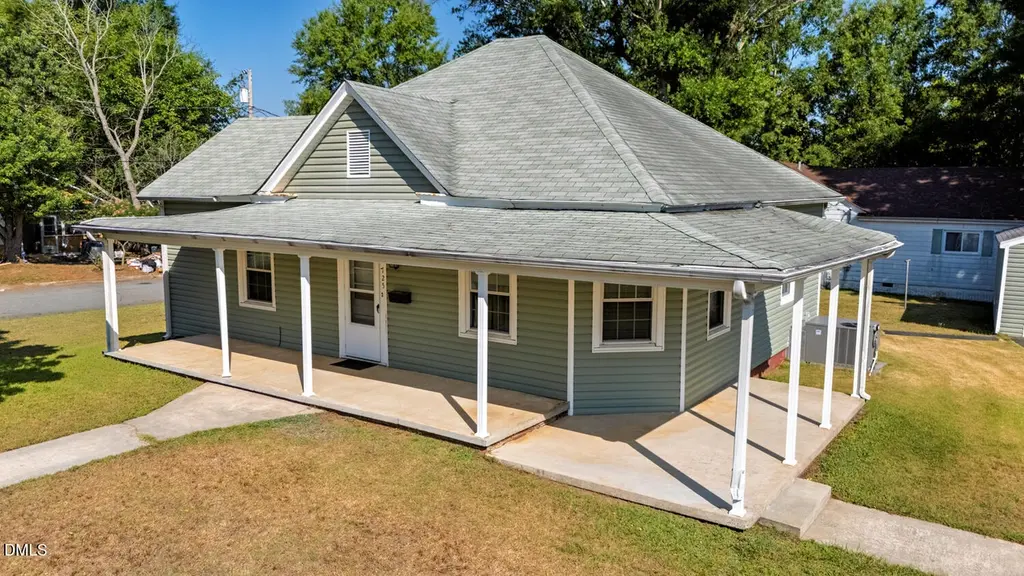
725 Everett St · Burlington, NC
Flood risk 1/10 · Minimal
- FEMA flood zone
- X (unshaded)
- Chance of flooding over 30 yrs
- 0.0%
- Est. flood insurance / yr
- $507 – $1,088
Fire risk 1/10 · Minimal
- Est. fire insurance / yr
- $906 – $1,684
Heat risk 5/10 · Moderate
- Hot days now (above 104°F)
- 7 days/yr
- Hot days in 30 yrs
- 18 days/yr
Wind risk 5/10 · Moderate
- Chance of severe wind over 30 yrs
- 21.0%
Air-quality risk 2/10 · Minimal
- Unhealthy air days now
- 2 days/yr
- Unhealthy air days in 30 yrs
- 2 days/yr
Risk factors via First Street. Map © Google.
Why this score? — see what drove the C+ grade
The composite is a weighted blend of 9 inputs, each scored 0–100. Each bar is that input's sub-score; the figure is the points it added to the 100-point composite (weight × sub-score).
- Cash flow +24.1/30.0
- ARV discount +15.0/15.0
- DSCR +7.8/10.0
- 1% rule +5.2/10.0
- Livability +3.5/5.0
- Rent growth +3.2/5.0
- Schools +3.0/10.0
- Condition / age +2.5/5.0
- Appreciation +0.0/10.0
$150,000
🖨 Deal sheet 📄 Offer letter ✓ Due diligence
Listing remarks MLS
Calling all Rehabbers and Investors! There's beauty in this Burlington beast just waiting to be unleashed! Built in 1921, this two bed/two bath property is ready for its next adventure. Open kitchen and dining flow easily into the living area and out onto the sitting porch. Two car, detached garage and ample parking on a corner lot make this one special...
Key facts
- Ample parking
- Sitting porch
- Open kitchen
Tags
Property features AI
Finance
- Other: Property in Alamance County; public maintained road access
- HOA & community: No homeowners association
Exterior
- Parking: Attached 2-car garage; Additional open parking for about 4 vehicles
- Utilities: Public water; Public sewer
- Home design: Site-built single-story home
- Construction: Vinyl siding
- Exterior features: Shingle roof; Lot approximately 0.27 acre with dimensions 111 x 104 x 117 x 98
Interior
- Bedrooms: 2 bedrooms (both on the main level)
- Flooring: Carpet; Linoleum
- Bathrooms: 2 full bathrooms
- Heating & cooling: No heating system specified; Central air conditioning
- Interior features: Carpet and linoleum flooring
Neighborhood map
What this means for you Summary
Snapshot
- This is a 2-bed/1.5-bath single-family listed at $150k.
Deal economics
- At list price, monthly cash flow is $298 ($4k/yr) — positive.
- The deal already cash-flows at list — no discount required.
- Meets the 1% rule at list price ($2k rent vs $150k).
- Cap rate 8.7% vs local median 3.6% in Burlington — top-decile yield for the area; either an underpriced asset or a hidden risk that comps aren't pricing in. Stress-test before assuming the spread holds.
Location & tenants
- Location reads 70/100 on livability (#123 in NC) — a middle-class / working-renter tenant base. Strengths: cost of living A+, housing A+, health & safety A+; Watch: commute D+, schools F, crime F.
- Alamance-Burlington Schools (rural): math 30% / reading 40% proficiency, ranked #133 of 178 in NC (top 75%) — families likely to look elsewhere, expect single-tenant / working-renter base with shorter leases.
- Market conditions: Rents rising (+2.6%/yr); 312 active listings in the ZIP; 7 comparable units currently listed for rent nearby; rentals at typical pace (median 21d on market — plan ~3-4 weeks tenant-placement turnaround); 2,466 units permitted in Alamance County in 2024 (403 in 5+ unit buildings).
Forward outlook
- Local home prices are declining (-3.0%/yr); year-one equity from $1k of loan paydown is wiped out by about $4k of value loss. Plan a longer hold.
- Alamance County population projected at +19% by 2050 — long-run rental-demand tailwind backs the buy-and-hold thesis.
Negotiation context
- Only 7 days on market — expect competitive offers; lowballing is unlikely to land.
- 2 sale attempts with the ask held roughly flat each time — persistent listings suggest the price (not the market) is what's stuck; bring a comps-based counter.
- Current owner paid $60k; list at $150k implies a 150% gain — meaningful room to come down on a strong offer.
Risks & watch-outs
- Watch-outs: built in 1921 — expect roof / HVAC / electrical / plumbing capex.
- Climate carrying-cost: moderate wind risk, 21% chance of damaging wind over 30y; extreme-heat days projected 7→18/yr by 2055 (HVAC capex compounding) — expect insurance premiums to compound above CPI over the hold.
Questions for the listing agent
- Built in 1921 — when were the roof, HVAC, electrical panel, plumbing, and water heater last replaced?
- Is there a deadline driving the sale (1031 exchange, divorce, estate, relocation)? That informs how much negotiation room exists.
- Schools are F-rated, which usually means shorter tenancies and higher turnover. Who's the typical renter profile here, and what's been the actual vacancy rate?
- Crime grade is F in this area — have there been break-ins, vandalism, or insurance claims at this property in the last 3 years? What carrier currently insures it and at what premium?
- What's the average days-on-market for RENTAL listings here right now (not sales)? A rising rental-DOM trend means longer vacancies and softer asking-rent achievability than the comps imply.
- What's the recent tenant-quality profile in this submarket — average credit score on applications, eviction rate, late-payment / NSF rate, and stable-employment percentage? A property-management company in the area should have these aggregated.
- How much new for-sale + rental construction is in the pipeline within 1–3 miles? Heavy new supply typically softens prices + rents 12–24 months out; constrained supply supports both.
Investment metrics
- 1% rule
- 1.02% ✓
- Cap rate
- 8.67%
- Cash-on-cash
- 8.51%
- DSCR
- 1.38
- GRM
- 8.2
CMA / ARV
- ARV (on-the-fly)
- $244,065
- Comps found
- 12
Show comp detail 12 sales within ~0.75 mi
| Address | Dist | Beds/Ba | Sqft | Sold | Price | $/sf | Match |
|---|---|---|---|---|---|---|---|
| 614 Tucker St | 0.18mi | 3/2.0 (+1) | 1,657 (+8%) | 9mo | $80,000 | $48 | 64 |
| 907 Kilby St | 0.14mi | 3/1.5 (+1) | 1,375 (-10%) | 9mo | $245,100 | $178 | 64 |
| 738 Everett St | 0.07mi | 3/2.0 (+1) | 1,400 (-9%) | 14mo | $245,000 | $175 | 63 |
| 719 Center Ave | 0.25mi | 3/1.5 (+1) | 1,329 (-13%) | 1mo | $285,000 | $214 | 60 |
| 516 S Flanner St | 0.28mi | 2/1.0 | 1,345 (-12%) | 16mo | $200,000 | $149 | 51 |
| 1535 Farningham Ln | 0.42mi | 3/2.5 (+1) | 1,408 (-8%) | 8mo | $250,000 | $178 | 51 |
| 118 N Anthony St | 0.62mi | 3/2.0 (+1) | 1,481 (-4%) | 16mo | $220,000 | $149 | 44 |
| 116 E Kime St | 0.58mi | 2/1.0 | 1,312 (-14%) | 3mo | $209,000 | $159 | 44 |
| 409 S Flanner St | 0.38mi | 2/1.0 | 1,348 (-12%) | 20mo | $95,000 | $70 | 43 |
| 724 Scott St | 0.45mi | 3/1.5 (+1) | 1,360 (-11%) | 17mo | $167,500 | $123 | 40 |
| 405 S Anthony St | 0.42mi | 3/1.0 (+1) | 1,358 (-12%) | 19mo | $145,000 | $107 | 38 |
| 825 Graham St | 0.75mi | 3/2.0 (+1) | 1,398 (-9%) | 14mo | $250,000 | $179 | 32 |
Match score weights: distance 35% · size 25% · config 20% · recency 20%. Top-matched comps best support the ARV.
Projected returns pro-forma
-3.0% appreciation · 2.61% rent growth · sell at horizon
- IRR
- -3.8%
- Equity multiple
- 0.86×
- Total profit
- $-5,997
- Equity at exit
- $22,365
- IRR
- 5.4%
- Equity multiple
- 1.39×
- Total profit
- $16,538
- Equity at exit
- $12,969
Cash invested: $42,000 (down + closing). Projections, not guarantees.
Landlord ↔ Tenant lean methodology
- Overall (STATE)
- 85 Strongly Landlord-Friendly
- State North Carolina
- 85 Strongly Landlord-Friendly · R+3
- County
- — inherits STATE
- City
- — inherits STATE
ZIP-level market 27215
- Rents YoY
- 2.6%
- Active inventory
- 312
- Price-to-rent
- 8.2×
Monthly cashflow live
- Estimated rent
- $1,528 high interval (Pro) →
- Mortgage (P&I)
- −$787
- Tax from tax record
- −$61 /mo · $727/yr
- Insurance
- −$62
- HOA
- −$0
- Vacancy / Maint / Mgmt
- −$321
- Net cashflow
- $298
Break-even live
UW: 25.0% down · 7.5% · 30yr · 1.5% tax · 5.0% vac · 8.0% maint · 8.0% mgmt
Financing live
Cash to close
- Down payment
- $37,500
- Closing costs
- $4,500
- Reserves months
- —
- Total cash needed
- —
Loan-product check · same deal, 3 products live
Conventional
25% down · 7.5% · 30yr
- Down + closing
- —
- Monthly P&I
- —
- Monthly cashflow
- —
- DSCR
- —
- Eligible?
- —
Personal DTI + credit; lowest rate.
DSCR
20% down · 8.5% · 30yr
- Down + closing
- —
- Monthly P&I
- —
- Monthly cashflow
- —
- DSCR
- —
- Eligible?
- —
No personal income docs; deal must DSCR.
Hard money
10% down · 12.0% · 12mo
- Down + closing
- —
- Monthly P&I
- —
- Monthly cashflow
- —
- DSCR
- —
- Eligible?
- —
Short-term bridge; refi at stabilization.
Rent comps 7 comps
| Address | Beds | Baths | Sqft | Rent | $/sqft | DOM | Units | Dist |
|---|---|---|---|---|---|---|---|---|
| 2076 Legacy Park Trl Burlington, NC | 1.0–3.0 | 1.0–2.0 | 1025 | $1,575 | $1.54 | 21d | 22 | 0.41mi |
| 830 Oxford Ln Burlington, NC | 3.0 | 1.5 | 1137 | $1,495 | $1.31 | 13d | 1 | 0.48mi |
| 1352 Snow Ct Burlington, NC | 3.0 | 2.0 | 1250 | $1,625 | $1.30 | 13d | 1 | 0.57mi |
| 116 Stagg St Burlington, NC | 3.0 | 2.0 | 1550 | $2,050 | $1.32 | 21d | 1 | 1.03mi |
| 1907 Trail Five Burlington, NC | 3.0 | 2.0 | 1100 | $1,695 | $1.54 | 21d | 1 | 1.09mi |
| 910 N Main St Unit A Burlington, NC | 2.0 | 2.0 | 1100 | $1,395 | $1.27 | 13d | 1 | 1.21mi |
| 2008 S Mebane St Burlington, NC | 2.0–3.0 | 1.5–2.0 | 1121 | $1,200 | $1.07 | 21d | 1 | 1.44mi |
Listing history 7 events
-
2026-06-19days on market $150,000 Active 7 DOM
-
2026-06-18days on market $150,000 Active 6 DOM
-
2026-06-17days on market $150,000 Active 5 DOM
-
2026-06-16days on market $150,000 Active 4 DOM
-
2026-06-15days on market $150,000 Active 3 DOM
-
2026-06-13remarks 548-char remark
-
2026-06-13$150,000 Active 1 DOM
ⓘ Source: listings_history table (triggers on properties + properties_extension) + one-shot
backfill from property_details.listing_events for pre-trigger history.
Tax reassessment forecast NC · Resets to sale price
- Current annual tax
- $727 · $61/mo
- Projected year-2 tax
- $1,230 · $102/mo
- Expected delta
- +$503/yr (+$42/mo · 69.2%)
ⓘ Screening estimate from a state-policy table — verify with the county assessor before closing.
Climate risk First Street
- Flood 1/10 Low FEMA zone X (unshaded) · 0% chance over 30 yrs
- Wildfire 1/10 Low
- Heat 5/10 Major 7 d/yr ≥104°F today · 18 d/yr by 30 yrs out
- Wind 5/10 Major 21% chance of damaging wind over 30 yrs
- Air quality 2/10 Low 2 unhealthy d/yr today · 2 by 30 yrs out
Nearby sold comps map
Loading sold comps map…
Walkable amenities ~0.75 mi
Loading nearby amenities…
Taxation est. · year 1
- Rental income
- $18,340
- − Mortgage interest
- −$8,402
- − Property taxes
- −$727
- − Insurance
- −$750
- − Repairs & maintenance
- −$1,467
- − Management
- −$1,467
- − Depreciation
- −$4,364
- Taxable income
- $1,163
- Est. tax owed @ 24.0%
- −$279
- After-tax cash flow
- $3,293/yr
For passive investors: Depreciation is non-cash, so a rental often shows a tax loss while cash-flowing — sheltering income. Rental losses are passive: they offset passive income freely, and up to $25,000/yr can offset ordinary (W-2) income if you actively participate and your MAGI is under $100k (phasing out to $0 by $150k); unused losses carry forward. On sale, claimed depreciation is recaptured at up to 25%, and gains may owe capital-gains tax (a 1031 exchange can defer both). Figures are a year-1 estimate at your 24.0% rate — not tax advice; consult a CPA.
Schools (NCES district)
- District
- Alamance-Burlington Schools
- NCES district ID
- 3700030
- Math proficiency
- 30% ▼ -6.00%
- Reading proficiency
- 40% ▲ 2.00%
- Median HH income
- $43,359
- Composite
- 29.68/100
- National rank
- #6460
- State rank
- #133 of 178 in NC
Livability — Burlington
- Score
- 70/100
- State rank
- #123
- US rank
- #7396
Category grades
Schools grade is shown separately in the Schools card above.
Census & demographics
- Census place
- Burlington, NC
- County
- Alamance County · 173,369 people
- City population
- 88,508
- Metro
- Burlington, NC
- Population (ZIP)
- 47,102
- Household income
- $68,825
- Rent vs Own
- Severe rent burden
- 1497.0
Population outlook (Alamance County) Hauer SSP2
- Today (2025)
- 173,381 people
- By 2030
- 180,609 · +4.2%
- By 2040
- 194,327 · +12.1%
- By 2050
- 206,158 · +18.9%
- By 2075
- 235,665 · +35.9%
- By 2100
- 258,626 · +49.2%
Race, ethnicity, and origin ACS 2023
- Neighborhood character
- Majority White (64%)
- Race & ethnicity
- White 64% Black 20% Hispanic / Latino 10% Two or more races 5% Asian 3%
- Hispanic origin (detail)
- Mexican 5% Puerto Rican 1%
- Common ancestry
- Slovak 3% Serbian 3% Italian 2%
- Foreign-born
- 8% · Canada, Vietnam
- Languages at home
- 88% English-only · Spanish 8% Other Indo-European 1% Other Asian/Pacific 1%
Political lean MEDSL · Alamance
- 2024 margin
- Lean R (+8.2) · D 45.4% · R 53.5% · Other 1.1%
- 2008→2024 swing
- +1.1pp toward D · 2008: -9.2pp · 2024: -8.2pp
- All cycles
- 2024: R+8.2 2020: R+8.4 2016: R+12.9 2012: R+14.1 2008: R+9.2
Not yet ingested
- Civics
- —
Market trends
- HPI YoY
- ▼ -263.87%
- Current HPI
- 224.3392
- Rent YoY
- ▲ 2.61%
- Metro
- Burlington, NC
- State GDP YoY
- ▲ 3.28%
- F500 in state
- 26
Industry mix (Fortune 500 HQ in NC)
| Industry | F500 HQs | Revenue |
|---|---|---|
| Financial Services | 2 | $213B |
|
||
| Retail | 2 | $95B |
|
||
| Industrial Conglomerate | 1 | $38B |
|
||
| Metals / Steel | 1 | $35B |
|
||
| Utilities | 1 | $30B |
|
||
| Industrial Machinery | 1 | $19B |
|
||
Price history
+150.0% since first listed3 events — show timeline
- 2026-06-12 Listed $150,000 Triad MLS
- 2026-06-12 Listed $150,000 TMLS
- 1995-03-24 Sold (Public Records) $60,000 Public Records
Property tax history
+4.3%/yrLatest (2025): $727 · +2.6% YoY. Source: county tax records.
Cash-flow waterfall
monthlySold comps — $/sqft
last 12 mo · ≤1 miLoading sold comps…