 Multi-family
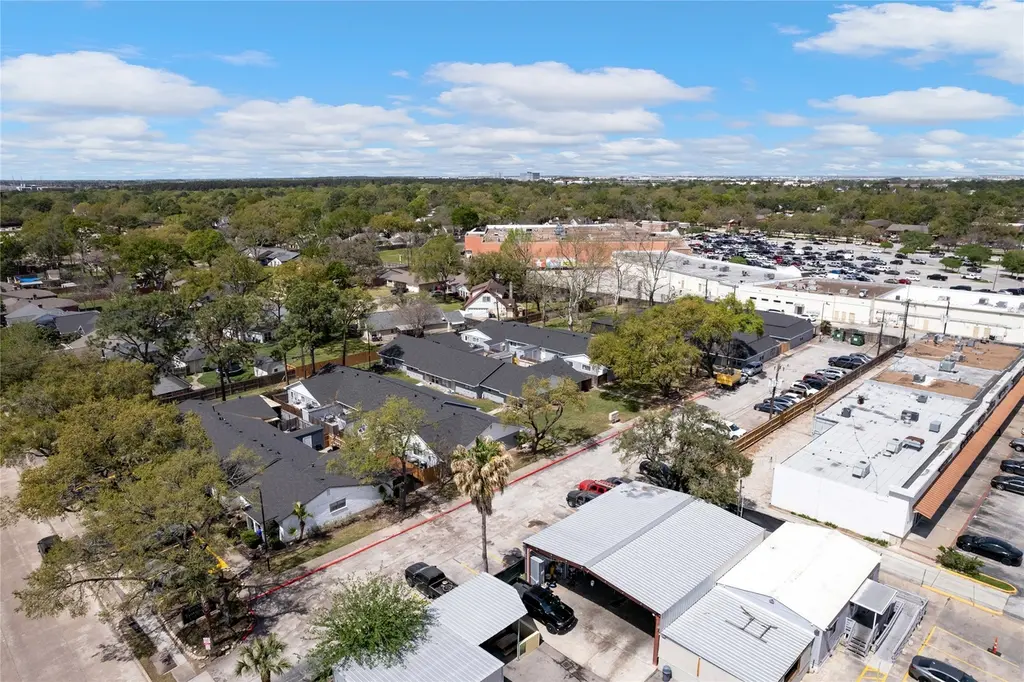
2675 Gessner Dr · Houston, TX
Flood risk 1/10 · Minimal
- FEMA flood zone
- X (unshaded)
- Chance of flooding over 30 yrs
- 0.0%
- Est. flood insurance / yr
- $507 – $1,088
Fire risk 1/10 · Minimal
- Est. fire insurance / yr
- $1,222 – $2,270
Heat risk 9/10 · Severe
- Hot days now (above 109°F)
- 7 days/yr
- Hot days in 30 yrs
- 22 days/yr
Wind risk 9/10 · Severe
- Chance of severe wind over 30 yrs
- 99.0%
Air-quality risk 3/10 · Minor
- Unhealthy air days now
- 3 days/yr
- Unhealthy air days in 30 yrs
- 3 days/yr
Risk factors via First Street. Map © Google.
Why this score? — see what drove the D+ grade
The composite is a weighted blend of 9 inputs, each scored 0–100. Each bar is that input's sub-score; the figure is the points it added to the 100-point composite (weight × sub-score).
- Cash flow +18.9/30.0
- ARV discount +7.5/15.0
- DSCR +6.0/10.0
- 1% rule +5.0/10.0
- Schools +4.1/10.0
- Livability +3.7/5.0
- Condition / age +2.5/5.0
- Rent growth +2.1/5.0
- Appreciation +0.0/10.0
$3,399,999
🖨 Deal sheet 📄 Offer letter ✓ Due diligence
Multi-family units
County records classify this as Multi-Family (2-4 Unit). Listing-text estimate: 1 unit. estimate disagrees with records
Listing remarks MLS
Property Overview: 19 units- 13:2/2- and 6: 3/2-bedroom apartments for sale in the desirable Spring Branch neighborhood. These apartments feature a new and fresh timeless design, spacious living areas, and top-tier location. Perfect for investors looking for an updated property and a solid investment opportunity. Available Units: 2-Bedroom 2 baths Apartments: Spacious and well-designed, ideal for or professionals looking for extra space. Size: 1,036 sq ft 3-Bedroom Apartments: Perfect for growing families or those in need of more space, with oversized bedrooms and high-end finishes with vinyl wood floors and quartz countertops found throughout the units. Size: 1,271 sq ft Apartment Features: -New roofs throughout complex -New Exterior building paint -New parking lot striping -Newly done landscaping -Individual hot water heaters and HVAC systems Stylish Kitchens: High-quality cabinetry, premium countertops, and energy-efficient appliances
Key facts
- New roofs
- 2.08 acre lot
- Built 1981
Tags
Neighborhood map
What this means for you Summary
Snapshot
- This is a 2-bed/2.0-bath multifamily listed at $3.40M.
Deal economics
- At list price, monthly cash flow is $3k ($42k/yr) — positive.
- The deal already cash-flows at list — no discount required.
- Meets the 1% rule at list price ($34k rent vs $3.40M).
- Recommended offer: $2.99M (12.0% below list) — sets the bar for market timing.
- Cap rate 7.5% vs local median 3.2% in Houston — top-decile yield for the area; either an underpriced asset or a hidden risk that comps aren't pricing in. Stress-test before assuming the spread holds.
Location & tenants
- Location reads 74/100 on livability (#184 in TX, #4,771 nationally) — a middle-class / working-renter tenant base. Strengths: amenities A+, cost of living A+, housing A+; Watch: schools D, crime F.
- Spring Branch ISD (urban): math 47% / reading 46% proficiency, ranked #215 of 826 in TX (top 26%) — families likely to look elsewhere, expect single-tenant / working-renter base with shorter leases.
- Market conditions: Rents soft (-1.6%/yr); 338 active listings in the ZIP; 40 comparable units currently listed for rent nearby; rentals at typical pace (median 24d on market — plan ~3-4 weeks tenant-placement turnaround); 48% of comp listings sitting > 30 days — soft ceiling on asking rent; 29,883 units permitted in Harris County in 2024 (8,621 in 5+ unit buildings).
- At $34,162/mo this rent would consume 660% of the median local household income ($62k/yr) (locally 2296% of renters already pay >50% of income on rent) — very limited rent-growth headroom before tenants either downsize or default.
Forward outlook
- Local home prices are declining (-3.0%/yr); year-one equity from $24k of loan paydown is wiped out by about $102k of value loss. Plan a longer hold.
- Harris County population projected at +47% by 2050 — long-run rental-demand tailwind backs the buy-and-hold thesis.
Negotiation context
- It's been on market 137 days — a 12% lower offer ($2.99M) is reasonable based on typical stale-listing flexibility.
- 2 sale attempts with the ask held roughly flat each time — persistent listings suggest the price (not the market) is what's stuck; bring a comps-based counter.
Risks & watch-outs
- Climate carrying-cost: severe wind risk, 99% chance of damaging wind over 30y; extreme-heat days projected 7→22/yr by 2055 (HVAC capex compounding) — expect insurance premiums to compound above CPI over the hold.
Questions for the listing agent
- It's been on market 137 days. Have you received any prior offers? Is the seller open to a 12% concession, seller financing, or rate buy-down credit?
- Why hasn't it sold? Are there any deal-killer items the seller is aware of (foundation, flood, title, zoning, code violations)?
- Is there a deadline driving the sale (1031 exchange, divorce, estate, relocation)? That informs how much negotiation room exists.
- Schools are D-rated, which usually means shorter tenancies and higher turnover. Who's the typical renter profile here, and what's been the actual vacancy rate?
- Crime grade is F in this area — have there been break-ins, vandalism, or insurance claims at this property in the last 3 years? What carrier currently insures it and at what premium?
- The area grade is low — what's the realistic commute time and amenity access for the typical tenant pool here? Any planned neighborhood developments (good or bad) we should know about?
- What's the average days-on-market for RENTAL listings here right now (not sales)? A rising rental-DOM trend means longer vacancies and softer asking-rent achievability than the comps imply.
- What's the recent tenant-quality profile in this submarket — average credit score on applications, eviction rate, late-payment / NSF rate, and stable-employment percentage? A property-management company in the area should have these aggregated.
- How much new apartment / multifamily construction is in the pipeline within 1–3 miles? Heavy new supply (>2% of stock underway) typically softens rents 12–24 months out; light construction supports rent growth.
Investment metrics
- 1% rule
- 1.00% ✓
- Cap rate
- 7.53%
- Cash-on-cash
- 4.40%
- DSCR
- 1.20
- GRM
- 8.3
CMA / ARV
No comps found within radius.
Projected returns pro-forma
-3.0% appreciation · 0.0% rent growth · sell at horizon
- IRR
- -12.9%
- Equity multiple
- 0.55×
- Total profit
- $-428,180
- Equity at exit
- $506,951
- IRR
- -9.3%
- Equity multiple
- 0.50×
- Total profit
- $-471,332
- Equity at exit
- $293,970
Cash invested: $952,000 (down + closing). Projections, not guarantees.
Landlord ↔ Tenant lean methodology
- Overall (STATE)
- 87 Strongly Landlord-Friendly
- State Texas
- 87 Strongly Landlord-Friendly · R+5
- County
- — inherits STATE
- City
- — inherits STATE
ZIP-level market 77080
- Rents YoY
- -1.6%
- Active inventory
- 338
- Price-to-rent
- 160.9×
Monthly cashflow live
- Estimated rent
- $34,162 high interval (Pro) →
- Mortgage (P&I)
- −$17,830
- Tax est. 1.5%
- −$4,250 /mo · $51,000/yr
- Insurance
- −$1,417
- HOA
- −$0
- Vacancy / Maint / Mgmt
- −$7,174
- Net cashflow
- $3,491
Break-even live
19-unit breakdown (identical units grouped — click to expand)
| Units | Beds | Baths | Est. rent |
|---|---|---|---|
| 13× units | 2 | 2 | $22,893 |
| #1 | 2 | 2 | $1,761 |
| #2 | 2 | 2 | $1,761 |
| #3 | 2 | 2 | $1,761 |
| #4 | 2 | 2 | $1,761 |
| #5 | 2 | 2 | $1,761 |
| #6 | 2 | 2 | $1,761 |
| #7 | 2 | 2 | $1,761 |
| #8 | 2 | 2 | $1,761 |
| #9 | 2 | 2 | $1,761 |
| #10 | 2 | 2 | $1,761 |
| #11 | 2 | 2 | $1,761 |
| #12 | 2 | 2 | $1,761 |
| #13 | 2 | 2 | $1,761 |
| 6× units | 3 | 2 | $11,262 |
| #14 | 3 | 2 | $1,877 |
| #15 | 3 | 2 | $1,877 |
| #16 | 3 | 2 | $1,877 |
| #17 | 3 | 2 | $1,877 |
| #18 | 3 | 2 | $1,877 |
| #19 | 3 | 2 | $1,877 |
| Total (19 units) | $34,162 | ||
UW: 25.0% down · 7.5% · 30yr · 1.5% tax · 5.0% vac · 8.0% maint · 8.0% mgmt
Financing live
Cash to close
- Down payment
- $850,000
- Closing costs
- $102,000
- Reserves months
- —
- Total cash needed
- —
Loan-product check · same deal, 3 products live
Conventional
25% down · 7.5% · 30yr
- Down + closing
- —
- Monthly P&I
- —
- Monthly cashflow
- —
- DSCR
- —
- Eligible?
- —
Personal DTI + credit; lowest rate.
DSCR
20% down · 8.5% · 30yr
- Down + closing
- —
- Monthly P&I
- —
- Monthly cashflow
- —
- DSCR
- —
- Eligible?
- —
No personal income docs; deal must DSCR.
Hard money
10% down · 12.0% · 12mo
- Down + closing
- —
- Monthly P&I
- —
- Monthly cashflow
- —
- DSCR
- —
- Eligible?
- —
Short-term bridge; refi at stabilization.
Rent comps 40 comps
| Address | Beds | Baths | Sqft | Rent | $/sqft | DOM | Units | Dist |
|---|---|---|---|---|---|---|---|---|
| 2681 Gessner Rd Houston, TX | 2.0 | 2.0 | 1036 | $1,400 | $1.35 | 43d | 1 | 0.03mi |
| 10100 Kempwood Dr Houston, TX | 1.0 | 1.0 | 886 | $1,574 | $1.78 | 1d | 28 | 0.30mi |
| 9999 Kempwood Dr Houston, TX | 1.0–2.0 | 1.0–2.0 | 932 | $1,552 | $1.66 | 43d | 31 | 0.31mi |
| 10105 Kempwood Dr Houston, TX | 1.0–3.0 | 1.0–2.0 | 925 | $1,224 | $1.32 | 2d | 24 | 0.32mi |
| 10005 Kempwood Dr Houston, TX | 2.0 | 2.0 | 1100 | $1,213 | $1.10 | 43d | 1 | 0.41mi |
| 10010 Kempwood Dr Houston, TX | 1.0–2.0 | 1.0–2.0 | 755 | $2,053 | $2.72 | 43d | 41 | 0.41mi |
| 10000 Hammerly Blvd Unit 133 Houston, TX | 1.0 | 1.0 | 910 | $1,230 | $1.35 | 24d | 1 | 0.55mi |
| 10000 Hammerly Blvd Unit 140 Houston, TX | 2.0 | 2.0 | 910 | $1,160 | $1.27 | 24d | 1 | 0.55mi |
| 10221 Centrepark Dr Unit 10242 Houston, TX | 1.0 | 1.0 | 717 | $1,032 | $1.44 | 14d | 1 | 0.67mi |
| 10221 Centrepark Dr Unit 10278 Houston, TX | 2.0 | 2.0 | 1001 | $1,198 | $1.20 | 43d | 1 | 0.67mi |
| 10221 Centrepark Dr Unit 424 Houston, TX | 2.0 | 2.0 | 1001 | $1,367 | $1.37 | 5d | 1 | 0.67mi |
| 10221 Centrepark Dr Unit 525 Houston, TX | 3.0 | 2.0 | 1386 | $2,047 | $1.48 | 2d | 1 | 0.67mi |
| 10221 Centrepark Dr Unit 1112 Houston, TX | 1.0 | 1.0 | 708 | $1,085 | $1.53 | 2d | 1 | 0.67mi |
| 10221 Centrepark Dr Unit 10295 Houston, TX | 1.0 | 1.0 | 708 | $1,127 | $1.59 | 10d | 1 | 0.67mi |
| 10221 Centrepark Dr Unit 2174 Houston, TX | 2.0 | 2.0 | 1001 | $1,391 | $1.39 | 10d | 1 | 0.67mi |
| 10221 Centrepark Dr Unit 10254 Houston, TX | 3.0 | 2.0 | 1386 | $2,014 | $1.45 | 43d | 1 | 0.67mi |
| 10221 Centrepark Dr Unit 3174 Houston, TX | 3.0 | 2.0 | 1386 | $2,090 | $1.51 | 11d | 1 | 0.67mi |
| 10221 Centrepark Dr Unit 2148 Houston, TX | 2.0 | 2.0 | 1001 | $1,359 | $1.36 | 2d | 1 | 0.67mi |
| 10221 Centrepark Dr Houston, TX | 1.0 | 1.0 | 717 | $1,027 | $1.43 | 14d | 1 | 0.70mi |
| 10580 Hammerly Blvd Houston, TX | 1.0–4.0 | 1.0–2.5 | 987 | $1,092 | $1.11 | 1d | 31 | 0.72mi |
| 10227 Centrepark Dr Houston, TX | 2.0 | 2.0 | 1148 | $1,558 | $1.36 | 43d | 1 | 0.73mi |
| 3125 Crestdale Dr Unit 1064 Houston, TX | 3.0 | 2.0 | 1400 | $1,399 | $1.00 | 43d | 1 | 0.76mi |
| 3125 Crestdale Dr Unit 1436 Houston, TX | 3.0 | 2.0 | 1450 | $1,599 | $1.10 | 43d | 1 | 0.76mi |
| 3125 Crestdale Dr Unit 2047 Houston, TX | 2.0 | 2.0 | 900 | $1,284 | $1.43 | 11d | 1 | 0.76mi |
| 3125 Crestdale Dr Unit 2346 Houston, TX | 3.0 | 2.0 | 1354 | $1,499 | $1.11 | 43d | 1 | 0.76mi |
| 3125 Crestdale Dr Unit 1362 Houston, TX | 2.0 | 2.0 | 1011 | $1,289 | $1.27 | 43d | 1 | 0.76mi |
| 3125 Crestdale Dr Unit 2523 Houston, TX | 2.0 | 2.0 | 1080 | $1,299 | $1.20 | 43d | 1 | 0.76mi |
| 3125 Crestdale Dr Unit 1006 Houston, TX | 3.0 | 2.0 | 1500 | $1,629 | $1.09 | 43d | 1 | 0.76mi |
| 3125 Crestdale Dr Unit 1091 Houston, TX | 3.0 | 2.0 | 1450 | $1,500 | $1.03 | 43d | 1 | 0.76mi |
| 3125 Crestdale Dr Unit 1006 Houston, TX | 3.0 | 2.0 | 1495 | $1,629 | $1.09 | 24d | 1 | 0.76mi |
| 3125 Crestdale Dr Unit 1185 Houston, TX | 2.0 | 2.0 | 1150 | $1,249 | $1.09 | 43d | 1 | 0.76mi |
| 3125 Crestdale Dr Unit 1057 Houston, TX | 3.0 | 2.0 | 1241 | $1,419 | $1.14 | 43d | 1 | 0.76mi |
| 10333 Clay Rd Unit 10370 Houston, TX | 2.0 | 2.0 | 1133 | $1,804 | $1.59 | 43d | 1 | 0.80mi |
| 10339 Clay Rd Unit 4054 Houston, TX | 2.0 | 2.0 | 1096 | $1,808 | $1.65 | 43d | 1 | 0.80mi |
| 10333 Clay Rd Unit 425 Houston, TX | 2.0 | 2.0 | 1133 | $1,771 | $1.56 | 2d | 1 | 0.80mi |
| 10333 Clay Rd Unit 2174 Houston, TX | 2.0 | 2.0 | 1133 | $1,803 | $1.59 | 10d | 1 | 0.80mi |
| 10333 Clay Rd Unit 424 Houston, TX | 2.0 | 2.0 | 1133 | $1,779 | $1.57 | 5d | 1 | 0.80mi |
| 3125 Crestdale Dr Houston, TX | 3.0 | 3.0 | 1400 | $1,749 | $1.25 | 43d | 1 | 0.85mi |
| 3125 Crestdale Dr Unit 424 Houston, TX | 2.0 | 2.0 | 900 | $1,249 | $1.39 | 5d | 1 | 0.91mi |
| 3125 Crestdale Dr Unit 2112 Houston, TX | 2.0 | 2.0 | 900 | $1,241 | $1.38 | 2d | 1 | 0.91mi |
Listing history 3 events
-
2026-01-09historical
Show marketing remark (972 chars)
Property Overview: 19 units- 13:2/2- and 6: 3/2-bedroom apartments for sale in the desirable Spring Branch neighborhood. These apartments feature a new and fresh timeless design, spacious living areas, and top-tier location. Perfect for investors looking for an updated property and a solid investment opportunity. Available Units: 2-Bedroom 2 baths Apartments: Spacious and well-designed, ideal for or professionals looking for extra space. Size: 1,036 sq ft 3-Bedroom Apartments: Perfect for growing families or those in need of more space, with oversized bedrooms and high-end finishes with vinyl wood floors and quartz countertops found throughout the units. Size: 1,271 sq ft Apartment Features: -New roofs throughout complex -New Exterior building paint -New parking lot striping -Newly done landscaping -Individual hot water heaters and HVAC systems Stylish Kitchens: High-quality cabinetry, premium countertops, and energy-efficient appliances
-
2026-01-09$3,399,999 Active 972-char remark
Show marketing remark (972 chars)
Property Overview: 19 units- 13:2/2- and 6: 3/2-bedroom apartments for sale in the desirable Spring Branch neighborhood. These apartments feature a new and fresh timeless design, spacious living areas, and top-tier location. Perfect for investors looking for an updated property and a solid investment opportunity. Available Units: 2-Bedroom 2 baths Apartments: Spacious and well-designed, ideal for or professionals looking for extra space. Size: 1,036 sq ft 3-Bedroom Apartments: Perfect for growing families or those in need of more space, with oversized bedrooms and high-end finishes with vinyl wood floors and quartz countertops found throughout the units. Size: 1,271 sq ft Apartment Features: -New roofs throughout complex -New Exterior building paint -New parking lot striping -Newly done landscaping -Individual hot water heaters and HVAC systems Stylish Kitchens: High-quality cabinetry, premium countertops, and energy-efficient appliances
-
2025-04-09$3,399,999 Active
ⓘ Source: listings_history table (triggers on properties + properties_extension) + one-shot
backfill from property_details.listing_events for pre-trigger history.
Climate risk First Street
- Flood 1/10 Low FEMA zone X (unshaded) · 0% chance over 30 yrs
- Wildfire 1/10 Low
- Heat 9/10 Extreme 7 d/yr ≥109°F today · 22 d/yr by 30 yrs out
- Wind 9/10 Extreme 99% chance of damaging wind over 30 yrs
- Air quality 3/10 Moderate 3 unhealthy d/yr today · 3 by 30 yrs out
Nearby sold comps map
Loading sold comps map…
Walkable amenities ~0.75 mi
Loading nearby amenities…
Taxation est. · year 1
- Rental income
- $409,944
- − Mortgage interest
- −$190,453
- − Property taxes
- −$51,000
- − Insurance
- −$17,000
- − Repairs & maintenance
- −$32,796
- − Management
- −$32,796
- − Depreciation
- −$98,909
- Taxable loss
- −$13,009
- Est. tax savings @ 24.0%
- +$3,122
- After-tax cash flow
- $45,018/yr
For passive investors: Depreciation is non-cash, so a rental often shows a tax loss while cash-flowing — sheltering income. Rental losses are passive: they offset passive income freely, and up to $25,000/yr can offset ordinary (W-2) income if you actively participate and your MAGI is under $100k (phasing out to $0 by $150k); unused losses carry forward. On sale, claimed depreciation is recaptured at up to 25%, and gains may owe capital-gains tax (a 1031 exchange can defer both). Figures are a year-1 estimate at your 24.0% rate — not tax advice; consult a CPA.
Schools (NCES district)
- District
- Spring Branch ISD
- NCES district ID
- 4841100
- Math proficiency
- 47% ▼ -4.00%
- Reading proficiency
- 46% ▼ -1.00%
- Median HH income
- $60,311
- Composite
- 40.88/100
- National rank
- #3624
- State rank
- #215 of 826 in TX
Livability — Houston
- Score
- 74/100
- State rank
- #184
- US rank
- #4771
Category grades
Schools grade is shown separately in the Schools card above.
Census & demographics
- Census place
- Houston, TX
- County
- Harris County · 4,702,590 people
- City population
- 3,226,434
- Metro
- Houston-The Woodlands-Sugar Land, TX
- Population (ZIP)
- 47,638
- Household income
- $62,134
- Rent vs Own
- Severe rent burden
- 2296.0
Population outlook (Harris County) Hauer SSP2
- Today (2025)
- 5,571,493 people
- By 2030
- 6,089,821 · +9.3%
- By 2040
- 7,142,806 · +28.2%
- By 2050
- 8,185,864 · +46.9%
- By 2075
- 10,574,329 · +89.8%
- By 2100
- 12,109,958 · +117.4%
Race, ethnicity, and origin ACS 2023
- Neighborhood character
- Predominantly Hispanic (71%)
- Race & ethnicity
- Hispanic / Latino 71% Two or more races 19% White 18% Asian 5% Black 5% Native American 1%
- Hispanic origin (detail)
- Mexican 44% Cuban 1%
- Common ancestry
- Lithuanian 2% Romanian 1% Slovak 1%
- Foreign-born
- 42% · Canada, Vietnam, South Korea
- Languages at home
- 33% English-only · Spanish 62% Vietnamese 1% Other Indo-European 1%
Political lean MEDSL · Harris
- 2024 margin
- Lean D (+5.5) · D 52.0% · R 46.4% · Other 1.6%
- 2008→2024 swing
- +3.9pp toward D · 2008: 1.6pp · 2024: 5.5pp
- All cycles
- 2024: D+5.5 2020: D+13.3 2016: D+12.4 2012: D+0.1 2008: D+1.6
Not yet ingested
- Civics
- —
Market trends
- HPI YoY
- ▼ -240.33%
- Current HPI
- 266.9663
- Rent YoY
- ▼ -1.57%
- Metro
- Houston-The Woodlands-Sugar Land, TX
- State GDP YoY
- ▲ 3.95%
- F500 in state
- 110
Industry mix (Fortune 500 HQ in TX)
| Industry | F500 HQs | Revenue |
|---|---|---|
| Energy | 16 | $1,198B |
|
||
| Technology | 5 | $198B |
|
||
| Engineering / Construction | 4 | $72B |
|
||
| Energy Services | 3 | $60B |
|
||
| Utilities | 3 | $41B |
|
||
| Healthcare | 2 | $330B |
|
||
Price history
+0.0% since first listed3 events — show timeline
- 2026-01-09 Listed $3,399,999 HARMLS
- 2026-01-09 Listing Removed — HARMLS
- 2025-04-09 Listed $3,399,999 HARMLS
Cash-flow waterfall
monthlySold comps — $/sqft
last 12 mo · ≤1 miLoading sold comps…