8852 W Mcnab Rd #205 · Tamarac, FL
Flood risk No data
- FEMA flood zone
- —
- Chance of flooding over 30 yrs
- —
- Est. flood insurance / yr
- —
Fire risk No data
- Est. fire insurance / yr
- —
Heat risk No data
- Hot days now (above threshold)
- —
- Hot days in 30 yrs
- —
Wind risk No data
- Chance of severe wind over 30 yrs
- —
Air-quality risk No data
- Unhealthy air days now
- —
- Unhealthy air days in 30 yrs
- —
Risk factors via First Street. Map © Google.
Why this score? — see what drove the C grade
The composite is a weighted blend of 9 inputs, each scored 0–100. Each bar is that input's sub-score; the figure is the points it added to the 100-point composite (weight × sub-score).
- Cash flow +21.0/30.0
- 1% rule +10.0/10.0
- ARV discount +7.5/15.0
- DSCR +6.7/10.0
- Schools +4.1/10.0
- Livability +3.8/5.0
- Condition / age +2.5/5.0
- Rent growth +2.0/5.0
- Appreciation +0.0/10.0
$135,000
🖨 Deal sheet 📄 Offer letter ✓ Due diligence
Listing remarks MLS
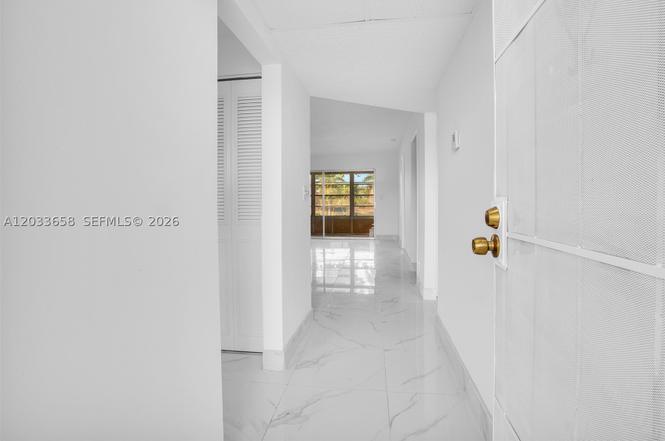
COA SAYS: 55+. BEAUTIFUL HOME. METICULOUSLY WELL MAINTAINED. NEAT. CLEAN. UNCLUTTERED AND READY TO MOVE IN. NEAR MAJOR ROADS, SHOPPING, FREEWAYS. EXCELLENT LOCATION. EASY TO SHOW. SELLER MOTIVATED! COME. SEE. SELL. LET'S MAKE A DEAL. THANK YOU FOR SHOWING OUR HOME. Text LA for showing.
Key facts
- Low hoa fees
- Fitness center
- Clubhouse
Tags
Property features AI
Finance
- Other: Pets not allowed
- HOA & community: Monthly association fee; Association covers amenities, common areas, cable TV, insurance, internet, laundry, grounds maintenance, building maintenance, pool(s), reserve fund, roof, sewer, trash, and water; Community amenities include clubhouse, fitness center, laundry, pool, and elevators; Senior community
Exterior
- Parking: Assigned parking; Guest parking; One assigned space
- Utilities: Cable available
- Home design: Condo/attached property; 2nd floor entry; 3-story building; Block construction; Resale unit
- Construction: Block construction
- Exterior features: Balcony; Screened balcony; Association pool
Interior
- Kitchen: Dishwasher; Electric range; Disposal; Icemaker; Microwave; Refrigerator; Electric water heater
- Flooring: Tile
- Bathrooms: 2 full bathrooms
- Heating & cooling: Central heating; Central air; Ceiling fans
- Interior features: Breakfast area; Elevator; Accessible elevator installed; Family/dining room; Walk-in closets
- Laundry & utility: Common area laundry
Neighborhood map
What this means for you Summary
Snapshot
- This is a 2-bed/2.0-bath condo listed at $135k.
Deal economics
- At list price, monthly cash flow is $191 ($2k/yr) — positive.
- The deal already cash-flows at list — no discount required.
- Meets the 1% rule at list price ($2k rent vs $135k).
- Cap rate 8.0% vs local median 3.9% in Tamarac — top-decile yield for the area; either an underpriced asset or a hidden risk that comps aren't pricing in. Stress-test before assuming the spread holds.
Location & tenants
- Location reads 76/100 on livability (#239 in FL, #3,785 nationally) — a middle-class / working-renter tenant base. Strengths: housing A+, health & safety A+, cost of living A-; Watch: employment C-, amenities F, commute F.
- Broward (suburban): math 42% / reading 53% proficiency, ranked #46 of 73 in FL (top 63%) — families likely to look elsewhere, expect single-tenant / working-renter base with shorter leases.
- Market conditions: Rents soft (-1.9%/yr); 588 active listings in the ZIP; 40 comparable units currently listed for rent nearby; rentals at typical pace (median 18d on market — plan ~3-4 weeks tenant-placement turnaround); 2,111 units permitted in Broward County in 2024 (1,265 in 5+ unit buildings).
- This rent runs 40% of the median local income ($62k/yr) — at the standard rent-burdened threshold; future hikes will face affordability resistance.
Forward outlook
- Local home prices are declining (-3.0%/yr); year-one equity from $933 of loan paydown is wiped out by about $4k of value loss. Plan a longer hold.
- Broward County population projected at +34% by 2050 — long-run rental-demand tailwind backs the buy-and-hold thesis.
Negotiation context
- Only 8 days on market — expect competitive offers; lowballing is unlikely to land.
- 7 sale attempts since 12y ago with the ask held roughly flat each time — persistent listings suggest the price (not the market) is what's stuck; bring a comps-based counter.
- Current owner paid $50k; list at $135k implies a 170% gain — meaningful room to come down on a strong offer.
Risks & watch-outs
- Watch-outs: HOA is 29% of rent.
Questions for the listing agent
- Built in 1974 — when were the roof, HVAC, electrical panel, plumbing, and water heater last replaced?
- What does the HOA fee cover, when was the last increase, and are there any pending special assessments or reserve-fund shortfalls?
- Any open or pending special assessments — roof, HVAC, plumbing, elevator, façade? What's the per-unit balance and payoff schedule, and is the seller paying it off at close or rolling it to the buyer?
- Is there a deadline driving the sale (1031 exchange, divorce, estate, relocation)? That informs how much negotiation room exists.
- Schools are B-rated — typically a magnet for longer-tenancy family renters. What's the average tenant stay here, and is there a school-zone premium baked into asking?
- What's the average days-on-market for RENTAL listings here right now (not sales)? A rising rental-DOM trend means longer vacancies and softer asking-rent achievability than the comps imply.
- What's the recent tenant-quality profile in this submarket — average credit score on applications, eviction rate, late-payment / NSF rate, and stable-employment percentage? A property-management company in the area should have these aggregated.
- How much new apartment / multifamily construction is in the pipeline within 1–3 miles? Heavy new supply (>2% of stock underway) typically softens rents 12–24 months out; light construction supports rent growth.
Investment metrics
- 1% rule
- 1.53% ✓
- Cap rate
- 7.99%
- Cash-on-cash
- 6.06%
- DSCR
- 1.27
- GRM
- 5.5
CMA / ARV
No comps found within radius.
Projected returns pro-forma
-3.0% appreciation · 0.0% rent growth · sell at horizon
- IRR
- -11.7%
- Equity multiple
- 0.59×
- Total profit
- $-15,414
- Equity at exit
- $20,129
- IRR
- -10.7%
- Equity multiple
- 0.48×
- Total profit
- $-19,707
- Equity at exit
- $11,672
Cash invested: $37,800 (down + closing). Projections, not guarantees.
Landlord ↔ Tenant lean methodology
- Overall (STATE)
- 87 Strongly Landlord-Friendly
- State Florida
- 87 Strongly Landlord-Friendly · R+3
- County
- — inherits STATE
- City
- — inherits STATE
ZIP-level market 33321
- Home prices YoY
- -30.4%
- Rents YoY
- -1.9%
- Active inventory
- 588
- Price-to-rent
- 5.5×
Monthly cashflow live
- Estimated rent
- $2,059 high interval (Pro) →
- Mortgage (P&I)
- −$708
- Tax from tax record
- −$74 /mo · $883/yr
- Insurance
- −$56
- HOA
- −$598
- Vacancy / Maint / Mgmt
- −$432
- Net cashflow
- $191
Break-even live
UW: 25.0% down · 7.5% · 30yr · 1.5% tax · 5.0% vac · 8.0% maint · 8.0% mgmt
Financing live
Cash to close
- Down payment
- $33,750
- Closing costs
- $4,050
- Reserves months
- —
- Total cash needed
- —
Loan-product check · same deal, 3 products live
Conventional
25% down · 7.5% · 30yr
- Down + closing
- —
- Monthly P&I
- —
- Monthly cashflow
- —
- DSCR
- —
- Eligible?
- —
Personal DTI + credit; lowest rate.
DSCR
20% down · 8.5% · 30yr
- Down + closing
- —
- Monthly P&I
- —
- Monthly cashflow
- —
- DSCR
- —
- Eligible?
- —
No personal income docs; deal must DSCR.
Hard money
10% down · 12.0% · 12mo
- Down + closing
- —
- Monthly P&I
- —
- Monthly cashflow
- —
- DSCR
- —
- Eligible?
- —
Short-term bridge; refi at stabilization.
Rent comps 40 comps
| Address | Beds | Baths | Sqft | Rent | $/sqft | DOM | Units | Dist |
|---|---|---|---|---|---|---|---|---|
| 9091 Lime Bay Blvd #212 Tamarac, FL | 1.0 | 1.0 | 700 | $1,500 | $2.14 | 10d | 1 | 0.15mi |
| 8601 W McNab Rd Tamarac, FL | 3.0 | 1.0–2.0 | 993 | $2,586 | $2.60 | 4d | 11 | 0.23mi |
| 7435 Woodmont Ter #202 Tamarac, FL | 2.0 | 2.0 | 926 | $1,850 | $2.00 | 17d | 1 | 0.38mi |
| 9301 Lime Bay Blvd Tamarac, FL | 1.0–2.0 | 1.5–2.0 | 850 | $1,800 | $2.12 | 24d | 2 | 0.39mi |
| 8310 Sands Point Blvd Unit L305 Tamarac, FL | 1.0 | 1.5 | 825 | $1,600 | $1.94 | 8d | 1 | 0.40mi |
| 7410 Woodmont Ter #204 Tamarac, FL | 2.0 | 2.0 | 926 | $1,880 | $2.03 | 15d | 1 | 0.40mi |
| 9315 Wedgewood Dr Unit B19 Tamarac, FL | 2.0 | 2.0 | 1060 | $2,495 | $2.35 | 24d | 1 | 0.42mi |
| 9330 Lime Bay Blvd #301 Tamarac, FL | 2.0 | 2.0 | 950 | $1,650 | $1.74 | 24d | 1 | 0.45mi |
| 9360 Lime Bay Blvd #314 Tamarac, FL | 1.0 | 1.5 | 750 | $1,640 | $2.19 | 15d | 1 | 0.45mi |
| 9311 Wedgewood Dr Unit A19 Tamarac, FL | 2.0 | 2.0 | 1060 | $2,500 | $2.36 | 24d | 1 | 0.47mi |
| 9234 Wedgewood Ln Unit D7 Tamarac, FL | 2.0 | 2.0 | 1060 | $2,500 | $2.36 | 24d | 1 | 0.49mi |
| 9401 Lime Bay Blvd #305 Tamarac, FL | 2.0 | 2.0 | 950 | $1,850 | $1.95 | 24d | 1 | 0.49mi |
| 8311 Sands Point Blvd Unit 106 Tamarac, FL | 1.0 | 1.5 | 825 | $1,750 | $2.12 | 8d | 1 | 0.50mi |
| 8301 Sands Point Blvd Unit 306S Tamarac, FL | 1.0 | 1.5 | 850 | $1,650 | $1.94 | 18d | 1 | 0.53mi |
| 9499 W McNab Rd #208 Tamarac, FL | 2.0 | 2.0 | 820 | $2,050 | $2.50 | 22d | 1 | 0.57mi |
| 8650 NW 61st St Tamarac, FL | 2.0 | 1.0 | 925 | $2,881 | $3.11 | 19d | 1 | 0.60mi |
| 8650 NW 61st St Tamarac, FL | 1.0–2.0 | 1.0 | 866 | $2,524 | $2.91 | 2d | 17 | 0.60mi |
| 8650 NW 61st St Tamarac, FL | 2.0 | 1.0 | 925 | $3,870 | $4.18 | 24d | 1 | 0.60mi |
| 9608 W McNab Rd #103 Tamarac, FL | 2.0 | 2.0 | 820 | $1,750 | $2.13 | 22d | 1 | 0.66mi |
| 8405 NW 61st St Unit D305 Tamarac, FL | 2.0 | 2.0 | 1040 | $1,770 | $1.70 | 8d | 1 | 0.67mi |
| 7640 Westwood Dr Tamarac, FL | 2.0–3.0 | 2.0 | 1169 | $1,850 | $1.58 | 17d | 2 | 0.71mi |
| 7630 Westwood Dr #327 Tamarac, FL | 1.0 | 1.0 | 741 | $1,550 | $2.09 | 15d | 1 | 0.71mi |
| 7630 Westwood Dr #327 Tamarac, FL | 1.0 | 1.0 | 741 | $1,550 | $2.09 | 2d | 1 | 0.71mi |
| 8060 Colony Cir N Tamarac, FL | 1.0 | 1.5 | 750 | $1,600 | $2.13 | 18d | 2 | 0.72mi |
| 8050 W McNab Rd #206 Tamarac, FL | 2.0 | 2.0 | 1040 | $1,890 | $1.82 | 8d | 1 | 0.72mi |
| 8050 W McNab Rd #206 Tamarac, FL | 2.0 | 2.0 | 1040 | $1,890 | $1.82 | 14d | 1 | 0.72mi |
| 8060 Colony Cir N #208 Tamarac, FL | 1.0 | 1.5 | 750 | $1,700 | $2.27 | 15d | 1 | 0.72mi |
| 8051 S Colony Cir Apt S205 Tamarac, FL | 2.0 | 2.0 | 949 | $1,650 | $1.74 | 4d | 1 | 0.74mi |
| 9065 Preston Pl Unit 16202 Tamarac, FL | 2.0 | 2.0 | 1036 | $2,650 | $2.56 | 24d | 1 | 0.75mi |
| 9070 Preston Pl #9070 Tamarac, FL | 2.0 | 2.0 | 1036 | $2,500 | $2.41 | 22d | 1 | 0.76mi |
| 8000 Lagos De Campo Blvd Unit A-307 Tamarac, FL | 2.0 | 2.0 | 1078 | $2,250 | $2.09 | 21d | 1 | 0.77mi |
| 8000 Lagos De Campo Blvd Unit A-303 Tamarac, FL | 1.0 | 1.5 | 746 | $1,775 | $2.38 | 24d | 1 | 0.77mi |
| 7670 Westwood Dr #703 Tamarac, FL | 2.0 | 2.0 | 984 | $1,850 | $1.88 | 24d | 1 | 0.79mi |
| 7610 Westwood Dr Tamarac, FL | 2.0–3.0 | 2.0 | 1017 | $1,980 | $1.95 | 17d | 1 | 0.80mi |
| 5819 Hampton Hills Blvd Tamarac, FL | 2.0 | 2.0 | 1077 | $2,450 | $2.27 | 20d | 1 | 0.80mi |
| 8002 Lagos de Campo Blvd Unit 101B Tamarac, FL | 2.0 | 2.0 | 1078 | $2,200 | $2.04 | 24d | 1 | 0.81mi |
| 7950 W McNab Rd #214 Tamarac, FL | 2.0 | 2.0 | 1040 | $1,950 | $1.88 | 4d | 1 | 0.81mi |
| 9064 Plymouth Pl #9064 Tamarac, FL | 2.0 | 2.0 | 1036 | $2,550 | $2.46 | 21d | 1 | 0.82mi |
| 8800 NW 78th Ct Tamarac, FL | 1.0–2.0 | 1.0–2.0 | 910 | $2,337 | $2.57 | 2d | 15 | 0.82mi |
| 8000 Colony Cir S #305 Tamarac, FL | 2.0 | 2.0 | 949 | $1,800 | $1.90 | 8d | 1 | 0.83mi |
HOA detail condo
- Monthly dues
- $598 · $7,176/yr
- Assessments
- None detected in remarks — confirm with the listing agent.
Listing history 6 events
-
2026-06-18days on market $135,000 Active 8 DOM
-
2026-06-17days on market $135,000 Active 7 DOM
-
2026-06-16days on market $135,000 Active 6 DOM
-
2026-06-15days on market $135,000 Active 5 DOM
-
2026-06-13remarks 699-char remark
-
2026-06-13$135,000 Active 3 DOM
ⓘ Source: listings_history table (triggers on properties + properties_extension) + one-shot
backfill from property_details.listing_events for pre-trigger history.
Tax reassessment forecast FL · Resets to sale price
- Current annual tax
- $883 · $74/mo
- Projected year-2 tax
- $1,120 · $93/mo
- Expected delta
- +$238/yr (+$20/mo · 26.9%)
ⓘ Screening estimate from a state-policy table — verify with the county assessor before closing.
Nearby sold comps map
Loading sold comps map…
Walkable amenities ~0.75 mi
Loading nearby amenities…
Taxation est. · year 1
- Rental income
- $24,709
- − Mortgage interest
- −$7,562
- − Property taxes
- −$883
- − Insurance
- −$675
- − Repairs & maintenance
- −$1,977
- − Management
- −$1,977
- − HOA
- −$7,176
- − Depreciation
- −$3,927
- Taxable income
- $532
- Est. tax owed @ 24.0%
- −$128
- After-tax cash flow
- $2,163/yr
For passive investors: Depreciation is non-cash, so a rental often shows a tax loss while cash-flowing — sheltering income. Rental losses are passive: they offset passive income freely, and up to $25,000/yr can offset ordinary (W-2) income if you actively participate and your MAGI is under $100k (phasing out to $0 by $150k); unused losses carry forward. On sale, claimed depreciation is recaptured at up to 25%, and gains may owe capital-gains tax (a 1031 exchange can defer both). Figures are a year-1 estimate at your 24.0% rate — not tax advice; consult a CPA.
Schools (NCES district)
- District
- Broward
- NCES district ID
- 1200180
- Math proficiency
- 42% ▼ -18.00%
- Reading proficiency
- 53% ▼ -5.00%
- Median HH income
- $52,139
- Composite
- 40.88/100
- National rank
- #3621
- State rank
- #46 of 73 in FL
Livability — Tamarac
- Score
- 76/100
- State rank
- #239
- US rank
- #3785
Category grades
Schools grade is shown separately in the Schools card above.
Census & demographics
- Census place
- Tamarac, FL
- County
- Broward County · 1,963,430 people
- City population
- 105,666
- Metro
- Miami-Fort Lauderdale-Pompano Beach, FL
- Population (ZIP)
- 51,216
- Household income
- $62,066
- Rent vs Own
- Severe rent burden
- 1394.0
Population outlook (Broward County) Hauer SSP2
- Today (2025)
- 2,207,033 people
- By 2030
- 2,360,704 · +7.0%
- By 2040
- 2,661,208 · +20.6%
- By 2050
- 2,946,698 · +33.5%
- By 2075
- 3,602,273 · +63.2%
- By 2100
- 3,970,984 · +79.9%
Race, ethnicity, and origin ACS 2023
- Neighborhood character
- Highly diverse neighborhood (Simpson 0.70)
- Race & ethnicity
- Hispanic / Latino 34% White 33% Black 27% Two or more races 20% Asian 3%
- Hispanic origin (detail)
- Mexican 2% Puerto Rican 5% Cuban 5% Dominican 3%
- Common ancestry
- Romanian 3% Hispanic 3% Scotch-Irish 2%
- Foreign-born
- 38% · Canada, Jamaica, Dominican Republic
- Languages at home
- 63% English-only · Spanish 29% French/Haitian/Cajun 4% Other Indo-European 1%
Political lean MEDSL · Broward
- 2024 margin
- D (+17.0) · D 58.0% · R 41.0%
- 2008→2024 swing
- -17.8pp toward R · 2008: 34.7pp · 2024: 17.0pp
- All cycles
- 2024: D+17.0 2020: D+29.8 2016: D+35.0 2012: D+34.9 2008: D+34.7
Not yet ingested
- Civics
- —
Market trends
- HPI YoY
- ▼ -158.63%
- Current HPI
- 362.2989
- Rent YoY
- ▼ -1.86%
- Metro
- Miami-Fort Lauderdale-Pompano Beach, FL
- State GDP YoY
- ▲ 3.28%
- F500 in state
- 36
Industry mix (Fortune 500 HQ in FL)
| Industry | F500 HQs | Revenue |
|---|---|---|
| Industrial Technology | 2 | $29B |
|
||
| Insurance | 2 | $17B |
|
||
| Retail | 1 | $60B |
|
||
| Technology Distribution | 1 | $58B |
|
||
| Homebuilding | 1 | $35B |
|
||
| Technology Manufacturing | 1 | $35B |
|
||
Price history
+335.5% since first listed17 events — show timeline
- 2026-05-22 Listed $135,000 MARMLS
- 2015-05-06 Sold (Public Records) $50,000 Public Records
- 2015-05-06 Sold (MLS) $50,000 MARMLS
- 2015-04-21 Pending — MARMLS
- 2015-03-25 Listing Removed — MARMLS
- 2015-03-25 Listed $52,500 MARMLS
- 2015-03-09 Relisted — MARMLS
- 2015-03-06 Listing Removed — MARMLS
- 2014-12-17 Relisted — MARMLS
- 2014-11-24 Listing Removed — MARMLS
- 2014-10-31 Relisted — MARMLS
- 2014-10-22 Pending — MARMLS
- 2014-09-03 Relisted — MARMLS
- 2014-08-19 Pending — MARMLS
- 2014-07-19 Listed $54,900 MARMLS
- 2003-10-06 Sold (Public Records) $58,000 Public Records
- 1997-07-23 Sold (Public Records) $31,000 Public Records
Property tax history
+9.0%/yrLatest (2025): $883 · +5.2% YoY. Source: county tax records.
Cash-flow waterfall
monthlySold comps — $/sqft
last 12 mo · ≤1 miLoading sold comps…