 Duplex
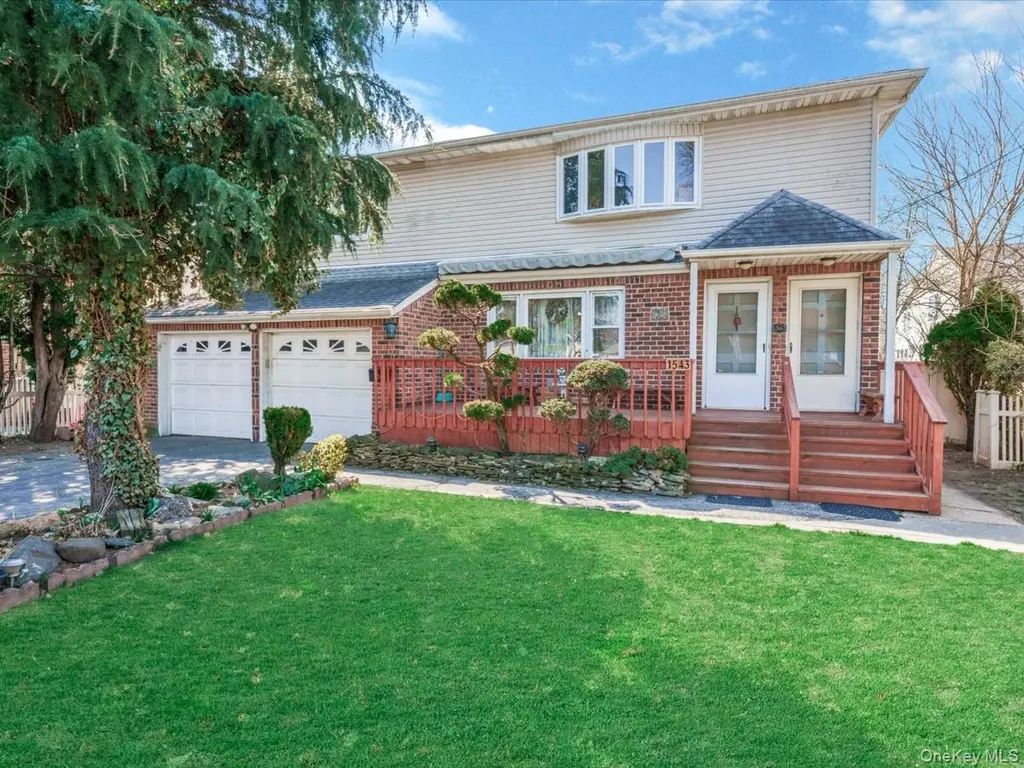
1543 Sweetman Ave · Elmont, NY
Flood risk 6/10 · Moderate
- FEMA flood zone
- X (unshaded)
- Chance of flooding over 30 yrs
- 0.7%
- Est. flood insurance / yr
- $473 – $860
Fire risk 1/10 · Minimal
- Est. fire insurance / yr
- $691 – $1,283
Heat risk 6/10 · Moderate
- Hot days now (above 97°F)
- 7 days/yr
- Hot days in 30 yrs
- 16 days/yr
Wind risk 6/10 · Moderate
- Chance of severe wind over 30 yrs
- 54.0%
Air-quality risk 3/10 · Minor
- Unhealthy air days now
- 4 days/yr
- Unhealthy air days in 30 yrs
- 4 days/yr
Risk factors via First Street. Map © Google.
Why this score? — see what drove the F grade
The composite is a weighted blend of 9 inputs, each scored 0–100. Each bar is that input's sub-score; the figure is the points it added to the 100-point composite (weight × sub-score).
- ARV discount +7.5/15.0
- Schools +7.2/10.0
- Cash flow +6.8/30.0
- Livability +4.0/5.0
- Rent growth +2.5/5.0
- Condition / age +2.5/5.0
- 1% rule +1.7/10.0
- DSCR +1.1/10.0
- Appreciation +0.0/10.0
$1,149,000
🖨 Deal sheet (PDF) 📄 Offer letter ✓ Due diligence
Multi-family units
County records classify this as Multi-Family (2-4 Unit). Listing-text estimate: 2 units. confirmed
Listing remarks
Rare opportunity to own a spacious South-Facing Legal Two-Family offering exceptional flexibility, strong income potential, and multigenerational living options. Whether you're looking to offset your mortgage with rental income, accommodate extended family, or add a valuable asset to your portfolio, this property delivers a unique combination of space, versatility, and upside rarely found in the area. The upper level is in move-in condition and features a legal expansion with an extended living area and en-suite configuration, enhancing both comfort and long-term value. The main level offers generous living space with a flexible layout ready for your personal vision and updates. The fully f
Key facts
- Flexible layout
- Extended living area
- Legal expansion
Tags
Property features AI
Exterior
- Parking: Covered carport (4 spaces); Detached/attached garage with 2 spaces and garage door opener; Driveway; Total parking for 6 vehicles
- Utilities: PSEG electric provider; Public sewer; Electricity available; Phone connected; Sewer connected; Trash collection (public); Water connected
- Home design: Duplex; Updated/remodeled condition
- Construction: Brick, frame, shingle siding and vinyl siding exterior; Concrete perimeter foundation; Other structures: carport(s) and garage(s); Crawl attic; Finished full basement with walk-out access
- Exterior features: Mailbox; Back yard; Front yard; Near public transit; Near shops
Interior
- Kitchen: Eat-in kitchen
- Bedrooms: Two 3-bedroom units
- Flooring: Hardwood floors; Tile floors
- Bathrooms: Three full bathrooms
- Heating & cooling: Natural gas heating; Solar heating; Wall/window air conditioning units
- Interior features: First-floor bedroom; First-floor full bathroom; Eat-in kitchen; Primary bathroom
- Laundry & utility: Laundry in basement; Gas dryer hookup
Neighborhood map
What this means for you Summary
Snapshot
- This is a 2 × 3-bed/3.0-bath units multifamily listed at $1.15M.
Deal economics
- At list price, monthly cash flow is $-2k ($-21k/yr) — negative. Per door: $-885/mo.
- To cash-flow at today's rent, offer at most $836k (27.2% below list).
- To meet the 1% rule (rent ≥ 1% of price), the offer needs to be $770k (33.0% below list).
- Recommended offer: $770k (33.0% below list) — sets the bar for 1% rule.
- Cap rate 4.4% vs local median 3.1% in Elmont — top-decile yield for the area; either an underpriced asset or a hidden risk that comps aren't pricing in. Stress-test before assuming the spread holds.
Location & tenants
- Location reads 79/100 on livability (#134 in NY, #2,127 nationally) — a middle-class / working-renter tenant base. Strengths: commute A+, employment A+, housing A+; Watch: cost of living F.
- Sewanhaka Central High School District (suburban): math 76% / reading 83% proficiency, ranked #43 of 590 in NY (top 7%) — strong family-tenant draw, lease renewals of 3-5y typical; only 19% free/reduced lunch — higher-income household profile.
- Zoned schools: Sewanhaka High School (math 70% / reading 77%, grade B+, #663 of 1,100 statewide, top 60%, 1,637 students, 50% FRL) — zoned schools average 50% FRL vs 19% district-wide (31 pts higher); higher-poverty schools than district average — tighter screening recommended.
- Market conditions: 141 active listings in the ZIP; 1 comparable units currently listed for rent nearby; 824 units permitted in Nassau County in 2024 (153 in 5+ unit buildings).
Forward outlook
- Local home prices are declining (-3.0%/yr); year-one equity from $8k of loan paydown is wiped out by about $34k of value loss. Plan a longer hold.
- Nassau County population projected at +7% by 2050 — modest demand growth; plan on rents tracking national, not racing it.
Negotiation context
- It's been on market 56 days — a 3% lower offer ($1.11M) is reasonable based on typical stale-listing flexibility.
- 2 sale attempts with the ask held roughly flat each time — persistent listings suggest the price (not the market) is what's stuck; bring a comps-based counter.
- Current owner paid $263k; list at $1.15M implies a 337% gain — meaningful room to come down on a strong offer.
Risks & watch-outs
- Climate carrying-cost: major flood risk; major wind risk, 54% chance of damaging wind over 30y; extreme-heat days projected 7→16/yr by 2055 (HVAC capex compounding) — expect insurance premiums to compound above CPI over the hold.
Questions for the listing agent
- What do current leases actually rent for vs. the listed asking? Can we see a recent rent roll and the last 12 months of T-12 income?
- It's been on market 56 days. Have you received any prior offers? Is the seller open to a 33% concession, seller financing, or rate buy-down credit?
- Can we see the unit-by-unit rent roll, current vacancy, and any below-market leases? What's the average tenancy length?
- What capital expenditures (roof, boiler, parking lot, exteriors) have been made in the last 5 years, and what's planned in the next 2?
- Built in 1966 — when were the roof, HVAC, electrical panel, plumbing, and water heater last replaced?
- Is there a deadline driving the sale (1031 exchange, divorce, estate, relocation)? That informs how much negotiation room exists.
- Schools are B-rated — typically a magnet for longer-tenancy family renters. What's the average tenant stay here, and is there a school-zone premium baked into asking?
- The area grade is low — what's the realistic commute time and amenity access for the typical tenant pool here? Any planned neighborhood developments (good or bad) we should know about?
- What's the average days-on-market for RENTAL listings here right now (not sales)? A rising rental-DOM trend means longer vacancies and softer asking-rent achievability than the comps imply.
- What's the recent tenant-quality profile in this submarket — average credit score on applications, eviction rate, late-payment / NSF rate, and stable-employment percentage? A property-management company in the area should have these aggregated.
- How much new apartment / multifamily construction is in the pipeline within 1–3 miles? Heavy new supply (>2% of stock underway) typically softens rents 12–24 months out; light construction supports rent growth.
Investment metrics
- 1% rule
- 0.67% ✗
- Cap rate
- 4.44%
- Cash-on-cash
- -6.60%
- DSCR
- 0.71
- GRM
- 12.4
CMA / ARV
No comps found within radius.
Projected returns pro-forma
-3.0% appreciation · 3.0% rent growth · sell at horizon
- IRR
- -27.7%
- Equity multiple
- 0.07×
- Total profit
- $-298,846
- Equity at exit
- $171,320
- IRR
- -26.2%
- Equity multiple
- -0.26×
- Total profit
- $-405,129
- Equity at exit
- $99,345
Cash invested: $321,720 (down + closing). Projections, not guarantees.
Landlord ↔ Tenant lean methodology
- Overall (STATE)
- 15 Strongly Tenant-Friendly
- State New York
- 15 Strongly Tenant-Friendly · D+10
- County
- — inherits STATE
- City
- — inherits STATE
ZIP-level market 11003
- Active inventory
- 141
- Price-to-rent
- 24.9×
Monthly cashflow live
- Estimated rent
- $7,695 high interval (Pro) →
- Mortgage (P&I)
- −$6,025
- Tax from tax record
- −$1,345 /mo · $16,135/yr
- Insurance
- −$479
- HOA
- −$0
- Vacancy / Maint / Mgmt
- −$1,616
- Net cashflow
- $-1,770
Break-even live
Sensitivity live
| Price | -10% $-1,119 | -5% $-1,445 | +0% $-1,770 | +5% $-2,095 | +10% $-2,420 |
|---|---|---|---|---|---|
| Rent | -10% $-2,378 | -5% $-2,074 | +0% $-1,770 | +5% $-1,466 | +10% $-1,162 |
| Rate | -1.0pp $-1,191 | -0.5pp $-1,478 | base $-1,770 | +0.5pp $-2,068 | +1.0pp $-2,370 |
2-unit breakdown (identical units grouped — click to expand)
| Units | Beds | Baths | Est. rent |
|---|---|---|---|
| 2× units | 3 | 3 | $7,694 |
| #1 | 3 | 3 | $3,847 |
| #2 | 3 | 3 | $3,847 |
| Total (2 units) | $7,695 | ||
UW: 25.0% down · 7.5% · 30yr · 1.5% tax · 5.0% vac · 8.0% maint · 8.0% mgmt
Financing live
Cash to close
- Down payment
- $287,250
- Closing costs
- $34,470
- Reserves months
- —
- Total cash needed
- —
Loan-product check · same deal, 3 products live
Conventional
25% down · 7.5% · 30yr
- Down + closing
- —
- Monthly P&I
- —
- Monthly cashflow
- —
- DSCR
- —
- Eligible?
- —
Personal DTI + credit; lowest rate.
DSCR
20% down · 8.5% · 30yr
- Down + closing
- —
- Monthly P&I
- —
- Monthly cashflow
- —
- DSCR
- —
- Eligible?
- —
No personal income docs; deal must DSCR.
Hard money
10% down · 12.0% · 12mo
- Down + closing
- —
- Monthly P&I
- —
- Monthly cashflow
- —
- DSCR
- —
- Eligible?
- —
Short-term bridge; refi at stabilization.
Rent comps 1 comps
| Address | Beds | Baths | Sqft | Rent | $/sqft | DOM | Units | Dist |
|---|---|---|---|---|---|---|---|---|
| 1016 Oaks Dr Franklin Square, NY | 5.0 | 2.0 | 2026 | $4,500 | $2.22 | 0d | 1 | 1.03mi |
Listing history 15 events
-
2026-06-21days on market $1,149,000 Active 56 DOM
-
2026-06-18days on market $1,149,000 Active 53 DOM
-
2026-06-17days on market $1,149,000 Active 52 DOM
-
2026-06-16days on market $1,149,000 Active 51 DOM
-
2026-06-16pricedays on market $1,149,000 Active 50 DOM
-
2026-06-04days on market $1,200,000 Active 49 DOM
-
2026-06-03days on market $1,200,000 Active 48 DOM
-
2026-06-02days on market $1,200,000 Active 47 DOM
-
2026-06-01days on market $1,200,000 Active 46 DOM
-
2026-05-31days on market $1,200,000 Active 45 DOM
-
2026-04-16historical
-
2026-04-16$1,200,000 Active
-
2026-04-16$1,200,000 Active
-
2026-04-07historical
-
1990-10-24soldstatus $263,000
ⓘ Source: listings_history table (triggers on properties + properties_extension) + one-shot
backfill from property_details.listing_events for pre-trigger history.
Tax reassessment forecast NY · Partial reset (capped growth)
- Current annual tax
- $16,135 · $1,345/mo
- Projected year-2 tax
- $17,777 · $1,481/mo
- Expected delta
- +$1,641/yr (+$137/mo · 10.2%)
ⓘ Screening estimate from a state-policy table — verify with the county assessor before closing.
Climate risk First Street
- Flood 6/10 Major FEMA zone X (unshaded) · 70% chance over 30 yrs
- Wildfire 1/10 Low
- Heat 6/10 Major 7 d/yr ≥97°F today · 16 d/yr by 30 yrs out
- Wind 6/10 Major 54% chance of damaging wind over 30 yrs
- Air quality 3/10 Moderate 4 unhealthy d/yr today · 4 by 30 yrs out
Nearby sold comps map
Loading sold comps map…
Walkable amenities ~0.75 mi
Loading nearby amenities…
Taxation est. · year 1
- Rental income
- $92,340
- − Mortgage interest
- −$64,362
- − Property taxes
- −$16,135
- − Insurance
- −$5,745
- − Repairs & maintenance
- −$7,387
- − Management
- −$7,387
- − Depreciation
- −$33,425
- Taxable loss
- −$42,102
- Est. tax savings @ 24.0%
- +$10,104
- After-tax cash flow
- $-11,133/yr
For passive investors: Depreciation is non-cash, so a rental often shows a tax loss while cash-flowing — sheltering income. Rental losses are passive: they offset passive income freely, and up to $25,000/yr can offset ordinary (W-2) income if you actively participate and your MAGI is under $100k (phasing out to $0 by $150k); unused losses carry forward. On sale, claimed depreciation is recaptured at up to 25%, and gains may owe capital-gains tax (a 1031 exchange can defer both). Figures are a year-1 estimate at your 24.0% rate — not tax advice; consult a CPA.
Schools (NCES district)
- District
- Sewanhaka Central High School District
- NCES district ID
- 3626520
- Math proficiency
- 76% ▬ 0.00%
- Reading proficiency
- 83% ▲ 9.00%
- Median HH income
- $95,771
- Composite
- 71.6/100
- National rank
- #220
- State rank
- #43 of 590 in NY
Livability — Elmont
- Score
- 79/100
- State rank
- #134
- US rank
- #2127
Category grades
Schools grade is shown separately in the Schools card above.
Census & demographics
- Census place
- Elmont, NY
- City population
- 44,716
- Population (ZIP)
- 44,716
Population outlook (Nassau County) Hauer SSP2
- Today (2025)
- 1,409,302 people
- By 2030
- 1,431,482 · +1.6%
- By 2040
- 1,471,607 · +4.4%
- By 2050
- 1,502,845 · +6.6%
- By 2075
- 1,575,403 · +11.8%
- By 2100
- 1,554,356 · +10.3%
Race, ethnicity, and origin ACS 2023
- Neighborhood character
- Highly diverse neighborhood (Simpson 0.74)
- Race & ethnicity
- Black 41% Hispanic / Latino 22% Asian 17% White 14% Two or more races 11%
- Hispanic origin (detail)
- Mexican 2% Puerto Rican 4% Dominican 2%
- Common ancestry
- Hispanic 12% Romanian 1%
- Foreign-born
- 43% · Canada, Jamaica, China
- Languages at home
- 53% English-only · Spanish 19% French/Haitian/Cajun 10% Other Indo-European 8%
Political lean MEDSL · Nassau
- 2024 margin
- Toss-up / Even · D 47.9% · R 52.1%
- 2008→2024 swing
- -12.6pp toward R · 2008: 8.4pp · 2024: -4.2pp
- All cycles
- 2024: R+4.2 2020: D+9.5 2016: D+5.3 2012: D+6.7 2008: D+8.4
Not yet ingested
- Civics
- —
Market trends
- HPI YoY
- ▼ -654.86%
- Current HPI
- 346.1523
- Rent YoY
- —
- Metro
- —
- State GDP YoY
- ▲ 2.60%
- F500 in state
- 92
Industry mix (Fortune 500 HQ in NY)
| Industry | F500 HQs | Revenue |
|---|---|---|
| Financial Services | 10 | $950B |
|
||
| Consumer Goods | 9 | $162B |
|
||
| Insurance | 4 | $225B |
|
||
| Telecommunications | 2 | $144B |
|
||
| Pharmaceuticals | 2 | $112B |
|
||
| Media / Entertainment | 2 | $69B |
|
||
Price history
+356.3% since first listed5 events — show timeline
- 2026-04-16 Listed $1,200,000 OneKey® MLS as Distributed by MLS Grid
- 2026-04-16 Listing Removed — OneKey® MLS as Distributed by MLS Grid
- 2026-04-16 Listed $1,200,000 OneKey® MLS as Distributed by MLS Grid
- 2026-04-07 Coming Soon — OneKey® MLS as Distributed by MLS Grid
- 1990-10-24 Sold (Public Records) $263,000 Public Records
Property tax history
+2.4%/yrLatest (2024): $16,135 · +1.7% YoY. Source: county tax records.
Cash-flow waterfall
monthlySold comps — $/sqft
last 12 mo · ≤1 miLoading sold comps…