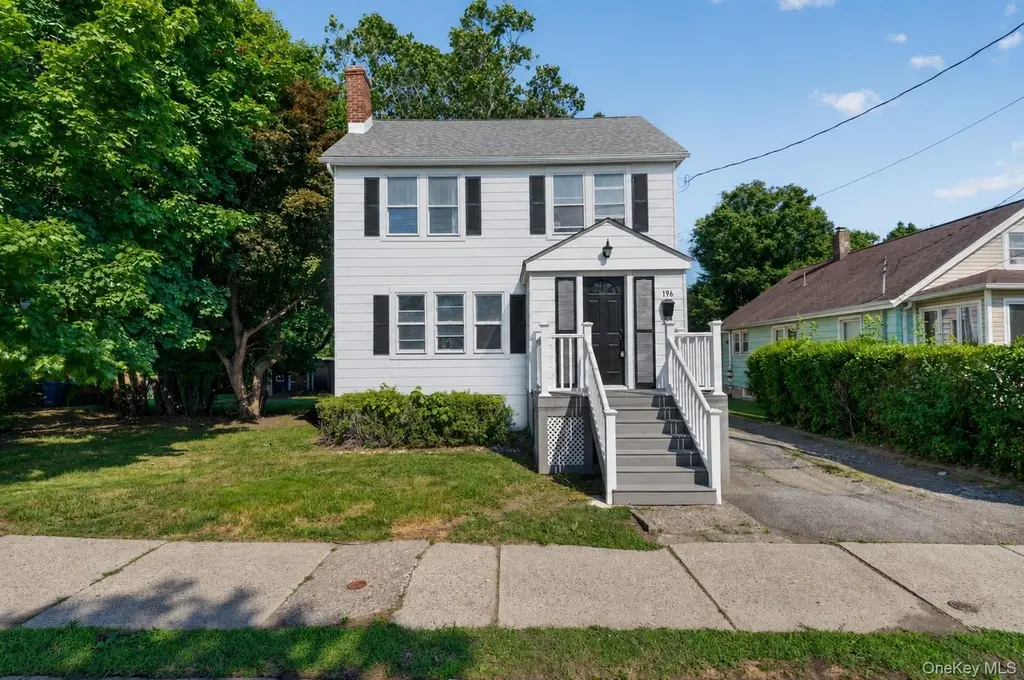
196 Cottage St · Middletown, NY
Flood risk 1/10 · Minimal
- FEMA flood zone
- X (unshaded)
- Chance of flooding over 30 yrs
- 0.0%
- Est. flood insurance / yr
- $473 – $860
Fire risk 1/10 · Minimal
- Est. fire insurance / yr
- $691 – $1,283
Heat risk 4/10 · Minor
- Hot days now (above 100°F)
- 7 days/yr
- Hot days in 30 yrs
- 15 days/yr
Wind risk 4/10 · Minor
- Chance of severe wind over 30 yrs
- 10.0%
Air-quality risk 2/10 · Minimal
- Unhealthy air days now
- 1 days/yr
- Unhealthy air days in 30 yrs
- 2 days/yr
Risk factors via First Street. Map © Google.
Why this score? — see what drove the B- grade
The composite is a weighted blend of 9 inputs, each scored 0–100. Each bar is that input's sub-score; the figure is the points it added to the 100-point composite (weight × sub-score).
- Cash flow +26.0/30.0
- ARV discount +10.8/15.0
- DSCR +8.7/10.0
- 1% rule +7.0/10.0
- Rent growth +4.6/5.0
- Schools +4.2/10.0
- Livability +4.1/5.0
- Condition / age +2.5/5.0
- Appreciation +0.0/10.0
$299,900
🖨 Deal sheet 📄 Offer letter ✓ Due diligence
Listing remarks
Move right into this beautifully updated Middletown home! Recent improvements include a brand-new bathroom, refinished hardwood floors, fresh interior and exterior paint, and new lighting and fixtures throughout. The home offers a bright and functional layout, a full unfinished basement, and a walk-up attic providing abundant storage and future potential. A newer roof adds additional value and peace of mind. Conveniently located near shopping, dining, schools, and major commuter routes. A great opportunity for owner-occupants and investors alike!
Key facts
- New lighting
- New bathroom
- Fresh interior paint
Tags
Property features AI
Exterior
- Parking: Driveway
- Utilities: Public sewer; Electricity connected; Natural gas connected; Water connected; Public trash collection
- Home design: Single family residence; Living area per public records
- Construction: Frame construction
- Exterior features: Frame construction; Not waterfront
Interior
- Kitchen: Gas oven; Refrigerator
- Bedrooms: 8 total rooms (includes bedrooms and living spaces)
- Bathrooms: 1 full bathroom
- Heating & cooling: Forced air heating; No central cooling
- Interior features: Ceiling fan(s); Unfinished full basement; Full attic
Neighborhood map
What this means for you Summary
Snapshot
- This is a 5-bed/1.0-bath single-family listed at $300k.
Deal economics
- At list price, monthly cash flow is $744 ($9k/yr) — positive.
- The deal already cash-flows at list — no discount required.
- Meets the 1% rule at list price ($4k rent vs $300k).
- Cap rate 9.3% vs local median 3.3% in Middletown — top-decile yield for the area; either an underpriced asset or a hidden risk that comps aren't pricing in. Stress-test before assuming the spread holds.
Location & tenants
- Location reads 82/100 on livability (#79 in NY, #1,219 nationally) — a professional / high-income tenant draw. Strengths: amenities A+, housing A+, health & safety A+; Watch: commute C-.
- Middletown City School District (suburban): math 41% / reading 55% proficiency, ranked #411 of 590 in NY (top 70%) — families likely to look elsewhere, expect single-tenant / working-renter base with shorter leases; 61% free/reduced lunch — lower-income household profile, screen leases tightly.
- Zoned schools: Presidential Park Elementary School (math 19% / reading 37%, grade F, #1,774 of 2,108 statewide, top 84%, 1,300 students, 76% FRL); Middletown Twin Towers Middle School (math 10% / reading 42%, grade F, #595 of 729 statewide, top 82%, 858 students, 78% FRL); Middletown High School (math 90% / reading 92%, grade A+, #203 of 1,100 statewide, top 20%, 2,523 students, 71% FRL).
- Market conditions: Rents rising fast (+8.2%/yr); 273 active listings in the ZIP; 2 comparable units currently listed for rent nearby; solid renter incomes; 1,746 units permitted in Orange County in 2024 (1,265 in 5+ unit buildings).
- At $3,602/mo this rent would consume 50% of the median local household income ($87k/yr) (locally 1846% of renters already pay >50% of income on rent) — very limited rent-growth headroom before tenants either downsize or default.
Forward outlook
- Local home prices are declining (-3.0%/yr); year-one equity from $2k of loan paydown is wiped out by about $9k of value loss. Plan a longer hold.
- At projected returns (-3.0% appreciation + 8.0% rent growth), your $84k cash investment doubles in ~7 years — after that, you're playing with house money.
Negotiation context
- Only 1 days on market — expect competitive offers; lowballing is unlikely to land.
- Current owner paid $210k; 43% above their basis — modest negotiation headroom, anchor on the comps not their cost.
Risks & watch-outs
- Watch-outs: built in 1920 — expect roof / HVAC / electrical / plumbing capex.
Questions for the listing agent
- Built in 1920 — when were the roof, HVAC, electrical panel, plumbing, and water heater last replaced?
- Is there a deadline driving the sale (1031 exchange, divorce, estate, relocation)? That informs how much negotiation room exists.
- Schools are D-rated, which usually means shorter tenancies and higher turnover. Who's the typical renter profile here, and what's been the actual vacancy rate?
- What's the average days-on-market for RENTAL listings here right now (not sales)? A rising rental-DOM trend means longer vacancies and softer asking-rent achievability than the comps imply.
- What's the recent tenant-quality profile in this submarket — average credit score on applications, eviction rate, late-payment / NSF rate, and stable-employment percentage? A property-management company in the area should have these aggregated.
- How much new for-sale + rental construction is in the pipeline within 1–3 miles? Heavy new supply typically softens prices + rents 12–24 months out; constrained supply supports both.
Investment metrics
- 1% rule
- 1.20% ✓
- Cap rate
- 9.27%
- Cash-on-cash
- 10.64%
- DSCR
- 1.47
- GRM
- 6.9
CMA / ARV
- ARV (on-the-fly)
- $323,388
- Comps found
- 4
Show comp detail 4 sales within ~0.75 mi
| Address | Dist | Beds/Ba | Sqft | Sold | Price | $/sf | Match |
|---|---|---|---|---|---|---|---|
| 106 N Beacon St | 0.36mi | 4/2.0 (-1) | 1,380 (-0%) | 19mo | $307,500 | $223 | 58 |
| 193 Highland Ave | 0.48mi | 4/1.5 (-1) | 1,396 (+1%) | 22mo | $285,000 | $204 | 51 |
| 184 Highland Ave | 0.46mi | 4/2.0 (-1) | 1,486 (+8%) | 9mo | $347,500 | $234 | 50 |
| 19 Robertson Dr | 0.11mi | 5/2.0 | 1,574 (+14%) | 23mo | $375,000 | $238 | 49 |
Match score weights: distance 35% · size 25% · config 20% · recency 20%. Top-matched comps best support the ARV.
Projected returns pro-forma
-3.0% appreciation · 8.0% rent growth · sell at horizon
- IRR
- 5.2%
- Equity multiple
- 1.21×
- Total profit
- $17,921
- Equity at exit
- $44,716
- IRR
- 18.8%
- Equity multiple
- 2.95×
- Total profit
- $163,585
- Equity at exit
- $25,930
Cash invested: $83,972 (down + closing). Projections, not guarantees.
Landlord ↔ Tenant lean methodology
- Overall (STATE)
- 15 Strongly Tenant-Friendly
- State New York
- 15 Strongly Tenant-Friendly · D+10
- County
- — inherits STATE
- City
- — inherits STATE
ZIP-level market 10940
- Home prices YoY
- -18.7%
- Rents YoY
- 8.2%
- Active inventory
- 273
- Price-to-rent
- 6.9×
Monthly cashflow live
- Estimated rent
- $3,602 medium interval (Pro) →
- Mortgage (P&I)
- −$1,573
- Tax from tax record
- −$404 /mo · $4,843/yr
- Insurance
- −$125
- HOA
- −$0
- Vacancy / Maint / Mgmt
- −$756
- Net cashflow
- $744
Break-even live
UW: 25.0% down · 7.5% · 30yr · 1.5% tax · 5.0% vac · 8.0% maint · 8.0% mgmt
Financing live
Cash to close
- Down payment
- $74,975
- Closing costs
- $8,997
- Reserves months
- —
- Total cash needed
- —
Loan-product check · same deal, 3 products live
Conventional
25% down · 7.5% · 30yr
- Down + closing
- —
- Monthly P&I
- —
- Monthly cashflow
- —
- DSCR
- —
- Eligible?
- —
Personal DTI + credit; lowest rate.
DSCR
20% down · 8.5% · 30yr
- Down + closing
- —
- Monthly P&I
- —
- Monthly cashflow
- —
- DSCR
- —
- Eligible?
- —
No personal income docs; deal must DSCR.
Hard money
10% down · 12.0% · 12mo
- Down + closing
- —
- Monthly P&I
- —
- Monthly cashflow
- —
- DSCR
- —
- Eligible?
- —
Short-term bridge; refi at stabilization.
Rent comps 2 comps
| Address | Beds | Baths | Sqft | Rent | $/sqft | DOM | Units | Dist |
|---|---|---|---|---|---|---|---|---|
| 184 Highland Ave Middletown, NY | 4.0 | 2.0 | 1486 | $3,500 | $2.36 | 23d | 1 | 0.47mi |
| 7 Mulberry St Middletown, NY | 4.0 | 1.5 | 1696 | $2,800 | $1.65 | 44d | 1 | 1.11mi |
Listing history 2 events
-
2026-06-18remarks 552-char remark
-
2026-06-18$299,900 Active 1 DOM
ⓘ Source: listings_history table (triggers on properties + properties_extension) + one-shot
backfill from property_details.listing_events for pre-trigger history.
Tax reassessment forecast NY · Partial reset (capped growth)
- Current annual tax
- $4,843 · $404/mo
- Projected year-2 tax
- $4,955 · $413/mo
- Expected delta
- +$113/yr (+$9/mo · 2.3%)
ⓘ Screening estimate from a state-policy table — verify with the county assessor before closing.
Climate risk First Street
- Flood 1/10 Low FEMA zone X (unshaded) · 0% chance over 30 yrs
- Wildfire 1/10 Low
- Heat 4/10 Moderate 7 d/yr ≥100°F today · 15 d/yr by 30 yrs out
- Wind 4/10 Moderate 10% chance of damaging wind over 30 yrs
- Air quality 2/10 Low 1 unhealthy d/yr today · 2 by 30 yrs out
Nearby sold comps map
Loading sold comps map…
Walkable amenities ~0.75 mi
Loading nearby amenities…
Taxation est. · year 1
- Rental income
- $43,224
- − Mortgage interest
- −$16,799
- − Property taxes
- −$4,843
- − Insurance
- −$1,500
- − Repairs & maintenance
- −$3,458
- − Management
- −$3,458
- − Depreciation
- −$8,724
- Taxable income
- $4,443
- Est. tax owed @ 24.0%
- −$1,066
- After-tax cash flow
- $7,866/yr
For passive investors: Depreciation is non-cash, so a rental often shows a tax loss while cash-flowing — sheltering income. Rental losses are passive: they offset passive income freely, and up to $25,000/yr can offset ordinary (W-2) income if you actively participate and your MAGI is under $100k (phasing out to $0 by $150k); unused losses carry forward. On sale, claimed depreciation is recaptured at up to 25%, and gains may owe capital-gains tax (a 1031 exchange can defer both). Figures are a year-1 estimate at your 24.0% rate — not tax advice; consult a CPA.
Schools (NCES district)
- District
- Middletown City School District
- NCES district ID
- 3619320
- Math proficiency
- 41% ▼ -2.00%
- Reading proficiency
- 55% ▲ 19.00%
- Median HH income
- $54,612
- Composite
- 41.52/100
- National rank
- #3453
- State rank
- #411 of 590 in NY
Livability — Middletown
- Score
- 82/100
- State rank
- #79
- US rank
- #1219
Category grades
Schools grade is shown separately in the Schools card above.
Census & demographics
- Census place
- Middletown, NY
- County
- Orange County · 267,004 people
- City population
- 68,033
- Metro
- Poughkeepsie-Newburgh-Middletown, NY
- Population (ZIP)
- 53,611
- Household income
- $87,080
- Rent vs Own
- Severe rent burden
- 1846.0
Population outlook (Orange County) Hauer SSP2
- Today (2025)
- 379,830 people
- By 2030
- 378,955 · -0.2%
- By 2040
- 375,444 · -1.2%
- By 2050
- 369,311 · -2.8%
- By 2075
- 354,233 · -6.7%
- By 2100
- 318,150 · -16.2%
Race, ethnicity, and origin ACS 2023
- Neighborhood character
- Highly diverse neighborhood (Simpson 0.70)
- Race & ethnicity
- White 39% Hispanic / Latino 32% Black 20% Two or more races 13% Asian 4% Native American 3%
- Hispanic origin (detail)
- Mexican 9% Puerto Rican 13% Dominican 3%
- Common ancestry
- Romanian 3% Italian 1% Iranian 1%
- Foreign-born
- 18% · Canada, China, Jamaica
- Languages at home
- 72% English-only · Spanish 21% Other Indo-European 2% Chinese 1%
Political lean MEDSL · Orange
- 2024 margin
- Lean R (+8.4) · D 45.8% · R 54.2%
- 2008→2024 swing
- -12.5pp toward R · 2008: 4.1pp · 2024: -8.4pp
- All cycles
- 2024: R+8.4 2020: R+0.2 2016: R+6.5 2012: D+5.2 2008: D+4.1
Not yet ingested
- Civics
- —
Market trends
- HPI YoY
- ▼ -71.68%
- Current HPI
- 311.5969
- Rent YoY
- ▲ 8.23%
- Metro
- Poughkeepsie-Newburgh-Middletown, NY
- State GDP YoY
- ▲ 2.60%
- F500 in state
- 92
Industry mix (Fortune 500 HQ in NY)
| Industry | F500 HQs | Revenue |
|---|---|---|
| Financial Services | 10 | $950B |
|
||
| Consumer Goods | 9 | $162B |
|
||
| Insurance | 4 | $225B |
|
||
| Telecommunications | 2 | $144B |
|
||
| Pharmaceuticals | 2 | $112B |
|
||
| Media / Entertainment | 2 | $69B |
|
||
Price history
+299.9% since first listed4 events — show timeline
- 2026-06-17 Listed $299,900 OneKey® MLS as Distributed by MLS Grid
- 2026-04-29 Sold (Public Records) $210,000 Public Records
- 1993-06-03 Sold (Public Records) $20,000 Public Records
- 1986-08-18 Sold (Public Records) $75,000 Public Records
Property tax history
+2.8%/yrLatest (2025): $4,843 · -0.3% YoY. Source: county tax records.
Cash-flow waterfall
monthlySold comps — $/sqft
last 12 mo · ≤1 miLoading sold comps…