 Multi-family
1516 Valley Dr · Syracuse, NY
Flood risk No data
- FEMA flood zone
- —
- Chance of flooding over 30 yrs
- —
- Est. flood insurance / yr
- —
Fire risk No data
- Est. fire insurance / yr
- —
Heat risk No data
- Hot days now (above threshold)
- —
- Hot days in 30 yrs
- —
Wind risk No data
- Chance of severe wind over 30 yrs
- —
Air-quality risk No data
- Unhealthy air days now
- —
- Unhealthy air days in 30 yrs
- —
Risk factors via First Street. Map © Google.
Why this score? — see what drove the B+ grade
The composite is a weighted blend of 9 inputs, each scored 0–100. Each bar is that input's sub-score; the figure is the points it added to the 100-point composite (weight × sub-score).
- Cash flow +30.0/30.0
- ARV discount +15.0/15.0
- 1% rule +10.0/10.0
- DSCR +10.0/10.0
- Livability +3.9/5.0
- Rent growth +2.5/5.0
- Condition / age +2.2/5.0
- Schools +1.8/10.0
- Appreciation +0.0/10.0
$179,900
🖨 Deal sheet 📄 Offer letter ✓ Due diligence
Multi-family units
County records classify this as Multi-Family (2-4 Unit). Listing-text estimate: 1 unit. estimate disagrees with records
Listing remarks MLS
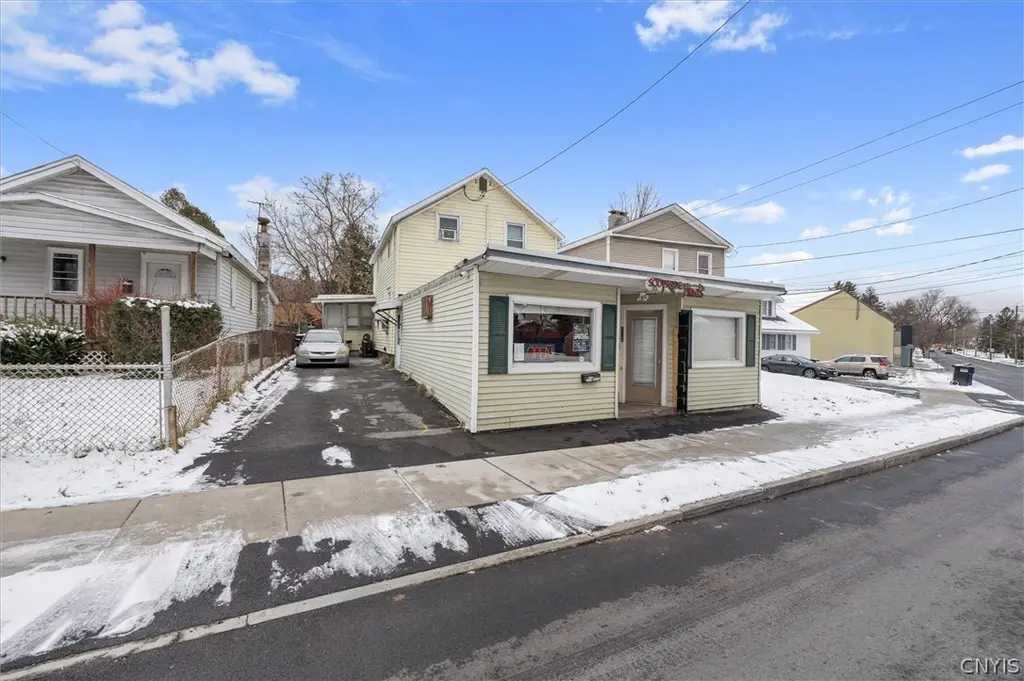
Welcome to 1516 Valley Dr, a fantastic mixed-use building situated in Syracuse, NY. The street front boasts a successful store and print shop while the back is a residential 3 bedroom, 1.5 bathroom apartment! Both units are currently rented out for a total gross monthly income of $2,300. This property presents terrific potential cashflow for an investor! Convenience is key, and this property delivers; nestled close to a wide variety of stores, restaurants, and shops, it also offers easy access to downtown Syracuse's vibrant amenities. Not to mention there is also off-street parking, a rare find in this bustling area! This property has the ability to be sold as a package with the one right next door, 1522 Valley Dr Syracuse, NY. MLS Number: S1666457. It does NOT need to be sold as a package.
Key facts
- Mixed-use building
- Off-street parking
- 4,250 sq ft lot
Tags
Neighborhood map
What this means for you Summary
Snapshot
- This is a 3-bed/2.5-bath multifamily listed at $180k. Condition is rated fair.
Deal economics
- At list price, monthly cash flow is $1k ($16k/yr) — positive.
- The deal already cash-flows at list — no discount required.
- Meets the 1% rule at list price ($3k rent vs $180k).
- Recommended offer: $164k (9.0% below list) — sets the bar for market timing.
- Cap rate 15.2% vs local median 8.2% in Syracuse — top-decile yield for the area; either an underpriced asset or a hidden risk that comps aren't pricing in. Stress-test before assuming the spread holds.
Location & tenants
- Location reads 77/100 on livability (#187 in NY, #2,869 nationally) — a middle-class / working-renter tenant base. Strengths: amenities A+, commute A+, cost of living A+; Watch: schools D+, crime F, employment D-.
- Syracuse City School District (urban): math 18% / reading 26% proficiency, ranked #590 of 590 in NY (top 100%) — low school quality limits family demand, transient renter base, plan for 1-2y turnover; 74% free/reduced lunch — lower-income household profile, screen leases tightly.
- Market conditions: 63 active listings in the ZIP; 1 comparable units currently listed for rent nearby; 616 units permitted in Onondaga County in 2024 (256 in 5+ unit buildings).
Forward outlook
- Local home prices are declining (-3.0%/yr); year-one equity from $1k of loan paydown is wiped out by about $5k of value loss. Plan a longer hold.
- Onondaga County population projected to shrink 9% by 2050 — rents likely to lag national; underwrite the cash flow, not the appreciation.
- At projected returns (-3.0% appreciation + 3.0% rent growth), your $50k cash investment doubles in ~4 years — after that, you're playing with house money.
Negotiation context
- It's been on market 91 days — a 9% lower offer ($164k) is reasonable based on typical stale-listing flexibility.
- 5 sale attempts since 2y ago with the ask held roughly flat each time — persistent listings suggest the price (not the market) is what's stuck; bring a comps-based counter.
Questions for the listing agent
- It's been on market 91 days. Have you received any prior offers? Is the seller open to a 9% concession, seller financing, or rate buy-down credit?
- Have any recent inspections been done? Can we get a copy of the seller's disclosures and any deferred-maintenance estimates?
- Built in 1960 — when were the roof, HVAC, electrical panel, plumbing, and water heater last replaced?
- Why hasn't it sold? Are there any deal-killer items the seller is aware of (foundation, flood, title, zoning, code violations)?
- Is there a deadline driving the sale (1031 exchange, divorce, estate, relocation)? That informs how much negotiation room exists.
- Schools are D-rated, which usually means shorter tenancies and higher turnover. Who's the typical renter profile here, and what's been the actual vacancy rate?
- Crime grade is F in this area — have there been break-ins, vandalism, or insurance claims at this property in the last 3 years? What carrier currently insures it and at what premium?
- What's the average days-on-market for RENTAL listings here right now (not sales)? A rising rental-DOM trend means longer vacancies and softer asking-rent achievability than the comps imply.
- What's the recent tenant-quality profile in this submarket — average credit score on applications, eviction rate, late-payment / NSF rate, and stable-employment percentage? A property-management company in the area should have these aggregated.
- How much new apartment / multifamily construction is in the pipeline within 1–3 miles? Heavy new supply (>2% of stock underway) typically softens rents 12–24 months out; light construction supports rent growth.
Investment metrics
- 1% rule
- 1.82% ✓
- Cap rate
- 15.23%
- Cash-on-cash
- 31.90%
- DSCR
- 2.42
- GRM
- 4.6
CMA / ARV
- ARV (median comp)
- $245,716
- List price
- $179,900
- Delta
- -26.79%
- Verdict
- UNDERPRICED
- Comps
- 20 within 1.0 mi
Projected returns pro-forma
-3.0% appreciation · 3.0% rent growth · sell at horizon
- IRR
- 26.9%
- Equity multiple
- 2.12×
- Total profit
- $56,196
- Equity at exit
- $26,824
- IRR
- 34.5%
- Equity multiple
- 4.16×
- Total profit
- $158,970
- Equity at exit
- $15,554
Cash invested: $50,372 (down + closing). Projections, not guarantees.
Landlord ↔ Tenant lean methodology
- Overall (STATE)
- 15 Strongly Tenant-Friendly
- State New York
- 15 Strongly Tenant-Friendly · D+10
- County
- — inherits STATE
- City
- — inherits STATE
ZIP-level market 13207
- Home prices YoY
- -23.0%
- Active inventory
- 63
- Price-to-rent
- 9.2×
Monthly cashflow live
- Estimated rent
- $3,269 high interval (Pro) →
- Mortgage (P&I)
- −$943
- Tax est. 1.5%
- −$225 /mo · $2,698/yr
- Insurance
- −$75
- HOA
- −$0
- Vacancy / Maint / Mgmt
- −$686
- Net cashflow
- $1,339
Break-even live
2-unit breakdown (identical units grouped — click to expand)
| Units | Beds | Baths | Est. rent |
|---|---|---|---|
| 2× units | 3 | 1.5 | $3,268 |
| #1 | 3 | 1.5 | $1,634 |
| #2 | 3 | 1.5 | $1,634 |
| Total (2 units) | $3,269 | ||
UW: 25.0% down · 7.5% · 30yr · 1.5% tax · 5.0% vac · 8.0% maint · 8.0% mgmt
Financing live
Cash to close
- Down payment
- $44,975
- Closing costs
- $5,397
- Reserves months
- —
- Total cash needed
- —
Loan-product check · same deal, 3 products live
Conventional
25% down · 7.5% · 30yr
- Down + closing
- —
- Monthly P&I
- —
- Monthly cashflow
- —
- DSCR
- —
- Eligible?
- —
Personal DTI + credit; lowest rate.
DSCR
20% down · 8.5% · 30yr
- Down + closing
- —
- Monthly P&I
- —
- Monthly cashflow
- —
- DSCR
- —
- Eligible?
- —
No personal income docs; deal must DSCR.
Hard money
10% down · 12.0% · 12mo
- Down + closing
- —
- Monthly P&I
- —
- Monthly cashflow
- —
- DSCR
- —
- Eligible?
- —
Short-term bridge; refi at stabilization.
Rent comps 1 comps
| Address | Beds | Baths | Sqft | Rent | $/sqft | DOM | Units | Dist |
|---|---|---|---|---|---|---|---|---|
| 102 Newbury Hollow Ln Syracuse, NY | 3.0 | 2.0 | 2000 | $2,300 | $1.15 | 44d | 1 | 1.17mi |
Listing history 26 events
-
2026-06-18days on market $179,900 Active 91 DOM
-
2026-06-17days on market $179,900 Active 90 DOM
-
2026-06-16days on market $179,900 Active 89 DOM
-
2026-06-15days on market $179,900 Active 88 DOM
-
2026-06-14days on market $179,900 Active 86 DOM
-
2026-06-13days on market $179,900 Active 85 DOM
-
2026-06-10days on market $179,900 Active 83 DOM
-
2026-06-09days on market $179,900 Active 82 DOM
-
2026-06-08days on market $179,900 Active 81 DOM
-
2026-06-07days on market $179,900 Active 80 DOM
-
2026-06-05days on market $179,900 Active 77 DOM
-
2026-06-02days on market $179,900 Active 75 DOM
-
2026-06-01days on market $179,900 Active 74 DOM
-
2026-05-31days on market $179,900 Active 73 DOM
-
2026-05-30days on market $179,900 Active 72 DOM
-
2026-03-19$179,900 Active 801-char remark
Show marketing remark (801 chars)
Welcome to 1516 Valley Dr, a fantastic mixed-use building situated in Syracuse, NY. The street front boasts a successful store and print shop while the back is a residential 3 bedroom, 1.5 bathroom apartment! Both units are currently rented out for a total gross monthly income of $2,300. This property presents terrific potential cashflow for an investor! Convenience is key, and this property delivers; nestled close to a wide variety of stores, restaurants, and shops, it also offers easy access to downtown Syracuse's vibrant amenities. Not to mention there is also off-street parking, a rare find in this bustling area! This property has the ability to be sold as a package with the one right next door, 1522 Valley Dr Syracuse, NY. MLS Number: S1666457. It does NOT need to be sold as a package.
-
2025-12-30historical
-
2025-11-17status Active
-
2025-10-07historical Active Under Contract
-
2025-07-07status Active
-
2025-04-30historical Active Under Contract
-
2025-01-14price $184,900
-
2024-12-05$187,500 Active
-
2024-11-09historical
-
2024-09-16price $197,900
-
2024-06-26$219,000 Active
ⓘ Source: listings_history table (triggers on properties + properties_extension) + one-shot
backfill from property_details.listing_events for pre-trigger history.
Nearby sold comps map
Loading sold comps map…
Walkable amenities ~0.75 mi
Loading nearby amenities…
Taxation est. · year 1
- Rental income
- $39,228
- − Mortgage interest
- −$10,077
- − Property taxes
- −$2,698
- − Insurance
- −$900
- − Repairs & maintenance
- −$3,138
- − Management
- −$3,138
- − Depreciation
- −$5,233
- Taxable income
- $14,043
- Est. tax owed @ 24.0%
- −$3,370
- After-tax cash flow
- $12,701/yr
For passive investors: Depreciation is non-cash, so a rental often shows a tax loss while cash-flowing — sheltering income. Rental losses are passive: they offset passive income freely, and up to $25,000/yr can offset ordinary (W-2) income if you actively participate and your MAGI is under $100k (phasing out to $0 by $150k); unused losses carry forward. On sale, claimed depreciation is recaptured at up to 25%, and gains may owe capital-gains tax (a 1031 exchange can defer both). Figures are a year-1 estimate at your 24.0% rate — not tax advice; consult a CPA.
Condition & rehab AI · 2 photos
This multi-family property requires moderate repairs and maintenance, particularly to the exterior and roof. Painting and roof repair would significantly enhance its curb appeal and value.
Repairs flagged
- Major roof — Paint appears faded and there is visible wear
- Major exterior siding — Siding appears weathered and paint is faded
- Major exterior paint — Paint appears faded and there is visible wear
Value-add opportunities
- Both paint exterior — Fresh paint would improve curb appeal and increase both resale and rental value
- Both repair roof — A new roof would significantly increase the property's value and reduce ongoing maintenance costs
Renovation cost estimate screening
| Repair item | Severity | Est. cost |
|---|---|---|
| roof · Paint appears faded and there is visible wear | Major | $15,000–50,000 |
| exterior siding · Siding appears weathered and paint is faded | Major | $15,000–50,000 |
| exterior paint · Paint appears faded and there is visible wear | Major | $15,000–50,000 |
| Total estimated repair cost · 3 items | $45,000–150,000 |
Value-add ROI direction
- Both paint exterior — Fresh paint would improve curb appeal and increase both resale and rental value ↑
- Both repair roof — A new roof would significantly increase the property's value and reduce ongoing maintenance costs ↑
ⓘ Cost ranges are severity-bucket heuristics (US national rule-of-thumb). Get contractor quotes + a written scope before underwriting a rehab budget.
Schools (NCES district)
- District
- Syracuse City School District
- NCES district ID
- 3628590
- Math proficiency
- 18% ▼ -5.00%
- Reading proficiency
- 26% ▬ 0.00%
- Median HH income
- $32,097
- Composite
- 17.83/100
- National rank
- #9007
- State rank
- #590 of 590 in NY
Livability — Syracuse
- Score
- 77/100
- State rank
- #187
- US rank
- #2869
Category grades
Schools grade is shown separately in the Schools card above.
Census & demographics
- Census place
- Syracuse, NY
- City population
- 152,627
- Population (ZIP)
- 12,383
Population outlook (Onondaga County) Hauer SSP2
- Today (2025)
- 467,894 people
- By 2030
- 463,381 · -1.0%
- By 2040
- 447,697 · -4.3%
- By 2050
- 426,399 · -8.9%
- By 2075
- 373,661 · -20.1%
- By 2100
- 307,967 · -34.2%
Race, ethnicity, and origin ACS 2023
- Neighborhood character
- Diverse neighborhood (Simpson 0.68)
- Race & ethnicity
- White 43% Black 33% Hispanic / Latino 17% Two or more races 11% Native American 1% Asian 1%
- Hispanic origin (detail)
- Puerto Rican 13% Cuban 1%
- Common ancestry
- Romanian 3% Lithuanian 1% Slovak 1%
- Foreign-born
- 4% · Canada, South Korea
- Languages at home
- 89% English-only · Spanish 9% French/Haitian/Cajun 1%
Political lean MEDSL · Onondaga
- 2024 margin
- D (+17.3) · D 58.6% · R 41.4%
- 2008→2024 swing
- -3.0pp toward R · 2008: 20.3pp · 2024: 17.3pp
- All cycles
- 2024: D+17.3 2020: D+20.6 2016: D+12.8 2012: D+21.1 2008: D+20.3
Not yet ingested
- Civics
- —
Market trends
- HPI YoY
- ▼ -95.17%
- Current HPI
- 318.9257
- Rent YoY
- —
- Metro
- —
- State GDP YoY
- ▲ 2.60%
- F500 in state
- 92
Industry mix (Fortune 500 HQ in NY)
| Industry | F500 HQs | Revenue |
|---|---|---|
| Financial Services | 10 | $950B |
|
||
| Consumer Goods | 9 | $162B |
|
||
| Insurance | 4 | $225B |
|
||
| Telecommunications | 2 | $144B |
|
||
| Pharmaceuticals | 2 | $112B |
|
||
| Media / Entertainment | 2 | $69B |
|
||
Price history
-17.9% since first listed11 events — show timeline
- 2026-03-19 Listed $179,900 CNYIS
- 2025-12-30 Listing Removed — CNYIS
- 2025-11-17 Relisted — CNYIS
- 2025-10-07 Contingent — CNYIS
- 2025-07-07 Relisted — CNYIS
- 2025-04-30 Contingent — CNYIS
- 2025-01-14 Price Changed $184,900 CNYIS
- 2024-12-05 Listed $187,500 CNYIS
- 2024-11-09 Listing Removed — CNYIS
- 2024-09-16 Price Changed $197,900 CNYIS
- 2024-06-26 Listed $219,000 CNYIS
Cash-flow waterfall
monthlySold comps — $/sqft
last 12 mo · ≤1 miLoading sold comps…