 Duplex
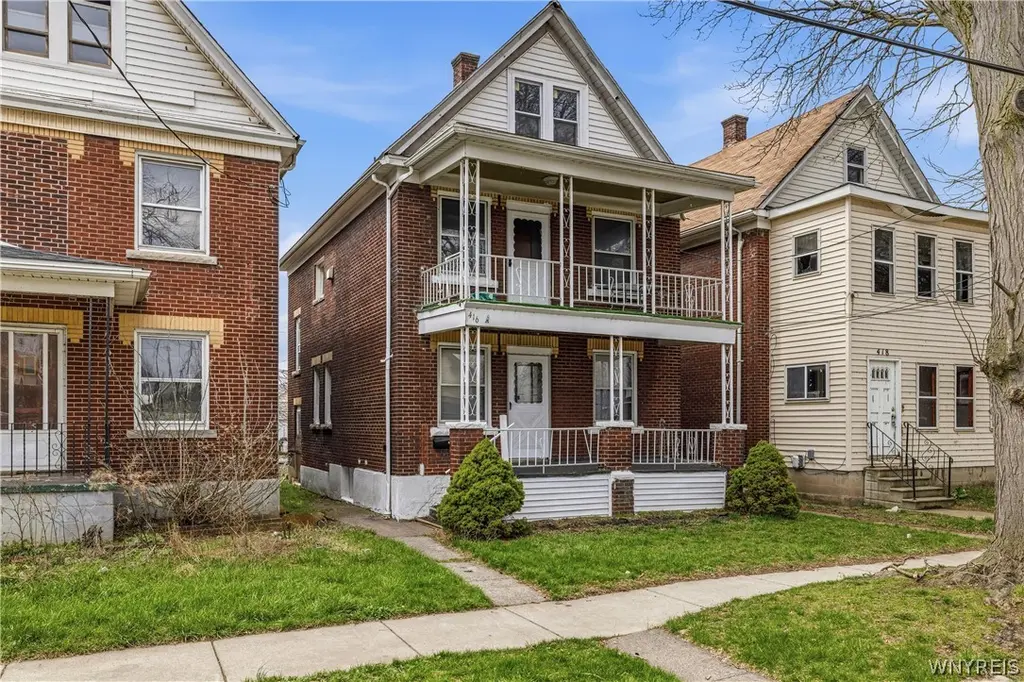
416 26th St · Niagara Falls, NY
Flood risk 1/10 · Minimal
- FEMA flood zone
- X (unshaded)
- Chance of flooding over 30 yrs
- 0.0%
- Est. flood insurance / yr
- $473 – $860
Fire risk 1/10 · Minimal
- Est. fire insurance / yr
- $691 – $1,283
Heat risk 2/10 · Minimal
- Hot days now (above 94°F)
- 7 days/yr
- Hot days in 30 yrs
- 15 days/yr
Wind risk 1/10 · Minimal
- Chance of severe wind over 30 yrs
- —
Air-quality risk 3/10 · Minor
- Unhealthy air days now
- 2 days/yr
- Unhealthy air days in 30 yrs
- 3 days/yr
Risk factors via First Street. Map © Google.
Why this score? — see what drove the B+ grade
The composite is a weighted blend of 9 inputs, each scored 0–100. Each bar is that input's sub-score; the figure is the points it added to the 100-point composite (weight × sub-score).
- Cash flow +30.0/30.0
- ARV discount +15.0/15.0
- 1% rule +10.0/10.0
- DSCR +10.0/10.0
- Livability +3.0/5.0
- Rent growth +2.5/5.0
- Schools +2.5/10.0
- Condition / age +2.5/5.0
- Appreciation +2.3/10.0
$134,900
🖨 Deal sheet 📄 Offer letter ✓ Due diligence
Multi-family units
County records classify this as Multi-Family (2-4 Unit). Listing-text estimate: 2 units. confirmed
Listing remarks MLS
Opportunity meets versatility in this solid brick two-family home in the heart of Niagara Falls. Whether you're looking to generate income, offset your living expenses, or expand your portfolio, this property checks the right boxes. Each unit offers 2 bedrooms with practical layouts designed for comfortable day-to-day living. The brick exterior provides long-term durability, while the full basement and full attic offer valuable storage and potential for additional use (subject to local regulations). Step outside to a fully fenced backyard—ideal for creating a private outdoor space, entertaining, or simply adding functional value for occupants. For investors, this is a straightforward addition with strong rental potential. For owner-occupants, this presents a compelling opportunity to live in one unit while leveraging the second unit to help offset expenses. Conveniently located near local amenities, shopping, and major routes, this property positions itself as both a smart investment and a practical living solution.
Key facts
- 2,916 sq ft lot
- Built 1920
- Listed 65 days
Neighborhood map
What this means for you Summary
Snapshot
- This is a 2 × 2-bed/1.0-bath units multifamily listed at $135k.
Deal economics
- At list price, monthly cash flow is $845 ($10k/yr) — positive. Per door: $422/mo.
- The deal already cash-flows at list — no discount required.
- Meets the 1% rule at list price ($2k rent vs $135k).
- Recommended offer: $127k (6.0% below list) — sets the bar for market timing.
- Cap rate 13.8% vs local median 7.7% in Niagara Falls — top-decile yield for the area; either an underpriced asset or a hidden risk that comps aren't pricing in. Stress-test before assuming the spread holds.
Location & tenants
- Location reads 60/100 on livability (#956 in NY) — a middle-class / working-renter tenant base. Strengths: cost of living A+, housing A+; Watch: schools F, crime F, amenities F.
- Niagara Falls City School District (urban): math 26% / reading 34% proficiency, ranked #578 of 590 in NY (top 98%) — families likely to look elsewhere, expect single-tenant / working-renter base with shorter leases; 66% free/reduced lunch — lower-income household profile, screen leases tightly.
- Market conditions: 74 active listings in the ZIP; 13 comparable units currently listed for rent nearby; rentals at typical pace (median 15d on market — plan ~3-4 weeks tenant-placement turnaround); 167 units permitted in Niagara County in 2024 (0 in 5+ unit buildings).
- At $2,364/mo this rent would consume 62% of the median local household income ($46k/yr) (locally 230% of renters already pay >50% of income on rent) — very limited rent-growth headroom before tenants either downsize or default.
Forward outlook
- Local home prices are declining (-3.0%/yr); year-one equity from $933 of loan paydown is wiped out by about $4k of value loss. Plan a longer hold.
- Niagara County population projected at -19% by 2050 — secular population decline; favor cash flow + early exit over multi-decade hold.
- At projected returns (-3.0% appreciation + 3.0% rent growth), your $38k cash investment doubles in ~5 years — after that, you're playing with house money.
Negotiation context
- It's been on market 65 days — a 6% lower offer ($127k) is reasonable based on typical stale-listing flexibility.
- 7 sale attempts since 7y ago; this cycle's ask has dropped $15k (10%) from the opening price — seller is motivated, your offer sets the floor, not the list.
- Current owner paid $50k; list at $135k implies a 170% gain — meaningful room to come down on a strong offer.
Risks & watch-outs
- Watch-outs: built in 1920 — expect roof / HVAC / electrical / plumbing capex.
Questions for the listing agent
- It's been on market 65 days. Have you received any prior offers? Is the seller open to a 6% concession, seller financing, or rate buy-down credit?
- Can we see the unit-by-unit rent roll, current vacancy, and any below-market leases? What's the average tenancy length?
- What capital expenditures (roof, boiler, parking lot, exteriors) have been made in the last 5 years, and what's planned in the next 2?
- Built in 1920 — when were the roof, HVAC, electrical panel, plumbing, and water heater last replaced?
- Why hasn't it sold? Are there any deal-killer items the seller is aware of (foundation, flood, title, zoning, code violations)?
- Is there a deadline driving the sale (1031 exchange, divorce, estate, relocation)? That informs how much negotiation room exists.
- Schools are F-rated, which usually means shorter tenancies and higher turnover. Who's the typical renter profile here, and what's been the actual vacancy rate?
- Crime grade is F in this area — have there been break-ins, vandalism, or insurance claims at this property in the last 3 years? What carrier currently insures it and at what premium?
- What's the average days-on-market for RENTAL listings here right now (not sales)? A rising rental-DOM trend means longer vacancies and softer asking-rent achievability than the comps imply.
- What's the recent tenant-quality profile in this submarket — average credit score on applications, eviction rate, late-payment / NSF rate, and stable-employment percentage? A property-management company in the area should have these aggregated.
- How much new apartment / multifamily construction is in the pipeline within 1–3 miles? Heavy new supply (>2% of stock underway) typically softens rents 12–24 months out; light construction supports rent growth.
Investment metrics
- 1% rule
- 1.75% ✓
- Cap rate
- 13.81%
- Cash-on-cash
- 26.83%
- DSCR
- 2.19
- GRM
- 4.8
CMA / ARV
- ARV (median comp)
- $212,701
- List price
- $134,900
- Delta
- -36.58%
- Verdict
- UNDERPRICED
- Comps
- 20 within 1.0 mi
Show comp detail 12 sales within ~0.75 mi
| Address | Dist | Beds/Ba | Sqft | Sold | Price | $/sf | Match |
|---|---|---|---|---|---|---|---|
| 2771 Livingston Ave | 0.23mi | 4/2.0 | 1,408 (-1%) | 7mo | $88,000 | $63 | 81 |
| 443 21st St | 0.30mi | 3/2.0 (-1) | 1,428 (0%) | 10mo | $65,000 | $46 | 72 |
| 614 20th St | 0.50mi | 4/2.0 | 1,570 (+10%) | 1mo | $100,000 | $64 | 59 |
| 555 25th St | 0.29mi | 4/2.0 | 1,619 (+13%) | 7mo | $128,000 | $79 | 58 |
| 548 19th St | 0.51mi | 4/2.0 | 1,265 (-11%) | 1mo | $62,500 | $49 | 56 |
| 547 21st St | 0.39mi | 5/2.0 (+1) | 1,534 (+7%) | 12mo | $129,900 | $85 | 55 |
| 445 18th St | 0.47mi | 4/2.0 | 1,320 (-8%) | 15mo | $55,000 | $42 | 53 |
| 2738 Welch Ave | 0.19mi | 3/2.0 (-1) | 1,621 (+14%) | 14mo | $141,110 | $87 | 52 |
| 420 18th St | 0.49mi | 4/2.5 | 1,632 (+14%) | 3mo | $115,000 | $70 | 49 |
| 2405 Independence Ave | 0.56mi | 4/2.0 | 1,524 (+7%) | 18mo | $127,000 | $83 | 48 |
| 2719 Pine Ave | 0.43mi | 3/3.0 (-1) | 1,280 (-10%) | 16mo | $79,000 | $62 | 40 |
| 514 18th St | 0.53mi | 3/2.0 (-1) | 1,260 (-12%) | 14mo | $88,740 | $70 | 39 |
Match score weights: distance 35% · size 25% · config 20% · recency 20%. Top-matched comps best support the ARV.
Projected returns pro-forma
-3.0% appreciation · 3.0% rent growth · sell at horizon
- IRR
- 20.8%
- Equity multiple
- 1.85×
- Total profit
- $32,022
- Equity at exit
- $20,114
- IRR
- 29.0%
- Equity multiple
- 3.58×
- Total profit
- $97,520
- Equity at exit
- $11,664
Cash invested: $37,772 (down + closing). Projections, not guarantees.
Landlord ↔ Tenant lean methodology
- Overall (STATE)
- 15 Strongly Tenant-Friendly
- State New York
- 15 Strongly Tenant-Friendly · D+10
- County
- — inherits STATE
- City
- — inherits STATE
ZIP-level market 14303
- Home prices YoY
- -1.7%
- Active inventory
- 74
- Price-to-rent
- 9.5×
Monthly cashflow live
- Estimated rent
- $2,364 high interval (Pro) →
- Mortgage (P&I)
- −$707
- Tax from tax record
- −$259 /mo · $3,112/yr
- Insurance
- −$56
- HOA
- −$0
- Vacancy / Maint / Mgmt
- −$496
- Net cashflow
- $845
Break-even live
2-unit breakdown (identical units grouped — click to expand)
| Units | Beds | Baths | Est. rent |
|---|---|---|---|
| 2× units | 2 | 1 | $2,364 |
| #1 | 2 | 1 | $1,182 |
| #2 | 2 | 1 | $1,182 |
| Total (2 units) | $2,364 | ||
UW: 25.0% down · 7.5% · 30yr · 1.5% tax · 5.0% vac · 8.0% maint · 8.0% mgmt
Financing live
Cash to close
- Down payment
- $33,725
- Closing costs
- $4,047
- Reserves months
- —
- Total cash needed
- —
Loan-product check · same deal, 3 products live
Conventional
25% down · 7.5% · 30yr
- Down + closing
- —
- Monthly P&I
- —
- Monthly cashflow
- —
- DSCR
- —
- Eligible?
- —
Personal DTI + credit; lowest rate.
DSCR
20% down · 8.5% · 30yr
- Down + closing
- —
- Monthly P&I
- —
- Monthly cashflow
- —
- DSCR
- —
- Eligible?
- —
No personal income docs; deal must DSCR.
Hard money
10% down · 12.0% · 12mo
- Down + closing
- —
- Monthly P&I
- —
- Monthly cashflow
- —
- DSCR
- —
- Eligible?
- —
Short-term bridge; refi at stabilization.
Rent comps 13 comps
| Address | Beds | Baths | Sqft | Rent | $/sqft | DOM | Units | Dist |
|---|---|---|---|---|---|---|---|---|
| 420 25th St Niagara Falls, NY | 3.0 | 1.0 | 1101 | $1,500 | $1.36 | 44d | 1 | 0.04mi |
| 2727 Monroe Ave Niagara Falls, NY | 3.0 | 1.0 | 960 | $1,500 | $1.56 | 10d | 1 | 0.14mi |
| 2420 Mackenna Ave Unit 1 Niagara Falls, NY | 4.0 | 1.0 | 1300 | $1,390 | $1.07 | 1d | 1 | 0.27mi |
| 3036 Welch Ave Niagara Falls, NY | 3.0 | 1.0 | 1000 | $1,500 | $1.50 | 1d | 1 | 0.36mi |
| 3225 Belden Pl Niagara Falls, NY | 5.0 | 1.5 | 1344 | $1,750 | $1.30 | 1d | 1 | 0.53mi |
| 3340 Simmons Ave Niagara Falls, NY | 3.0 | 1.0 | 1008 | $1,550 | $1.54 | 14d | 1 | 0.63mi |
| 1427 Fort Ave Unit 2 Niagara Falls, NY | 3.0 | 1.0 | 1058 | $950 | $0.90 | 44d | 1 | 0.64mi |
| 2020 Forest Ave Niagara Falls, NY | 4.0 | 2.0 | 1600 | $1,500 | $0.94 | 17d | 1 | 0.70mi |
| 1001 17th St Niagara Falls, NY | 3.0 | 1.0 | 1152 | $1,800 | $1.56 | 23d | 1 | 0.83mi |
| 754 15th St Niagara Falls, NY | 3.0 | 1.0 | 990 | $1,100 | $1.11 | 23d | 1 | 0.85mi |
| 784 15th St Niagara Falls, NY | 3.0 | 1.5 | 1380 | $1,350 | $0.98 | 3d | 1 | 0.90mi |
| 724 Augustus Pl Niagara Falls, NY | 4.0 | 1.0 | 1200 | $1,500 | $1.25 | 44d | 1 | 1.18mi |
| 642 Ashland Ave Niagara Falls, NY | 3.0 | 1.0 | 1238 | $1,100 | $0.89 | 3d | 1 | 1.49mi |
Listing history 37 events
-
2026-06-18days on market $134,900 Active 65 DOM
-
2026-06-17days on market $134,900 Active 64 DOM
-
2026-06-16days on market $134,900 Active 63 DOM
-
2026-06-15days on market $134,900 Active 62 DOM
-
2026-06-13days on market $134,900 Active 60 DOM
-
2026-06-13days on market $134,900 Active 59 DOM
-
2026-06-10days on market $134,900 Active 57 DOM
-
2026-06-09pricedays on market $134,900 Active 56 DOM
-
2026-06-08days on market $149,900 Active 55 DOM
-
2026-06-07days on market $149,900 Active 54 DOM
-
2026-06-03days on market $149,900 Active 50 DOM
-
2026-06-02days on market $149,900 Active 49 DOM
-
2026-06-01days on market $149,900 Active 48 DOM
-
2026-05-31days on market $149,900 Active 47 DOM
-
2026-04-14$149,900 Active 1037-char remark
Show marketing remark (1037 chars)
Opportunity meets versatility in this solid brick two-family home in the heart of Niagara Falls. Whether you're looking to generate income, offset your living expenses, or expand your portfolio, this property checks the right boxes. Each unit offers 2 bedrooms with practical layouts designed for comfortable day-to-day living. The brick exterior provides long-term durability, while the full basement and full attic offer valuable storage and potential for additional use (subject to local regulations). Step outside to a fully fenced backyard—ideal for creating a private outdoor space, entertaining, or simply adding functional value for occupants. For investors, this is a straightforward addition with strong rental potential. For owner-occupants, this presents a compelling opportunity to live in one unit while leveraging the second unit to help offset expenses. Conveniently located near local amenities, shopping, and major routes, this property positions itself as both a smart investment and a practical living solution.
-
2025-08-14historical
-
2025-07-07price $152,000
-
2025-05-15price $155,000
-
2025-05-14$150,000 Active
-
2024-11-08historical
-
2024-08-08$139,900 Active
-
2024-06-28historical
-
2024-05-28price $155,000
-
2024-05-01price $157,000
-
2024-04-11price $158,000
-
2024-03-28$160,000 Active
-
2023-08-28historical
-
2023-06-21price $184,900
-
2023-05-28$195,000 Active
-
2020-09-25soldstatus $50,000 Closed Sale or Rented
-
2020-07-07status Pending Sale
-
2020-05-22$59,000 Active
-
2020-02-10soldstatus $43,000 Closed Sale or Rented
-
2019-12-30status Under Contract- Do Not Show
-
2019-10-25$49,900 Active
-
2006-09-22soldstatus $42,000
-
2005-10-13soldstatus $40,000
ⓘ Source: listings_history table (triggers on properties + properties_extension) + one-shot
backfill from property_details.listing_events for pre-trigger history.
Tax reassessment forecast NY · Partial reset (capped growth)
- Current annual tax
- $3,112 · $259/mo
- Projected year-2 tax
- $3,112 · $259/mo
- Expected delta
- $0/yr ($0/mo · 0.0%)
ⓘ Screening estimate from a state-policy table — verify with the county assessor before closing.
Climate risk First Street
- Flood 1/10 Low FEMA zone X (unshaded) · 0% chance over 30 yrs
- Wildfire 1/10 Low
- Heat 2/10 Low 7 d/yr ≥94°F today · 15 d/yr by 30 yrs out
- Wind 1/10 Low
- Air quality 3/10 Moderate 2 unhealthy d/yr today · 3 by 30 yrs out
Nearby sold comps map
Loading sold comps map…
Walkable amenities ~0.75 mi
Loading nearby amenities…
Taxation est. · year 1
- Rental income
- $28,368
- − Mortgage interest
- −$7,556
- − Property taxes
- −$3,112
- − Insurance
- −$674
- − Repairs & maintenance
- −$2,269
- − Management
- −$2,269
- − Depreciation
- −$3,924
- Taxable income
- $8,561
- Est. tax owed @ 24.0%
- −$2,055
- After-tax cash flow
- $8,080/yr
For passive investors: Depreciation is non-cash, so a rental often shows a tax loss while cash-flowing — sheltering income. Rental losses are passive: they offset passive income freely, and up to $25,000/yr can offset ordinary (W-2) income if you actively participate and your MAGI is under $100k (phasing out to $0 by $150k); unused losses carry forward. On sale, claimed depreciation is recaptured at up to 25%, and gains may owe capital-gains tax (a 1031 exchange can defer both). Figures are a year-1 estimate at your 24.0% rate — not tax advice; consult a CPA.
Schools (NCES district)
- District
- Niagara Falls City School District
- NCES district ID
- 3620820
- Math proficiency
- 26% ▼ -10.00%
- Reading proficiency
- 34% ▲ 3.00%
- Median HH income
- $32,488
- Composite
- 24.5/100
- National rank
- #7655
- State rank
- #578 of 590 in NY
Livability — Niagara Falls
- Score
- 60/100
- State rank
- #956
- US rank
- #18749
Category grades
Schools grade is shown separately in the Schools card above.
Census & demographics
- Census place
- Niagara Falls, NY
- County
- Niagara County · 157,377 people
- City population
- 62,983
- Metro
- Buffalo-Cheektowaga, NY
- Population (ZIP)
- 6,156
- Household income
- $45,646
- Rent vs Own
- Severe rent burden
- 230.0
Population outlook (Niagara County) Hauer SSP2
- Today (2025)
- 204,149 people
- By 2030
- 197,900 · -3.1%
- By 2040
- 182,239 · -10.7%
- By 2050
- 165,198 · -19.1%
- By 2075
- 129,416 · -36.6%
- By 2100
- 96,222 · -52.9%
Race, ethnicity, and origin ACS 2023
- Neighborhood character
- Diverse neighborhood (Simpson 0.68)
- Race & ethnicity
- White 53% Two or more races 18% Hispanic / Latino 15% Black 12% Asian 4% Native American 1%
- Hispanic origin (detail)
- Mexican 6% Puerto Rican 6%
- Common ancestry
- Romanian 12% Lithuanian 2% Iranian 1%
- Foreign-born
- 3%
- Languages at home
- 93% English-only · Other Indo-European 3% Spanish 3% Russian/Polish/Slavic 1%
Political lean MEDSL · Niagara
- 2024 margin
- R (+14.9) · D 42.5% · R 57.5%
- 2008→2024 swing
- -15.9pp toward R · 2008: 1.0pp · 2024: -14.9pp
- All cycles
- 2024: R+14.9 2020: R+9.7 2016: R+19.0 2012: D+0.6 2008: D+1.0
Not yet ingested
- Civics
- —
Market trends
- HPI YoY
- ▼ -5.37%
- Current HPI
- 311.8094
- Rent YoY
- —
- Metro
- Buffalo-Cheektowaga, NY
- State GDP YoY
- ▲ 2.60%
- F500 in state
- 92
Industry mix (Fortune 500 HQ in NY)
| Industry | F500 HQs | Revenue |
|---|---|---|
| Financial Services | 10 | $950B |
|
||
| Consumer Goods | 9 | $162B |
|
||
| Insurance | 4 | $225B |
|
||
| Telecommunications | 2 | $144B |
|
||
| Pharmaceuticals | 2 | $112B |
|
||
| Media / Entertainment | 2 | $69B |
|
||
Price history
+274.8% since first listed23 events — show timeline
- 2026-04-14 Listed $149,900 WNYREIS
- 2025-08-14 Listing Removed — WNYREIS
- 2025-07-07 Price Changed $152,000 WNYREIS
- 2025-05-15 Price Changed $155,000 WNYREIS
- 2025-05-14 Listed $150,000 WNYREIS
- 2024-11-08 Listing Removed — WNYREIS
- 2024-08-08 Listed $139,900 WNYREIS
- 2024-06-28 Listing Removed — WNYREIS
- 2024-05-28 Price Changed $155,000 WNYREIS
- 2024-05-01 Price Changed $157,000 WNYREIS
- 2024-04-11 Price Changed $158,000 WNYREIS
- 2024-03-28 Listed $160,000 WNYREIS
- 2023-08-28 Listing Removed — WNYREIS
- 2023-06-21 Price Changed $184,900 WNYREIS
- 2023-05-28 Listed $195,000 WNYREIS
- 2020-09-25 Sold (MLS) $50,000 WNYREIS
- 2020-07-07 Pending — WNYREIS
- 2020-05-22 Listed $59,000 WNYREIS
- 2020-02-10 Sold (MLS) $43,000 WNYREIS
- 2019-12-30 Pending — WNYREIS
- 2019-10-25 Listed $49,900 WNYREIS
- 2006-09-22 Sold (Public Records) $42,000 Public Records
- 2005-10-13 Sold (Public Records) $40,000 Public Records
Property tax history
+5.8%/yrLatest (2025): $3,112 · +19.3% YoY. Source: county tax records.
Cash-flow waterfall
monthlySold comps — $/sqft
last 12 mo · ≤1 miLoading sold comps…