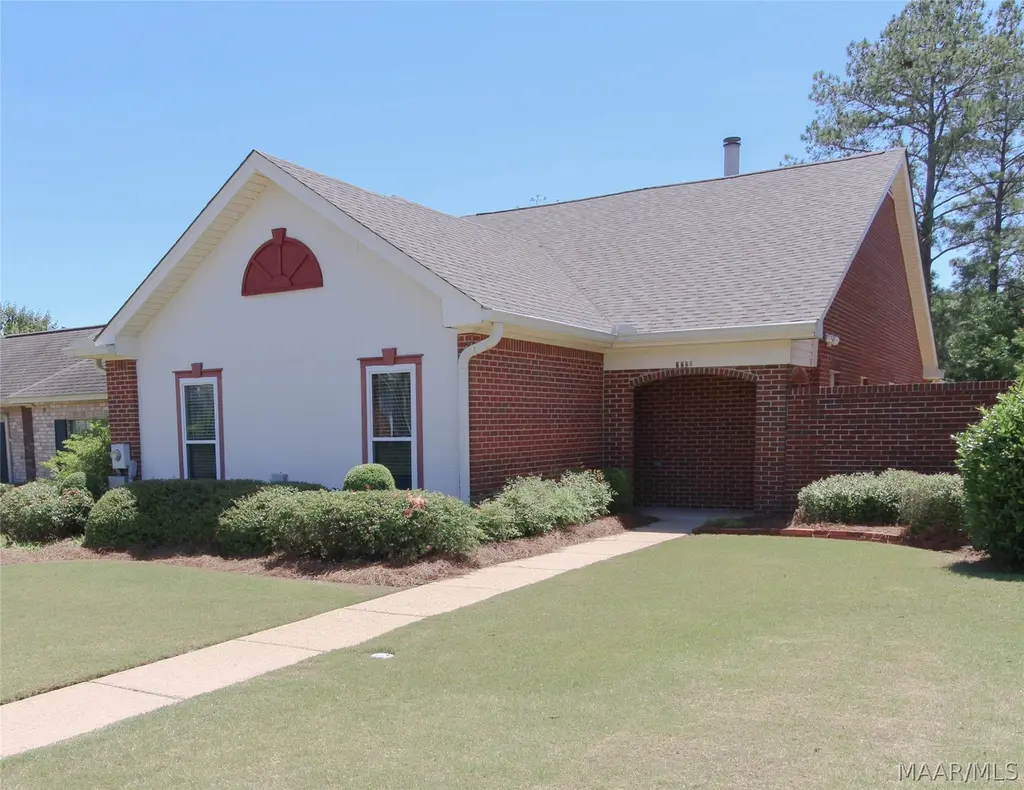
3221 Gatsby Ln · Montgomery, AL
Flood risk 1/10 · Minimal
- FEMA flood zone
- X (unshaded)
- Chance of flooding over 30 yrs
- 0.0%
- Est. flood insurance / yr
- $507 – $1,088
Fire risk 1/10 · Minimal
- Est. fire insurance / yr
- $916 – $1,700
Heat risk 7/10 · Major
- Hot days now (above 107°F)
- 7 days/yr
- Hot days in 30 yrs
- 20 days/yr
Wind risk 6/10 · Moderate
- Chance of severe wind over 30 yrs
- 77.0%
Air-quality risk 3/10 · Minor
- Unhealthy air days now
- 4 days/yr
- Unhealthy air days in 30 yrs
- 4 days/yr
Risk factors via First Street. Map © Google.
Why this score? — see what drove the C- grade
The composite is a weighted blend of 9 inputs, each scored 0–100. Each bar is that input's sub-score; the figure is the points it added to the 100-point composite (weight × sub-score).
- Cash flow +20.1/30.0
- ARV discount +11.6/15.0
- DSCR +6.4/10.0
- 1% rule +4.2/10.0
- Rent growth +4.1/5.0
- Livability +3.2/5.0
- Condition / age +2.5/5.0
- Schools +1.7/10.0
- Appreciation +0.0/10.0
$150,000
🖨 Deal sheet 📄 Offer letter ✓ Due diligence
Listing remarks
Charming brick home located in Hillwood, one of the area’s most desirable locations. Offering the perfect blend of comfort and convenience. Just minutes from shopping, dining and I-85. You’ll enjoy easy access to everyday essentials without sacrificing peace and privacy. From the street, this home makes an immediate impression with its beautifully established front yard. Thoughtfully designed landscaping frames the property, featuring blooming flowers and year-round lush greenery, and an easy-to-maintain lawn keeps upkeep simple. Out back, you'll find a private covered porch, ideal for an intimate gathering with space for a table and chairs or a swing. The backyard is landscaped
Key facts
- 6,534 sq ft lot
- Parking
- Built 1986
Property features AI
Finance
- Other: Annual taxes available (not included per instructions)
- HOA & community: Annual association fee of $69
Exterior
- Parking: Attached carport; 1 carport space; 4 parking pads
- Security: Security system; Fire alarm
- Utilities: Public water; Public sewer; Electricity available; Natural gas available; Cable available; High-speed internet available
- Home design: Single-story; Brick and stucco exterior; Slab foundation
- Construction: Built (year per public records); Brick and stucco construction; Slab foundation
- Exterior features: Covered patio; Covered porch; Storage; City lot; Lot dimensions approximately 41 x 164
Interior
- Kitchen: Dishwasher; Electric range; Microwave with hood fan; Garbage disposal; Refrigerator; Plumbed for ice maker
- Flooring: Carpet; Tile
- Bathrooms: 2 full bathrooms
- Heating & cooling: Heat pump heating; Heat pump cooling; Ceiling fans
- Interior features: Tray ceilings; Window treatments (blinds); Breakfast bar; One gas-log fireplace
- Laundry & utility: Washer hookup; Dryer (included); Gas water heater
Neighborhood map
What this means for you Summary
Snapshot
- This is a 3-bed/2.0-bath single-family listed at $150k.
Deal economics
- At list price, monthly cash flow is $186 ($2k/yr) — positive.
- The deal already cash-flows at list — no discount required.
- To meet the 1% rule (rent ≥ 1% of price), the offer needs to be $139k (7.5% below list).
- Recommended offer: $139k (7.5% below list) — sets the bar for 1% rule.
- Cap rate 7.8% vs local median 6.0% in Montgomery — meaningfully above typical; check what's discounted (condition, days-on-market, listing class) to confirm the premium yield is real.
Location & tenants
- Location reads 65/100 on livability (#138 in AL) — a middle-class / working-renter tenant base. Strengths: cost of living A+, housing A+; Watch: schools C-, employment D, crime F.
- Montgomery County (urban): math 9% / reading 31% proficiency, ranked #106 of 129 in AL (top 82%) — low school quality limits family demand, transient renter base, plan for 1-2y turnover; 70% free/reduced lunch — lower-income household profile, screen leases tightly.
- Market conditions: Rents rising fast (+6.3%/yr); 137 active listings in the ZIP; 40 comparable units currently listed for rent nearby; rentals at typical pace (median 21d on market — plan ~3-4 weeks tenant-placement turnaround); 45% of comp listings sitting > 30 days — soft ceiling on asking rent; 460 units permitted in Montgomery County in 2024 (37 in 5+ unit buildings).
Forward outlook
- Local home prices are declining (-3.0%/yr); year-one equity from $1k of loan paydown is wiped out by about $4k of value loss. Plan a longer hold.
- Montgomery County population projected to shrink 8% by 2050 — rents likely to lag national; underwrite the cash flow, not the appreciation.
Negotiation context
- It's been on market 33 days — a 3% lower offer ($146k) is reasonable based on typical stale-listing flexibility.
Risks & watch-outs
- Climate carrying-cost: major wind risk, 77% chance of damaging wind over 30y; extreme-heat days projected 7→20/yr by 2055 (HVAC capex compounding) — expect insurance premiums to compound above CPI over the hold.
Questions for the listing agent
- It's been on market 33 days. Have you received any prior offers? Is the seller open to a 8% concession, seller financing, or rate buy-down credit?
- What does the HOA fee cover, when was the last increase, and are there any pending special assessments or reserve-fund shortfalls?
- Is there a deadline driving the sale (1031 exchange, divorce, estate, relocation)? That informs how much negotiation room exists.
- Crime grade is F in this area — have there been break-ins, vandalism, or insurance claims at this property in the last 3 years? What carrier currently insures it and at what premium?
- What's the average days-on-market for RENTAL listings here right now (not sales)? A rising rental-DOM trend means longer vacancies and softer asking-rent achievability than the comps imply.
- What's the recent tenant-quality profile in this submarket — average credit score on applications, eviction rate, late-payment / NSF rate, and stable-employment percentage? A property-management company in the area should have these aggregated.
- How much new for-sale + rental construction is in the pipeline within 1–3 miles? Heavy new supply typically softens prices + rents 12–24 months out; constrained supply supports both.
Investment metrics
- 1% rule
- 0.92% ✗
- Cap rate
- 7.78%
- Cash-on-cash
- 5.30%
- DSCR
- 1.24
- GRM
- 9.0
CMA / ARV
- ARV (median comp)
- $164,949
- List price
- $150,000
- Delta
- -9.06%
- Verdict
- FAIR
- Comps
- 20 within 1.0 mi
Show comp detail 12 sales within ~0.75 mi
| Address | Dist | Beds/Ba | Sqft | Sold | Price | $/sf | Match |
|---|---|---|---|---|---|---|---|
| 3221 Gatsby Ln | 0.00mi | 3/2.0 | 1,491 (0%) | 0mo | $150,000 | $101 | 100 |
| 1232 Zephyr Hills Dr | 0.16mi | 4/2.0 (+1) | 1,497 (+0%) | 1mo | $128,675 | $86 | 86 |
| 1244 Zephyr Hills Dr | 0.15mi | 4/2.0 (+1) | 1,497 (+0%) | 7mo | $155,000 | $104 | 82 |
| 1300 Zephyr Hills Dr | 0.15mi | 3/2.0 | 1,389 (-7%) | 6mo | $91,500 | $66 | 77 |
| 1728 Robison Hill Rd | 0.50mi | 3/2.0 | 1,574 (+6%) | 1mo | $65,500 | $42 | 66 |
| 2739 Green Oaks Dr | 0.39mi | 3/2.0 | 1,572 (+5%) | 9mo | $122,000 | $78 | 66 |
| 1820 Robison Hill Rd | 0.54mi | 3/2.0 | 1,423 (-5%) | 9mo | $115,000 | $81 | 60 |
| 3243 Durham Dr | 0.44mi | 4/2.0 (+1) | 1,363 (-9%) | 1mo | $150,000 | $110 | 60 |
| 1204 Zephyr Hills Dr | 0.22mi | 4/2.0 (+1) | 1,319 (-12%) | 8mo | $164,900 | $125 | 59 |
| 1229 Karen Rd | 0.42mi | 4/2.0 (+1) | 1,344 (-10%) | 3mo | $92,000 | $68 | 56 |
| 2948 Canterbury Dr | 0.66mi | 3/2.0 | 1,702 (+14%) | 4mo | $155,000 | $91 | 43 |
| 2958 Old Farm Rd | 0.66mi | 2/2.0 (-1) | 1,712 (+15%) | 6mo | $159,000 | $93 | 34 |
Match score weights: distance 35% · size 25% · config 20% · recency 20%. Top-matched comps best support the ARV.
Projected returns pro-forma
-3.0% appreciation · 6.29% rent growth · sell at horizon
- IRR
- -4.8%
- Equity multiple
- 0.81×
- Total profit
- $-7,799
- Equity at exit
- $22,365
- IRR
- 8.0%
- Equity multiple
- 1.69×
- Total profit
- $29,024
- Equity at exit
- $12,969
Cash invested: $42,000 (down + closing). Projections, not guarantees.
Landlord ↔ Tenant lean methodology
- Overall (STATE)
- 90 Strongly Landlord-Friendly
- State Alabama
- 90 Strongly Landlord-Friendly · R+15
- County
- — inherits STATE
- City
- — inherits STATE
ZIP-level market 36106
- Home prices YoY
- -13.1%
- Rents YoY
- 6.3%
- Active inventory
- 137
- Price-to-rent
- 9.0×
Monthly cashflow live
- Estimated rent
- $1,387 high interval (Pro) →
- Mortgage (P&I)
- −$787
- Tax from tax record
- −$55 /mo · $660/yr
- Insurance
- −$62
- HOA
- −$6
- Vacancy / Maint / Mgmt
- −$291
- Net cashflow
- $186
Break-even live
UW: 25.0% down · 7.5% · 30yr · 1.5% tax · 5.0% vac · 8.0% maint · 8.0% mgmt
Financing live
Cash to close
- Down payment
- $37,500
- Closing costs
- $4,500
- Reserves months
- —
- Total cash needed
- —
Loan-product check · same deal, 3 products live
Conventional
25% down · 7.5% · 30yr
- Down + closing
- —
- Monthly P&I
- —
- Monthly cashflow
- —
- DSCR
- —
- Eligible?
- —
Personal DTI + credit; lowest rate.
DSCR
20% down · 8.5% · 30yr
- Down + closing
- —
- Monthly P&I
- —
- Monthly cashflow
- —
- DSCR
- —
- Eligible?
- —
No personal income docs; deal must DSCR.
Hard money
10% down · 12.0% · 12mo
- Down + closing
- —
- Monthly P&I
- —
- Monthly cashflow
- —
- DSCR
- —
- Eligible?
- —
Short-term bridge; refi at stabilization.
Rent comps 40 comps
| Address | Beds | Baths | Sqft | Rent | $/sqft | DOM | Units | Dist |
|---|---|---|---|---|---|---|---|---|
| 2845 Zelda Rd Montgomery, AL | 2.0 | 2.0 | 1013 | $1,042 | $1.03 | 13d | 3 | 0.14mi |
| 3318 Habersham Rd Montgomery, AL | 3.0 | 2.0 | 1134 | $1,250 | $1.10 | 13d | 1 | 0.25mi |
| 2736 Chevy Chase Dr Montgomery, AL | 3.0 | 1.0 | 1100 | $1,300 | $1.18 | 43d | 1 | 0.37mi |
| 1216 Karen Rd Montgomery, AL | 3.0 | 2.0 | 1620 | $1,350 | $0.83 | 13d | 1 | 0.38mi |
| 1229 Karen Rd Montgomery, AL | 4.0 | 2.0 | 1344 | $1,590 | $1.18 | 43d | 1 | 0.40mi |
| 3346 Bedford Ln Montgomery, AL | 3.0 | 1.0 | 1134 | $1,295 | $1.14 | 13d | 1 | 0.44mi |
| 3323 Bedford Ln Montgomery, AL | 3.0 | 2.0 | 1134 | $1,200 | $1.06 | 21d | 1 | 0.45mi |
| 3359 Bedford Ln Montgomery, AL | 4.0 | 2.0 | 1786 | $1,600 | $0.90 | 13d | 1 | 0.45mi |
| 1814 Pinecrest Dr Montgomery, AL | 3.0 | 1.0 | 1053 | $990 | $0.94 | 43d | 1 | 0.48mi |
| 3136 Harrison Rd Montgomery, AL | 3.0 | 1.5 | 1355 | $1,025 | $0.76 | 43d | 1 | 0.51mi |
| 1154 Lakewood Dr Montgomery, AL | 3.0 | 2.0 | 1066 | $1,350 | $1.27 | 43d | 1 | 0.51mi |
| 1814 Sylvan Dr Montgomery, AL | 3.0 | 2.0 | 1785 | $1,400 | $0.78 | 21d | 1 | 0.52mi |
| 1117 Karen Rd Montgomery, AL | 3.0 | 1.0 | 1308 | $1,195 | $0.91 | 43d | 1 | 0.53mi |
| 1839 Robison Hill Rd Montgomery, AL | 4.0 | 2.0 | 1370 | $1,550 | $1.13 | 21d | 1 | 0.56mi |
| 3456 Harrison Rd Montgomery, AL | 3.0 | 1.0 | 1008 | $1,300 | $1.29 | 43d | 1 | 0.63mi |
| 926 Green Ridge Ct Montgomery, AL | 3.0 | 2.0 | 1665 | $1,381 | $0.83 | 13d | 1 | 0.73mi |
| 1842 Gillespie Dr Montgomery, AL | 4.0 | 2.0 | 1620 | $1,650 | $1.02 | 43d | 1 | 0.73mi |
| 1216 Beechdale Rd Montgomery, AL | 4.0 | 2.0 | 1495 | $1,325 | $0.89 | 43d | 1 | 0.75mi |
| 2014 Commodore St Montgomery, AL | 3.0 | 2.0 | 1613 | $1,450 | $0.90 | 13d | 1 | 0.85mi |
| 2454 Spruce Curv Montgomery, AL | 3.0 | 1.0 | 988 | $1,100 | $1.11 | 43d | 1 | 0.85mi |
| 844 Sir Michael Dr Montgomery, AL | 4.0 | 2.0 | 1502 | $1,650 | $1.10 | 43d | 1 | 0.85mi |
| 817 Dumont Dr Montgomery, AL | 3.0 | 2.0 | 1635 | $1,800 | $1.10 | 13d | 1 | 0.88mi |
| 908 Greg Dr Montgomery, AL | 3.0 | 1.0 | 1520 | $1,100 | $0.72 | 21d | 1 | 0.95mi |
| 2045 Bullard St Unit 1043526P Montgomery, AL | 3.0 | 2.0 | 1797 | $2,198 | $1.22 | 43d | 1 | 0.97mi |
| 895 Greg Dr Montgomery, AL | 3.0 | 2.0 | 1489 | $1,600 | $1.07 | 13d | 1 | 0.99mi |
| 860 Greg Dr Montgomery, AL | 3.0 | 2.0 | 1400 | $1,295 | $0.93 | 13d | 1 | 1.04mi |
| 3309 Hillcrest Ln Unit 1043908P Montgomery, AL | 4.0 | 2.0 | 1625 | $2,885 | $1.78 | 21d | 1 | 1.07mi |
| 2205 E 5th St Montgomery, AL | 3.0 | 1.0 | 1020 | $800 | $0.78 | 43d | 1 | 1.08mi |
| 688 Joryne Dr Montgomery, AL | 3.0 | 2.0 | 1500 | $1,200 | $0.80 | 43d | 1 | 1.10mi |
| 2226 Carter Hill Rd Montgomery, AL | 2.0 | 1.0 | 1506 | $905 | $0.60 | 43d | 1 | 1.10mi |
| 311 Bradley Dr Montgomery, AL | 3.0 | 1.0 | 1104 | $825 | $0.75 | 43d | 1 | 1.12mi |
| 4041A Beth Manor Dr Montgomery, AL | 1.0–3.0 | 1.0–2.0 | 925 | $1,000 | $1.08 | 21d | 20 | 1.16mi |
| 3233 Hillcrest Ln Montgomery, AL | 3.0 | 2.0 | 1278 | $1,395 | $1.09 | 21d | 1 | 1.19mi |
| 401 Ridgewood Ln Montgomery, AL | 3.0 | 2.0 | 1513 | $1,195 | $0.79 | 21d | 1 | 1.24mi |
| 3602 Little John Dr Montgomery, AL | 4.0 | 1.0 | 1286 | $1,400 | $1.09 | 21d | 1 | 1.25mi |
| 2020 E 3rd St Montgomery, AL | 2.0 | 1.0 | 1186 | $750 | $0.63 | 21d | 1 | 1.26mi |
| 122 Oak Forest Dr Montgomery, AL | 3.0 | 1.0 | 1092 | $975 | $0.89 | 21d | 1 | 1.30mi |
| 750 S Marquette Dr Montgomery, AL | 3.0 | 1.0 | 1325 | $1,195 | $0.90 | 43d | 1 | 1.31mi |
| 1425 Blairwood Montgomery, AL | 3.0 | 2.0 | 1700 | $1,850 | $1.09 | 13d | 1 | 1.36mi |
| 1450 Crenshaw Pl S Montgomery, AL | 3.0 | 2.0 | 1641 | $1,775 | $1.08 | 43d | 1 | 1.36mi |
HOA detail
- Monthly dues
- $6 · $72/yr
- Likely covers
- landscaping
Listing history 10 events
-
2026-06-09status $150,000 Pending 33 DOM
-
2026-06-08days on market $150,000 Contingent 33 DOM
-
2026-06-07days on market $150,000 Contingent 32 DOM
-
2026-06-03days on market $150,000 Contingent 28 DOM
-
2026-06-02days on market $150,000 Contingent 27 DOM
-
2026-06-01days on market $150,000 Contingent 26 DOM
-
2026-05-31days on market $150,000 Contingent 25 DOM
-
2026-05-30days on market $150,000 Contingent 24 DOM
-
2026-05-08historical Contingent 2016-char remark
-
2026-05-06$150,000 Active 2016-char remark
ⓘ Source: listings_history table (triggers on properties + properties_extension) + one-shot
backfill from property_details.listing_events for pre-trigger history.
Tax reassessment forecast AL · Resets to sale price
- Current annual tax
- $660 · $55/mo
- Projected year-2 tax
- $660 · $55/mo
- Expected delta
- $0/yr ($0/mo · 0.0%)
ⓘ Screening estimate from a state-policy table — verify with the county assessor before closing.
Climate risk First Street
- Flood 1/10 Low FEMA zone X (unshaded) · 0% chance over 30 yrs
- Wildfire 1/10 Low
- Heat 7/10 Severe 7 d/yr ≥107°F today · 20 d/yr by 30 yrs out
- Wind 6/10 Major 77% chance of damaging wind over 30 yrs
- Air quality 3/10 Moderate 4 unhealthy d/yr today · 4 by 30 yrs out
Nearby sold comps map
Loading sold comps map…
Walkable amenities ~0.75 mi
Loading nearby amenities…
Taxation est. · year 1
- Rental income
- $16,644
- − Mortgage interest
- −$8,402
- − Property taxes
- −$660
- − Insurance
- −$750
- − Repairs & maintenance
- −$1,332
- − Management
- −$1,332
- − HOA
- −$72
- − Depreciation
- −$4,364
- Taxable loss
- −$267
- Est. tax savings @ 24.0%
- +$64
- After-tax cash flow
- $2,291/yr
For passive investors: Depreciation is non-cash, so a rental often shows a tax loss while cash-flowing — sheltering income. Rental losses are passive: they offset passive income freely, and up to $25,000/yr can offset ordinary (W-2) income if you actively participate and your MAGI is under $100k (phasing out to $0 by $150k); unused losses carry forward. On sale, claimed depreciation is recaptured at up to 25%, and gains may owe capital-gains tax (a 1031 exchange can defer both). Figures are a year-1 estimate at your 24.0% rate — not tax advice; consult a CPA.
Schools (NCES district)
- District
- Montgomery County
- NCES district ID
- 0102430
- Math proficiency
- 9% ▼ -21.00%
- Reading proficiency
- 31% ▼ -1.00%
- Median HH income
- $43,902
- Composite
- 17.24/100
- National rank
- #9093
- State rank
- #106 of 129 in AL
Livability — Montgomery
- Score
- 65/100
- State rank
- #138
- US rank
- #13416
Category grades
Schools grade is shown separately in the Schools card above.
Census & demographics
- Census place
- Montgomery, AL
- County
- Montgomery County · 190,016 people
- City population
- 175,913
- Metro
- Montgomery, AL
- Population (ZIP)
- 14,065
- Household income
- $69,087
- Rent vs Own
- Severe rent burden
- 876.0
Population outlook (Montgomery County) Hauer SSP2
- Today (2025)
- 224,008 people
- By 2030
- 221,460 · -1.1%
- By 2040
- 214,179 · -4.4%
- By 2050
- 204,912 · -8.5%
- By 2075
- 177,821 · -20.6%
- By 2100
- 145,134 · -35.2%
Race, ethnicity, and origin ACS 2023
- Neighborhood character
- Diverse neighborhood (Simpson 0.58)
- Race & ethnicity
- White 47% Black 43% Hispanic / Latino 5% Two or more races 4% Asian 1%
- Hispanic origin (detail)
- Mexican 3%
- Common ancestry
- Serbian 2% Slovak 2% Italian 1%
- Foreign-born
- 4% · Canada, China, South Korea
- Languages at home
- 94% English-only · Spanish 3%
Political lean MEDSL · Montgomery
- 2024 margin
- Solid D (+30.7) · D 64.8% · R 34.1% · Other 1.1%
- 2008→2024 swing
- +11.5pp toward D · 2008: 19.2pp · 2024: 30.7pp
- All cycles
- 2024: D+30.7 2020: D+31.5 2016: D+26.2 2012: D+24.3 2008: D+19.2
Not yet ingested
- Civics
- —
Market trends
- HPI YoY
- ▼ -22.82%
- Current HPI
- 151.1822
- Rent YoY
- ▲ 6.29%
- Metro
- Montgomery, AL
- State GDP YoY
- ▲ 2.94%
- F500 in state
- 4
Industry mix (Fortune 500 HQ in AL)
| Industry | F500 HQs | Revenue |
|---|---|---|
| Financial Services | 1 | $8B |
|
||
| Healthcare | 1 | $5B |
|
||
Price history
+0.0% since first listed4 events — show timeline
- 2026-06-08 Pending — MAAR
- 2026-06-08 Sold (MLS) $150,000 MAAR
- 2026-05-08 Contingent — MAAR
- 2026-05-06 Listed $150,000 MAAR
Property tax history
+4.0%/yrLatest (2025): $660 · +3.1% YoY. Source: county tax records.
Cash-flow waterfall
monthlySold comps — $/sqft
last 12 mo · ≤1 miLoading sold comps…