 🏷️ Likely Rental
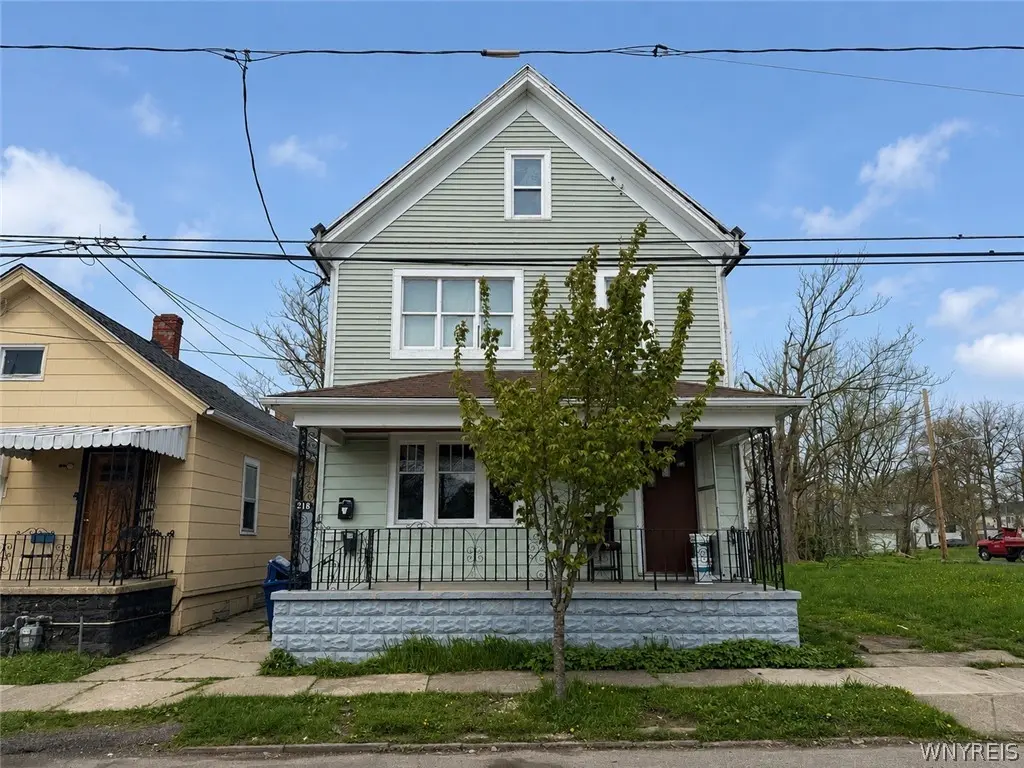
218 Coit St · Buffalo, NY
Flood risk 1/10 · Minimal
- FEMA flood zone
- X (unshaded)
- Chance of flooding over 30 yrs
- 0.0%
- Est. flood insurance / yr
- $473 – $860
Fire risk 1/10 · Minimal
- Est. fire insurance / yr
- $691 – $1,283
Heat risk 2/10 · Minimal
- Hot days now (above 92°F)
- 7 days/yr
- Hot days in 30 yrs
- 15 days/yr
Wind risk 1/10 · Minimal
- Chance of severe wind over 30 yrs
- —
Air-quality risk 3/10 · Minor
- Unhealthy air days now
- 2 days/yr
- Unhealthy air days in 30 yrs
- 3 days/yr
Risk factors via First Street. Map © Google.
Why this score? — see what drove the A grade
The composite is a weighted blend of 9 inputs, each scored 0–100. Each bar is that input's sub-score; the figure is the points it added to the 100-point composite (weight × sub-score).
- Cash flow +30.0/30.0
- ARV discount +15.0/15.0
- 1% rule +10.0/10.0
- DSCR +10.0/10.0
- Appreciation +10.0/10.0
- Livability +3.9/5.0
- Schools +3.3/10.0
- Rent growth +2.5/5.0
- Condition / age +2.5/5.0
$139,900
🖨 Deal sheet 📄 Offer letter ✓ Due diligence
Multi-family units
County records classify this as Multi-Family (2-4 Unit). Listing-text estimate: 1 unit. estimate disagrees with records
Listing remarks
Dreams Made Real! Three residential units at a hard to find price. Electrical updates both interior and exterior. The current tenants are all month-to-month with rents at $1000, $900, and $400 respectively. This is a cash cow. Walking distance from the historic Central Terminal and just 1.9 miles from downtown Buffalo. Only five blocks from The Broadway Market for the worldly assortment of fresh and prepared foods. Showings are available for all 3 units M/T/W 3-5pm by confirmed appointment. Saturday is a possibility, but prefer weekdays.
Key facts
- Electrical updates
- 3,240 sq ft lot
- Built 1900
Tags
Property features AI
Finance
- Financial info: Three total units; Owner pays water; rent includes water; Unit rents reported: $1,000; $900; $400; Operating expenses: see remarks
Exterior
- Parking: Concrete parking
- Utilities: Public water connected; Sewer connected; Circuit breaker electric
- Home design: Two-story building; Existing property condition
- Construction: Vinyl siding; Wood siding; Stone foundation; Asphalt roof; Copper plumbing; Built previously (existing structure)
- Exterior features: Rectangular residential lot; City street frontage; Lot dimensions approximately 30 x 108
Interior
- Kitchen: Kitchens in each unit (appliances not specified)
- Bedrooms: Three 2-bedroom units
- Flooring: Carpet; Hardwood; Tile; Vinyl; Varied flooring throughout
- Bathrooms: Three full bathrooms (one per unit)
- Heating & cooling: Gas hot water heating
- Interior features: Full basement; Gas water heater
- Laundry & utility: Separate gas meters for each unit; Separate electric meters for each unit
Neighborhood map
What this means for you Summary
Snapshot
- This is a 6-bed/3.0-bath multifamily listed at $140k.
Deal economics
- At list price, monthly cash flow is $2k ($22k/yr) — positive.
- The deal already cash-flows at list — no discount required.
- Meets the 1% rule at list price ($3k rent vs $140k).
- Recommended offer: $138k (1.5% below list) — sets the bar for market timing.
- Cap rate 22.1% vs local median 8.0% in Buffalo — top-decile yield for the area; either an underpriced asset or a hidden risk that comps aren't pricing in. Stress-test before assuming the spread holds.
Location & tenants
- Location reads 77/100 on livability (#195 in NY, #3,011 nationally) — a middle-class / working-renter tenant base. Strengths: commute A+, housing A+, health & safety A+; Watch: crime F, employment D-.
- Buffalo City School District (urban): math 41% / reading 40% proficiency, ranked #535 of 590 in NY (top 91%) — families likely to look elsewhere, expect single-tenant / working-renter base with shorter leases; 75% free/reduced lunch — lower-income household profile, screen leases tightly.
- Market conditions: 83 active listings in the ZIP; 1 comparable units currently listed for rent nearby; 1,244 units permitted in Erie County in 2024 (563 in 5+ unit buildings).
Forward outlook
- In year one you build about $15k of equity ($967 loan paydown + $14k appreciation (10.0% local appreciation)).
- At projected returns (10.0% appreciation + 3.0% rent growth), your $39k cash investment doubles in ~2 years — after that, you're playing with house money.
- By year 3, paydown + projected appreciation supports a ~$38k cash-out refi (75% LTV) — recoverable capital for the next deal without selling this one.
Negotiation context
- It's been on market 24 days — a 2% lower offer ($138k) is reasonable based on typical stale-listing flexibility.
Risks & watch-outs
- Watch-outs: built in 1900 — expect roof / HVAC / electrical / plumbing capex.
Questions for the listing agent
- Built in 1900 — when were the roof, HVAC, electrical panel, plumbing, and water heater last replaced?
- Is there a deadline driving the sale (1031 exchange, divorce, estate, relocation)? That informs how much negotiation room exists.
- Crime grade is F in this area — have there been break-ins, vandalism, or insurance claims at this property in the last 3 years? What carrier currently insures it and at what premium?
- What's the average days-on-market for RENTAL listings here right now (not sales)? A rising rental-DOM trend means longer vacancies and softer asking-rent achievability than the comps imply.
- What's the recent tenant-quality profile in this submarket — average credit score on applications, eviction rate, late-payment / NSF rate, and stable-employment percentage? A property-management company in the area should have these aggregated.
- How much new apartment / multifamily construction is in the pipeline within 1–3 miles? Heavy new supply (>2% of stock underway) typically softens rents 12–24 months out; light construction supports rent growth.
Investment metrics
- 1% rule
- 2.43% ✓
- Cap rate
- 22.13%
- Cash-on-cash
- 56.56%
- DSCR
- 3.52
- GRM
- 3.4
CMA / ARV
- ARV (median comp)
- $179,395
- List price
- $139,900
- Delta
- -22.02%
- Verdict
- UNDERPRICED
- Comps
- 20 within 1.0 mi
Show comp detail 8 sales within ~0.75 mi
| Address | Dist | Beds/Ba | Sqft | Sold | Price | $/sf | Match |
|---|---|---|---|---|---|---|---|
| 144 Grey St | 0.51mi | 6/2.0 | 2,568 (-2%) | 8mo | $70,000 | $27 | 61 |
| 75 Mills St | 0.56mi | 5/3.0 (-1) | 2,506 (-5%) | 3mo | $130,100 | $52 | 58 |
| 555 Fillmore Ave | 0.22mi | 6/2.0 | 2,376 (-10%) | 16mo | $225,000 | $95 | 56 |
| 398 Emslie St | 0.33mi | 7/2.5 (+1) | 2,816 (+7%) | 13mo | $200,000 | $71 | 55 |
| 455 Fillmore Ave | 0.34mi | 6/2.0 | 2,428 (-8%) | 22mo | $95,000 | $39 | 49 |
| 25 Woltz Ave | 0.54mi | 7/3.0 (+1) | 2,320 (-12%) | 11mo | $135,000 | $58 | 41 |
| 878 Clinton St | 0.65mi | 6/2.0 | 2,400 (-9%) | 14mo | $130,000 | $54 | 39 |
| 574 Howard St | 0.69mi | 5/2.0 (-1) | 2,508 (-5%) | 15mo | $90,000 | $36 | 38 |
Match score weights: distance 35% · size 25% · config 20% · recency 20%. Top-matched comps best support the ARV.
Projected returns pro-forma
10.0% appreciation · 3.0% rent growth · sell at horizon
- IRR
- 69.2%
- Equity multiple
- 5.95×
- Total profit
- $193,759
- Equity at exit
- $126,033
- IRR
- 62.9%
- Equity multiple
- 13.20×
- Total profit
- $478,054
- Equity at exit
- $271,795
Cash invested: $39,172 (down + closing). Projections, not guarantees.
Landlord ↔ Tenant lean methodology
- Overall (STATE)
- 15 Strongly Tenant-Friendly
- State New York
- 15 Strongly Tenant-Friendly · D+10
- County
- — inherits STATE
- City
- — inherits STATE
ZIP-level market 14212
- Home prices YoY
- 20.4%
- Active inventory
- 83
- Price-to-rent
- 10.3×
Monthly cashflow live
- Estimated rent
- $3,395 high interval (Pro) →
- Mortgage (P&I)
- −$734
- Tax from tax record
- −$44 /mo · $525/yr
- Insurance
- −$58
- HOA
- −$0
- Vacancy / Maint / Mgmt
- −$713
- Net cashflow
- $1,846
Break-even live
3-unit breakdown (identical units grouped — click to expand)
| Units | Beds | Baths | Est. rent |
|---|---|---|---|
| 3× units | 2 | 1 | $3,396 |
| #1 | 2 | 1 | $1,132 |
| #2 | 2 | 1 | $1,132 |
| #3 | 2 | 1 | $1,132 |
| Total (3 units) | $3,395 | ||
UW: 25.0% down · 7.5% · 30yr · 1.5% tax · 5.0% vac · 8.0% maint · 8.0% mgmt
Financing live
Cash to close
- Down payment
- $34,975
- Closing costs
- $4,197
- Reserves months
- —
- Total cash needed
- —
Loan-product check · same deal, 3 products live
Conventional
25% down · 7.5% · 30yr
- Down + closing
- —
- Monthly P&I
- —
- Monthly cashflow
- —
- DSCR
- —
- Eligible?
- —
Personal DTI + credit; lowest rate.
DSCR
20% down · 8.5% · 30yr
- Down + closing
- —
- Monthly P&I
- —
- Monthly cashflow
- —
- DSCR
- —
- Eligible?
- —
No personal income docs; deal must DSCR.
Hard money
10% down · 12.0% · 12mo
- Down + closing
- —
- Monthly P&I
- —
- Monthly cashflow
- —
- DSCR
- —
- Eligible?
- —
Short-term bridge; refi at stabilization.
Rent comps 1 comps
| Address | Beds | Baths | Sqft | Rent | $/sqft | DOM | Units | Dist |
|---|---|---|---|---|---|---|---|---|
| 518 Wilson St Buffalo, NY | 5.0 | 1.5 | 1848 | $1,500 | $0.81 | 24d | 1 | 0.73mi |
Listing history 6 events
-
2026-06-07statusdays on market $139,900 Pending 24 DOM
-
2026-06-03days on market $139,900 Active 21 DOM
-
2026-06-02days on market $139,900 Active 20 DOM
-
2026-06-01days on market $139,900 Active 19 DOM
-
2026-05-31days on market $139,900 Active 18 DOM
-
2026-05-13$139,900 Active 543-char remark
ⓘ Source: listings_history table (triggers on properties + properties_extension) + one-shot
backfill from property_details.listing_events for pre-trigger history.
Tax reassessment forecast NY · Partial reset (capped growth)
- Current annual tax
- $525 · $44/mo
- Projected year-2 tax
- $1,445 · $120/mo
- Expected delta
- +$920/yr (+$77/mo · 175.1%)
ⓘ Screening estimate from a state-policy table — verify with the county assessor before closing.
Climate risk First Street
- Flood 1/10 Low FEMA zone X (unshaded) · 0% chance over 30 yrs
- Wildfire 1/10 Low
- Heat 2/10 Low 7 d/yr ≥92°F today · 15 d/yr by 30 yrs out
- Wind 1/10 Low
- Air quality 3/10 Moderate 2 unhealthy d/yr today · 3 by 30 yrs out
Nearby sold comps map
Loading sold comps map…
Walkable amenities ~0.75 mi
Loading nearby amenities…
Taxation est. · year 1
- Rental income
- $40,740
- − Mortgage interest
- −$7,837
- − Property taxes
- −$525
- − Insurance
- −$700
- − Repairs & maintenance
- −$3,259
- − Management
- −$3,259
- − Depreciation
- −$4,070
- Taxable income
- $21,091
- Est. tax owed @ 24.0%
- −$5,062
- After-tax cash flow
- $17,094/yr
For passive investors: Depreciation is non-cash, so a rental often shows a tax loss while cash-flowing — sheltering income. Rental losses are passive: they offset passive income freely, and up to $25,000/yr can offset ordinary (W-2) income if you actively participate and your MAGI is under $100k (phasing out to $0 by $150k); unused losses carry forward. On sale, claimed depreciation is recaptured at up to 25%, and gains may owe capital-gains tax (a 1031 exchange can defer both). Figures are a year-1 estimate at your 24.0% rate — not tax advice; consult a CPA.
Schools (NCES district)
- District
- Buffalo City School District
- NCES district ID
- 3605850
- Math proficiency
- 41% ▲ 11.00%
- Reading proficiency
- 40% ▲ 7.00%
- Median HH income
- $31,665
- Composite
- 33.17/100
- National rank
- #5544
- State rank
- #535 of 590 in NY
Livability — Buffalo
- Score
- 77/100
- State rank
- #195
- US rank
- #3011
Category grades
Schools grade is shown separately in the Schools card above.
Census & demographics
- Census place
- Buffalo, NY
- City population
- 440,021
- Population (ZIP)
- 13,603
Population outlook (Erie County) Hauer SSP2
- Today (2025)
- 933,037 people
- By 2030
- 935,181 · +0.2%
- By 2040
- 928,531 · -0.5%
- By 2050
- 905,725 · -2.9%
- By 2075
- 834,037 · -10.6%
- By 2100
- 708,033 · -24.1%
Race, ethnicity, and origin ACS 2023
- Neighborhood character
- Highly diverse neighborhood (Simpson 0.75)
- Race & ethnicity
- White 32% Black 27% Asian 25% Hispanic / Latino 9% Two or more races 8%
- Hispanic origin (detail)
- Puerto Rican 8%
- Common ancestry
- Romanian 12% Serbian 1% Lithuanian 1%
- Foreign-born
- 20% · Philippines, Canada, China
- Languages at home
- 68% English-only · Other Indo-European 18% Spanish 4% Other Asian/Pacific 2%
Political lean MEDSL · Erie
- 2024 margin
- Lean D (+9.7) · D 54.8% · R 45.2%
- 2008→2024 swing
- -7.9pp toward R · 2008: 17.5pp · 2024: 9.7pp
- All cycles
- 2024: D+9.7 2020: D+14.7 2016: D+4.8 2012: D+15.6 2008: D+17.5
Not yet ingested
- Civics
- —
Market trends
- HPI YoY
- ▲ 79.80%
- Current HPI
- 471.6399
- Rent YoY
- —
- Metro
- —
- State GDP YoY
- ▲ 2.60%
- F500 in state
- 92
Industry mix (Fortune 500 HQ in NY)
| Industry | F500 HQs | Revenue |
|---|---|---|
| Financial Services | 10 | $950B |
|
||
| Consumer Goods | 9 | $162B |
|
||
| Insurance | 4 | $225B |
|
||
| Telecommunications | 2 | $144B |
|
||
| Pharmaceuticals | 2 | $112B |
|
||
| Media / Entertainment | 2 | $69B |
|
||
Price history
2 events — show timeline
- 2026-06-06 Pending — WNYREIS
- 2026-05-13 Listed $139,900 WNYREIS
Property tax history
+14.7%/yrLatest (2025): $525 · +175.6% YoY. Source: county tax records.
Cash-flow waterfall
monthlySold comps — $/sqft
last 12 mo · ≤1 miLoading sold comps…