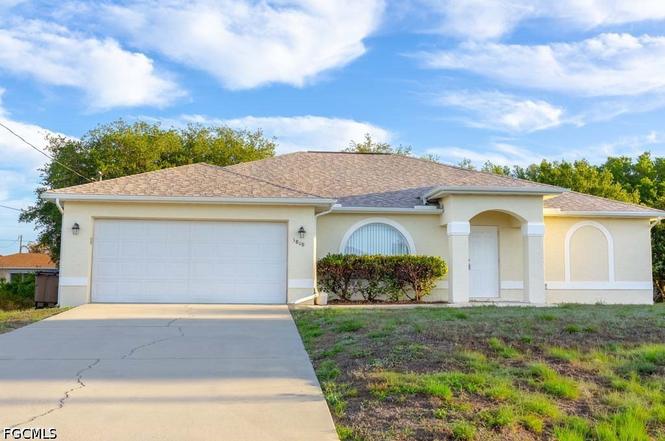
3808 27th St SW · Lehigh Acres, FL
Flood risk 1/10 · Minimal
- FEMA flood zone
- X (unshaded)
- Chance of flooding over 30 yrs
- 0.0%
- Est. flood insurance / yr
- $507 – $1,088
Fire risk 2/10 · Minimal
- Est. fire insurance / yr
- $947 – $1,759
Heat risk 10/10 · Severe
- Hot days now (above 107°F)
- 7 days/yr
- Hot days in 30 yrs
- 29 days/yr
Wind risk 10/10 · Severe
- Chance of severe wind over 30 yrs
- 99.0%
Air-quality risk 2/10 · Minimal
- Unhealthy air days now
- 1 days/yr
- Unhealthy air days in 30 yrs
- 1 days/yr
Risk factors via First Street. Map © Google.
Why this score? — see what drove the D+ grade
The composite is a weighted blend of 9 inputs, each scored 0–100. Each bar is that input's sub-score; the figure is the points it added to the 100-point composite (weight × sub-score).
- ARV discount +15.0/15.0
- Appreciation +10.0/10.0
- Cash flow +8.1/30.0
- Schools +4.1/10.0
- Livability +3.0/5.0
- Condition / age +2.5/5.0
- 1% rule +2.3/10.0
- DSCR +2.2/10.0
- Rent growth +2.1/5.0
$289,900
🖨 Deal sheet (PDF) 📄 Offer letter ✓ Due diligence
Listing remarks MLS
THIS IS NOT A SHORT SALE!! SELLER WANTS OFFERS!! This affordable 3 bedroom, 2 bath, 2 car garage yard with room for a pool, tile//carpet flooring, . It is centrally located close to schools, . Home is being sold AS-IS . .
Key facts
- 0.25 acre lot
- 2 garage spots
- Built 2006
Property features AI
Finance
- Financial info: Pets allowed
- HOA & community: Non-gated community; No association fee
Exterior
- Parking: Attached garage; Attached carport; Garage door opener; Total covered parking for 4 vehicles (2 garage spaces and 2 carport spaces)
- Utilities: Well water; Septic tank; Cable available
- Home design: Single-story home; Entry level: 1; Northeast facing; Resale property
- Construction: Block, concrete and stucco construction; Shingle roof
- Exterior features: No notable exterior features listed; Rectangular lot; Lot exposures to the southwest; Lot dimensions approximately 80 x 136 x 80 x 136; Irrigation from a well
Interior
- Kitchen: Dishwasher; Electric cooktop; Freezer; Microwave; Refrigerator
- Bedrooms: Bedrooms configuration listed as Other
- Bathrooms: 2 full bathrooms
- Heating & cooling: Central heating (electric); Central air conditioning (electric); Ceiling fans
- Interior features: Breakfast bar; Split bedrooms; Other interior features (see remarks)
Neighborhood map
What this means for you Summary
Snapshot
- This is a 3-bed/2.0-bath single-family listed at $290k.
Deal economics
- At list price, monthly cash flow is $-277 ($-3k/yr) — negative.
- To cash-flow at today's rent, offer at most $241k (16.9% below list).
- To meet the 1% rule (rent ≥ 1% of price), the offer needs to be $210k (27.4% below list).
- Recommended offer: $210k (27.4% below list) — sets the bar for 1% rule.
Location & tenants
- Location reads 59/100 on livability (#826 in FL) — a working-class tenant base; expect higher turnover. Strengths: cost of living A+, housing A+; Watch: crime C-, employment D+, amenities F.
- Lee (suburban): math 47% / reading 50% proficiency, ranked #42 of 73 in FL (top 58%) — families likely to look elsewhere, expect single-tenant / working-renter base with shorter leases.
- Zoned schools: Veterans Park Academy For The Arts (math 41% / reading 45%, grade F, #1,366 of 2,144 statewide, top 64%, 2,133 students, 36% FRL); Oak Hammock Middle School (math 43% / reading 41%, grade D-, #340 of 571 statewide, top 61%, 1,563 students, 56% FRL); Lehigh Senior High School (math 23% / reading 45%, grade F, #394 of 667 statewide, top 60%, 2,476 students, 57% FRL).
- Market conditions: Rents soft (-1.5%/yr); 788 active listings in the ZIP; 40 comparable units currently listed for rent nearby; rentals at typical pace (median 26d on market — plan ~3-4 weeks tenant-placement turnaround); 15,411 units permitted in Lee County in 2024 (4,686 in 5+ unit buildings).
- This rent runs 35% of the median local income ($73k/yr) — at the standard rent-burdened threshold; future hikes will face affordability resistance.
Forward outlook
- In year one you build about $31k of equity ($2k loan paydown + $29k appreciation (10.0% local appreciation)).
- Lee County population projected at +44% by 2050 — long-run rental-demand tailwind backs the buy-and-hold thesis.
- By year 2, paydown + projected appreciation supports a ~$50k cash-out refi (75% LTV) — recoverable capital for the next deal without selling this one.
Negotiation context
- It's been on market 366 days — a 12% lower offer ($255k) is reasonable based on typical stale-listing flexibility.
- Current owner paid $54k; list at $290k implies a 437% gain — meaningful room to come down on a strong offer.
Risks & watch-outs
- Climate carrying-cost: severe wind risk, 99% chance of damaging wind over 30y; extreme-heat days projected 7→29/yr by 2055 (HVAC capex compounding) — expect insurance premiums to compound above CPI over the hold.
Questions for the listing agent
- What do current leases actually rent for vs. the listed asking? Can we see a recent rent roll and the last 12 months of T-12 income?
- It's been on market 366 days. Have you received any prior offers? Is the seller open to a 27% concession, seller financing, or rate buy-down credit?
- Why hasn't it sold? Are there any deal-killer items the seller is aware of (foundation, flood, title, zoning, code violations)?
- Is there a deadline driving the sale (1031 exchange, divorce, estate, relocation)? That informs how much negotiation room exists.
- Schools are D-rated, which usually means shorter tenancies and higher turnover. Who's the typical renter profile here, and what's been the actual vacancy rate?
- The area grade is low — what's the realistic commute time and amenity access for the typical tenant pool here? Any planned neighborhood developments (good or bad) we should know about?
- What's the average days-on-market for RENTAL listings here right now (not sales)? A rising rental-DOM trend means longer vacancies and softer asking-rent achievability than the comps imply.
- What's the recent tenant-quality profile in this submarket — average credit score on applications, eviction rate, late-payment / NSF rate, and stable-employment percentage? A property-management company in the area should have these aggregated.
- How much new for-sale + rental construction is in the pipeline within 1–3 miles? Heavy new supply typically softens prices + rents 12–24 months out; constrained supply supports both.
Investment metrics
- 1% rule
- 0.73% ✗
- Cap rate
- 5.15%
- Cash-on-cash
- -4.10%
- DSCR
- 0.82
- GRM
- 11.5
CMA / ARV
- ARV (on-the-fly)
- $386,754
- Comps found
- 12
Show comp detail 12 sales within ~0.75 mi
| Address | Dist | Beds/Ba | Sqft | Sold | Price | $/sf | Match |
|---|---|---|---|---|---|---|---|
| 3915 27th St SW | 0.17mi | 3/2.0 | 1,640 (-7%) | 9mo | $374,900 | $229 | 73 |
| 3606 29th St SW | 0.34mi | 3/3.0 | 1,776 (+1%) | 13mo | $390,000 | $220 | 68 |
| 3506 28th St SW | 0.46mi | 4/2.0 (+1) | 1,824 (+3%) | 4mo | $289,097 | $158 | 64 |
| 3102 Wanda Ave S | 0.31mi | 4/3.0 (+1) | 1,922 (+9%) | 3mo | $419,999 | $219 | 59 |
| 2908 Denis Ave S | 0.44mi | 3/2.5 | 1,640 (-7%) | 14mo | $407,000 | $248 | 54 |
| 3704 33rd St SW | 0.41mi | 3/2.0 | 1,503 (-15%) | 3mo | $285,000 | $190 | 54 |
| 3604 37th St SW | 0.69mi | 3/2.0 | 1,698 (-4%) | 10mo | $380,000 | $224 | 53 |
| 4019 34th St SW | 0.58mi | 4/2.0 (+1) | 1,696 (-4%) | 12mo | $360,000 | $212 | 52 |
| 3103 Vilma Ave S | 0.37mi | 3/2.0 | 1,512 (-14%) | 10mo | $352,650 | $233 | 51 |
| 3601 36th St SW | 0.69mi | 3/2.5 | 1,643 (-7%) | 9mo | $355,000 | $216 | 47 |
| 3510 32nd St SW | 0.52mi | 3/2.0 | 1,521 (-14%) | 9mo | $280,000 | $184 | 45 |
| 3501 19th St SW | 0.74mi | 4/2.0 (+1) | 1,667 (-6%) | 14mo | $350,000 | $210 | 40 |
Match score weights: distance 35% · size 25% · config 20% · recency 20%. Top-matched comps best support the ARV.
Projected returns pro-forma
10.0% appreciation · 0.0% rent growth · sell at horizon
- IRR
- 20.5%
- Equity multiple
- 2.65×
- Total profit
- $134,063
- Equity at exit
- $261,165
- IRR
- 18.1%
- Equity multiple
- 5.90×
- Total profit
- $397,622
- Equity at exit
- $563,212
Cash invested: $81,172 (down + closing). Projections, not guarantees.
Landlord ↔ Tenant lean methodology
- Overall (STATE)
- 87 Strongly Landlord-Friendly
- State Florida
- 87 Strongly Landlord-Friendly · R+3
- County
- — inherits STATE
- City
- — inherits STATE
ZIP-level market 33976
- Home prices YoY
- 6.8%
- Rents YoY
- -1.5%
- Active inventory
- 788
- Price-to-rent
- 11.5×
Monthly cashflow live
- Estimated rent
- $2,103 high interval (Pro) →
- Mortgage (P&I)
- −$1,520
- Tax from tax record
- −$298 /mo · $3,572/yr
- Insurance
- −$121
- HOA
- −$0
- Vacancy / Maint / Mgmt
- −$442
- Net cashflow
- $-277
Break-even live
Sensitivity live
| Price | -10% $-113 | -5% $-195 | +0% $-277 | +5% $-359 | +10% $-441 |
|---|---|---|---|---|---|
| Rent | -10% $-443 | -5% $-360 | +0% $-277 | +5% $-194 | +10% $-111 |
| Rate | -1.0pp $-131 | -0.5pp $-203 | base $-277 | +0.5pp $-352 | +1.0pp $-429 |
UW: 25.0% down · 7.5% · 30yr · 1.5% tax · 5.0% vac · 8.0% maint · 8.0% mgmt
Financing live
Cash to close
- Down payment
- $72,475
- Closing costs
- $8,697
- Reserves months
- —
- Total cash needed
- —
Loan-product check · same deal, 3 products live
Conventional
25% down · 7.5% · 30yr
- Down + closing
- —
- Monthly P&I
- —
- Monthly cashflow
- —
- DSCR
- —
- Eligible?
- —
Personal DTI + credit; lowest rate.
DSCR
20% down · 8.5% · 30yr
- Down + closing
- —
- Monthly P&I
- —
- Monthly cashflow
- —
- DSCR
- —
- Eligible?
- —
No personal income docs; deal must DSCR.
Hard money
10% down · 12.0% · 12mo
- Down + closing
- —
- Monthly P&I
- —
- Monthly cashflow
- —
- DSCR
- —
- Eligible?
- —
Short-term bridge; refi at stabilization.
Rent comps 40 comps
| Address | Beds | Baths | Sqft | Rent | $/sqft | DOM | Units | Dist |
|---|---|---|---|---|---|---|---|---|
| 2904 Wanda Ave S Lehigh Acres, FL | 3.0 | 2.0 | 1501 | $1,900 | $1.27 | 25d | 1 | 0.23mi |
| 2504 Vera Ave S Lehigh Acres, FL | 3.0 | 3.0 | 1643 | $2,400 | $1.46 | 25d | 1 | 0.27mi |
| 3604 29th St SW Lehigh Acres, FL | 3.0 | 2.5 | 1776 | $2,500 | $1.41 | 25d | 1 | 0.34mi |
| 3809 33rd St SW Lehigh Acres, FL | 4.0 | 2.0 | 2133 | $1,745 | $0.82 | 25d | 1 | 0.37mi |
| 3807 33rd St SW Lehigh Acres, FL | 4.0 | 2.0 | 2133 | $1,745 | $0.82 | 25d | 1 | 0.37mi |
| 3805 33rd St SW Lehigh Acres, FL | 4.0 | 2.0 | 2133 | $1,745 | $0.82 | 25d | 1 | 0.37mi |
| 3803 33rd St SW Lehigh Acres, FL | 4.0 | 2.0 | 2133 | $1,745 | $0.82 | 25d | 1 | 0.38mi |
| 3801 33rd St SW Lehigh Acres, FL | 4.0 | 2.0 | 2133 | $1,745 | $0.82 | 25d | 1 | 0.38mi |
| 4021 28th St SW Lehigh Acres, FL | 3.0 | 2.0 | 1529 | $1,800 | $1.18 | 25d | 1 | 0.38mi |
| 3802 35th St SW Lehigh Acres, FL | 3.0 | 2.0 | 1269 | $1,640 | $1.29 | 25d | 1 | 0.47mi |
| 3418 26th St SW Lehigh Acres, FL | 4.0 | 3.0 | 2030 | $2,300 | $1.13 | 18d | 1 | 0.52mi |
| 4101 33rd St SW Lehigh Acres, FL | 3.0 | 2.0 | 1698 | $2,200 | $1.30 | 16d | 1 | 0.58mi |
| 3714 17th St SW Lehigh Acres, FL | 4.0 | 2.0 | 1833 | $1,890 | $1.03 | 25d | 1 | 0.63mi |
| 4203 23rd St SW Lehigh Acres, FL | 4.0 | 2.0 | 1833 | $1,850 | $1.01 | 21d | 1 | 0.64mi |
| 4020 36th St SW Lehigh Acres, FL | 3.0 | 2.0 | 1354 | $2,050 | $1.51 | 25d | 1 | 0.67mi |
| 3419 36th St Lehigh Acres, FL | 4.0 | 2.0 | 1920 | $1,850 | $0.96 | 25d | 1 | 0.77mi |
| 1511 Terry Ave S Lehigh Acres, FL | 3.0 | 2.0 | 1579 | $1,996 | $1.26 | 25d | 1 | 0.83mi |
| 3316 35th St SW Lehigh Acres, FL | 4.0 | 2.0 | 2133 | $1,745 | $0.82 | 25d | 1 | 0.84mi |
| 3314 35th St SW Lehigh Acres, FL | 4.0 | 2.0 | 2133 | $1,745 | $0.82 | 25d | 1 | 0.85mi |
| 3312 35th St SW Lehigh Acres, FL | 4.0 | 2.0 | 2133 | $1,745 | $0.82 | 25d | 1 | 0.87mi |
| 3702 14th St SW Lehigh Acres, FL | 4.0 | 2.0 | 1472 | $1,995 | $1.36 | 25d | 1 | 0.89mi |
| 4221 18th St SW Lehigh Acres, FL | 3.0 | 2.5 | 1600 | $2,600 | $1.62 | 16d | 1 | 0.91mi |
| 3313 36th St SW Lehigh Acres, FL | 3.0 | 2.0 | 1723 | $2,300 | $1.33 | 25d | 1 | 0.92mi |
| 3203 24th St SW Lehigh Acres, FL | 3.0 | 2.0 | 1498 | $2,300 | $1.54 | 23d | 1 | 0.97mi |
| 3201 28th St Lehigh Acres, FL | 4.0 | 2.0 | 1389 | $2,000 | $1.44 | 5d | 1 | 0.98mi |
| 3201 29th St SW Lehigh Acres, FL | 4.0 | 2.0 | 1833 | $1,950 | $1.06 | 5d | 1 | 0.99mi |
| 3201 23rd St SW Lehigh Acres, FL | 3.0 | 2.0 | 1324 | $1,845 | $1.39 | 23d | 1 | 1.00mi |
| 1578 Gretchen Ave S Lehigh Acres, FL | 3.0 | 2.0 | 1728 | $2,000 | $1.16 | 25d | 1 | 1.02mi |
| 4421 25th St SW Lehigh Acres, FL | 3.0 | 2.0 | 1253 | $1,250 | $1.00 | 12d | 1 | 1.05mi |
| 3209 21st St SW Lehigh Acres, FL | 3.0 | 2.0 | 1418 | $1,699 | $1.20 | 5d | 1 | 1.06mi |
| 3705 9th St SW Lehigh Acres, FL | 3.0 | 2.0 | 1272 | $1,695 | $1.33 | 16d | 1 | 1.16mi |
| 4449 26th St SW Lehigh Acres, FL | 3.0 | 2.0 | 2242 | $1,900 | $0.85 | 25d | 1 | 1.19mi |
| 1502 Gretchen Ave S Lehigh Acres, FL | 3.0 | 2.0 | 1270 | $2,000 | $1.57 | 5d | 1 | 1.21mi |
| 1507 Paula Ave S Lehigh Acres, FL | 3.0 | 2.0 | 1547 | $2,000 | $1.29 | 21d | 1 | 1.24mi |
| 3408 10th St SW Lehigh Acres, FL | 4.0 | 2.0 | 1920 | $1,750 | $0.91 | 16d | 1 | 1.25mi |
| 3408 10th St SW Lehigh Acres, FL | 4.0 | 2.0 | 1385 | $1,850 | $1.34 | 23d | 1 | 1.25mi |
| 3303 8th St SW Lehigh Acres, FL | 3.0 | 2.0 | 1400 | $2,250 | $1.61 | 5d | 1 | 1.29mi |
| 3114 39th St SW Lehigh Acres, FL | 3.0 | 2.0 | 1493 | $2,100 | $1.41 | 18d | 1 | 1.30mi |
| 3114 39th St SW Lehigh Acres, FL | 3.0 | 2.0 | 1493 | $2,100 | $1.41 | 5d | 1 | 1.30mi |
| 4501 15th St SW Unit 4501 Lehigh Acres, FL | 3.0 | 2.0 | 2383 | $1,800 | $0.76 | 25d | 1 | 1.30mi |
Listing history 16 events
-
2026-06-22days on market $289,900 Active 366 DOM
-
2026-06-17days on market $289,900 Active 362 DOM
-
2026-06-16days on market $289,900 Active 361 DOM
-
2026-06-16days on market $289,900 Active 360 DOM
-
2026-06-13days on market $289,900 Active 358 DOM
-
2026-06-09days on market $289,900 Active 354 DOM
-
2026-06-07days on market $289,900 Active 352 DOM
-
2026-06-02days on market $289,900 Active 347 DOM
-
2026-06-01days on market $289,900 Active 346 DOM
-
2026-06-01days on market $289,900 Active 345 DOM
-
2026-04-19price $289,900
-
2025-07-25price $299,900
-
2025-06-20$329,000 Active
-
2010-02-16soldstatus $54,000 221-char remark
Show marketing remark (221 chars)
THIS IS NOT A SHORT SALE!! SELLER WANTS OFFERS!! This affordable 3 bedroom, 2 bath, 2 car garage yard with room for a pool, tile//carpet flooring, . It is centrally located close to schools, . Home is being sold AS-IS . .
-
2010-02-16soldstatus $54,000
Show marketing remark (221 chars)
THIS IS NOT A SHORT SALE!! SELLER WANTS OFFERS!! This affordable 3 bedroom, 2 bath, 2 car garage yard with room for a pool, tile//carpet flooring, . It is centrally located close to schools, . Home is being sold AS-IS . .
-
2010-01-29price $57,420 221-char remark
Show marketing remark (221 chars)
THIS IS NOT A SHORT SALE!! SELLER WANTS OFFERS!! This affordable 3 bedroom, 2 bath, 2 car garage yard with room for a pool, tile//carpet flooring, . It is centrally located close to schools, . Home is being sold AS-IS . .
ⓘ Source: listings_history table (triggers on properties + properties_extension) + one-shot
backfill from property_details.listing_events for pre-trigger history.
Tax reassessment forecast FL · Resets to sale price
- Current annual tax
- $3,572 · $298/mo
- Projected year-2 tax
- $3,572 · $298/mo
- Expected delta
- $0/yr ($0/mo · 0.0%)
ⓘ Screening estimate from a state-policy table — verify with the county assessor before closing.
Climate risk First Street
- Flood 1/10 Low FEMA zone X (unshaded) · 0% chance over 30 yrs
- Wildfire 2/10 Low
- Heat 10/10 Extreme 7 d/yr ≥107°F today · 29 d/yr by 30 yrs out
- Wind 10/10 Extreme 99% chance of damaging wind over 30 yrs
- Air quality 2/10 Low 1 unhealthy d/yr today · 1 by 30 yrs out
Nearby sold comps map
Loading sold comps map…
Walkable amenities ~0.75 mi
Loading nearby amenities…
Taxation est. · year 1
- Rental income
- $25,239
- − Mortgage interest
- −$16,239
- − Property taxes
- −$3,572
- − Insurance
- −$1,450
- − Repairs & maintenance
- −$2,019
- − Management
- −$2,019
- − Depreciation
- −$8,433
- Taxable loss
- −$8,493
- Est. tax savings @ 24.0%
- +$2,038
- After-tax cash flow
- $-1,288/yr
For passive investors: Depreciation is non-cash, so a rental often shows a tax loss while cash-flowing — sheltering income. Rental losses are passive: they offset passive income freely, and up to $25,000/yr can offset ordinary (W-2) income if you actively participate and your MAGI is under $100k (phasing out to $0 by $150k); unused losses carry forward. On sale, claimed depreciation is recaptured at up to 25%, and gains may owe capital-gains tax (a 1031 exchange can defer both). Figures are a year-1 estimate at your 24.0% rate — not tax advice; consult a CPA.
Schools (NCES district)
- District
- Lee
- NCES district ID
- 1201080
- Math proficiency
- 47% ▼ -11.00%
- Reading proficiency
- 50% ▼ -4.00%
- Median HH income
- $49,518
- Composite
- 41.49/100
- National rank
- #3458
- State rank
- #42 of 73 in FL
Livability — Lehigh Acres
- Score
- 59/100
- State rank
- #826
- US rank
- #20055
Category grades
Schools grade is shown separately in the Schools card above.
Census & demographics
- Census place
- Lehigh Acres, FL
- County
- Lee County · 788,662 people
- City population
- 130,638
- Metro
- Cape Coral-Fort Myers, FL
- Population (ZIP)
- 20,277
- Household income
- $72,679
- Rent vs Own
- Severe rent burden
- 574.0
Population outlook (Lee County) Hauer SSP2
- Today (2025)
- 871,946 people
- By 2030
- 955,468 · +9.6%
- By 2040
- 1,113,587 · +27.7%
- By 2050
- 1,256,891 · +44.1%
- By 2075
- 1,560,270 · +78.9%
- By 2100
- 1,726,848 · +98.0%
Race, ethnicity, and origin ACS 2023
- Neighborhood character
- Diverse neighborhood (Simpson 0.65)
- Race & ethnicity
- Hispanic / Latino 50% Two or more races 30% White 24% Black 20% Asian 3%
- Hispanic origin (detail)
- Mexican 8% Puerto Rican 8% Cuban 18% Dominican 4%
- Common ancestry
- Hispanic 8% Slovak 1% Lithuanian 1%
- Foreign-born
- 35% · Canada, Jamaica, Vietnam
- Languages at home
- 46% English-only · Spanish 43% French/Haitian/Cajun 8% Vietnamese 1%
Political lean MEDSL · Lee
- 2024 margin
- Strong R (+28.4) · D 35.5% · R 63.9%
- 2008→2024 swing
- -18.0pp toward R · 2008: -10.4pp · 2024: -28.4pp
- All cycles
- 2024: R+28.4 2020: R+19.2 2016: R+20.4 2012: R+16.6 2008: R+10.4
Not yet ingested
- Civics
- —
Market trends
- HPI YoY
- ▲ 21.77%
- Current HPI
- 340.4255
- Rent YoY
- ▼ -1.54%
- Metro
- Cape Coral-Fort Myers, FL
- State GDP YoY
- ▲ 3.28%
- F500 in state
- 36
Industry mix (Fortune 500 HQ in FL)
| Industry | F500 HQs | Revenue |
|---|---|---|
| Industrial Technology | 2 | $29B |
|
||
| Insurance | 2 | $17B |
|
||
| Retail | 1 | $60B |
|
||
| Technology Distribution | 1 | $58B |
|
||
| Homebuilding | 1 | $35B |
|
||
| Technology Manufacturing | 1 | $35B |
|
||
Price history
+404.9% since first listed6 events — show timeline
- 2026-04-19 Price Changed $289,900 FORTMLS
- 2025-07-25 Price Changed $299,900 FORTMLS
- 2025-06-20 Listed $329,000 FORTMLS
- 2010-02-16 Sold (Public Records) $54,000 Public Records
- 2010-02-16 Sold (MLS) $54,000 FORTMLS
- 2010-01-29 Price Changed $57,420 FORTMLS
Property tax history
+7.6%/yrLatest (2025): $3,572 · +3.0% YoY. Source: county tax records.
Cash-flow waterfall
monthlySold comps — $/sqft
last 12 mo · ≤1 miLoading sold comps…