540 Sonoma Isles Cir · Jupiter, FL
Flood risk No data
- FEMA flood zone
- —
- Chance of flooding over 30 yrs
- %
- Est. flood insurance / yr
- —
Fire risk No data
- Est. fire insurance / yr
- —
Heat risk No data
- Hot days now (above °F)
- days/yr
- Hot days in 30 yrs
- days/yr
Wind risk No data
- Chance of severe wind over 30 yrs
- %
Air-quality risk No data
- Unhealthy air days now
- days/yr
- Unhealthy air days in 30 yrs
- days/yr
Risk factors via First Street. Map © Google.
Why this score? — see what drove the D grade
The composite is a weighted blend of 9 inputs, each scored 0–100. Each bar is that input's sub-score; the figure is the points it added to the 100-point composite (weight × sub-score).
- Cash flow +13.4/30.0
- ARV discount +7.5/15.0
- Schools +4.3/10.0
- 1% rule +4.1/10.0
- DSCR +4.0/10.0
- Livability +3.5/5.0
- Rent growth +2.5/5.0
- Condition / age +2.5/5.0
- Appreciation +0.0/10.0
$2,499,000
🖨 Deal sheet (PDF) 📄 Offer letter ✓ Due diligence
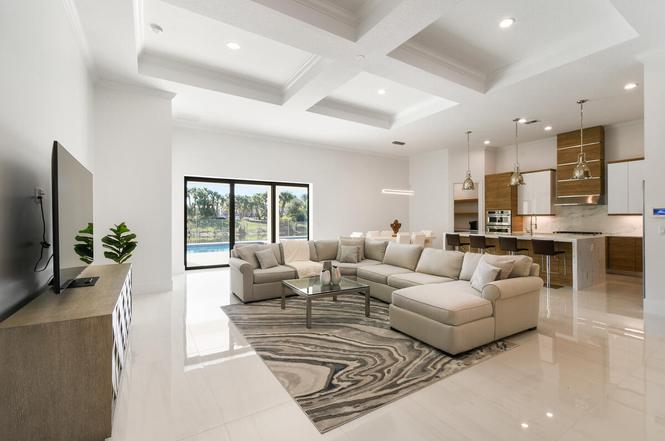
Listing remarks
This totally renovated inside and out 4-BR, 4.5-BA custom designer pool home on one of the largest waterfront lots perfectly situated directly across from the clubhouse and all its amenities. Thoughtfully crafted with unmatched attention to detail, craftsmanship and high end finishes, this home also features a modern chef's kitchen with custom walnut cabinetry, a waterfall island, dolomite 6cm tops and a butler's pantry and wine fridge. Large format high gloss dolomite flooring, and much more! The luxurious primary suite features real long plank white oak floors, a spa-like bath with a freestanding tub and oversized walk-in shower, and a large walk-in custom closet. Don't miss this maste
Key facts
- 0.33 acre lot
- 3 garage spots
- Pool
Neighborhood map
What this means for you Summary
Snapshot
- This is a 4-bed/4.5-bath single-family listed at $2.50M.
Deal economics
- At list price, monthly cash flow is $34 ($403/yr) — positive.
- The deal already cash-flows at list — no discount required.
- To meet the 1% rule (rent ≥ 1% of price), the offer needs to be $2.27M (9.4% below list).
- Recommended offer: $2.20M (12.0% below list) — sets the bar for market timing.
- Cap rate 6.3% vs local median 2.7% in Jupiter — top-decile yield for the area; either an underpriced asset or a hidden risk that comps aren't pricing in. Stress-test before assuming the spread holds.
Location & tenants
- Location reads 70/100 on livability (#415 in FL) — a middle-class / working-renter tenant base. Strengths: crime A+, employment A+, housing A+; Watch: amenities F, commute F, cost of living F.
- Palm Beach (suburban): math 46% / reading 53% proficiency, ranked #34 of 73 in FL (top 47%) — families likely to look elsewhere, expect single-tenant / working-renter base with shorter leases.
- Market conditions: 125 active listings in the ZIP; 6 comparable units currently listed for rent nearby; rentals at typical pace (median 26d on market — plan ~3-4 weeks tenant-placement turnaround); 3,974 units permitted in Palm Beach County in 2024 (1,012 in 5+ unit buildings).
Forward outlook
- Local home prices are declining (-3.0%/yr); year-one equity from $17k of loan paydown is wiped out by about $75k of value loss. Plan a longer hold.
- Palm Beach County population projected at +30% by 2050 — long-run rental-demand tailwind backs the buy-and-hold thesis.
Negotiation context
- It's been on market 336 days — a 12% lower offer ($2.20M) is reasonable based on typical stale-listing flexibility.
Questions for the listing agent
- It's been on market 336 days. Have you received any prior offers? Is the seller open to a 12% concession, seller financing, or rate buy-down credit?
- What does the HOA fee cover, when was the last increase, and are there any pending special assessments or reserve-fund shortfalls?
- Why hasn't it sold? Are there any deal-killer items the seller is aware of (foundation, flood, title, zoning, code violations)?
- Is there a deadline driving the sale (1031 exchange, divorce, estate, relocation)? That informs how much negotiation room exists.
- Schools are A-rated — typically a magnet for longer-tenancy family renters. What's the average tenant stay here, and is there a school-zone premium baked into asking?
- The area grade is low — what's the realistic commute time and amenity access for the typical tenant pool here? Any planned neighborhood developments (good or bad) we should know about?
- What's the average days-on-market for RENTAL listings here right now (not sales)? A rising rental-DOM trend means longer vacancies and softer asking-rent achievability than the comps imply.
- What's the recent tenant-quality profile in this submarket — average credit score on applications, eviction rate, late-payment / NSF rate, and stable-employment percentage? A property-management company in the area should have these aggregated.
- How much new for-sale + rental construction is in the pipeline within 1–3 miles? Heavy new supply typically softens prices + rents 12–24 months out; constrained supply supports both.
Investment metrics
- 1% rule
- 0.91% ✗
- Cap rate
- 6.31%
- Cash-on-cash
- 0.06%
- DSCR
- 1.00
- GRM
- 9.2
CMA / ARV
No comps found within radius.
Projected returns pro-forma
-3.0% appreciation · 3.0% rent growth · sell at horizon
- IRR
- -16.2%
- Equity multiple
- 0.43×
- Total profit
- $-402,100
- Equity at exit
- $372,609
- IRR
- -7.8%
- Equity multiple
- 0.51×
- Total profit
- $-344,522
- Equity at exit
- $216,068
Cash invested: $699,720 (down + closing). Projections, not guarantees.
Landlord ↔ Tenant lean methodology
- Overall (STATE)
- 87 Strongly Landlord-Friendly
- State Florida
- 87 Strongly Landlord-Friendly · R+3
- County
- — inherits STATE
- City
- — inherits STATE
ZIP-level market 33478
- Active inventory
- 125
- Price-to-rent
- 9.2×
Monthly cashflow live
- Estimated rent
- $22,651 high interval (Pro) →
- Mortgage (P&I)
- −$13,105
- Tax est. 1.5%
- −$3,124 /mo · $37,485/yr
- Insurance
- −$1,041
- HOA
- −$591
- Vacancy / Maint / Mgmt
- −$4,757
- Net cashflow
- $34
Break-even live
Sensitivity live
| Price | -10% $1,761 | -5% $897 | +0% $34 | +5% $-830 | +10% $-1,693 |
|---|---|---|---|---|---|
| Rent | -10% $-1,756 | -5% $-861 | +0% $34 | +5% $928 | +10% $1,823 |
| Rate | -1.0pp $1,292 | -0.5pp $669 | base $34 | +0.5pp $-614 | +1.0pp $-1,273 |
UW: 25.0% down · 7.5% · 30yr · 1.5% tax · 5.0% vac · 8.0% maint · 8.0% mgmt
Financing live
Cash to close
- Down payment
- $624,750
- Closing costs
- $74,970
- Reserves months
- —
- Total cash needed
- —
Loan-product check · same deal, 3 products live
Conventional
25% down · 7.5% · 30yr
- Down + closing
- —
- Monthly P&I
- —
- Monthly cashflow
- —
- DSCR
- —
- Eligible?
- —
Personal DTI + credit; lowest rate.
DSCR
20% down · 8.5% · 30yr
- Down + closing
- —
- Monthly P&I
- —
- Monthly cashflow
- —
- DSCR
- —
- Eligible?
- —
No personal income docs; deal must DSCR.
Hard money
10% down · 12.0% · 12mo
- Down + closing
- —
- Monthly P&I
- —
- Monthly cashflow
- —
- DSCR
- —
- Eligible?
- —
Short-term bridge; refi at stabilization.
Rent comps 6 comps
| Address | Beds | Baths | Sqft | Rent | $/sqft | DOM | Units | Dist |
|---|---|---|---|---|---|---|---|---|
| 141 Cinder Dunes Pt Jupiter, FL | 4.0 | 4.0 | 3856 | $20,000 | $5.19 | 26d | 1 | 0.31mi |
| 182 Rosalia Ct Jupiter, FL | 4.0 | 4.5 | 4000 | $25,000 | $6.25 | 26d | 1 | 0.62mi |
| 131 Carmela Ct Jupiter, FL | 5.0 | 5.5 | 4463 | $22,000 | $4.93 | 22d | 1 | 0.75mi |
| 179 Carmela Ct Jupiter, FL | 3.0 | 4.5 | 3930 | $30,000 | $7.63 | 20d | 1 | 0.77mi |
| 183 Rudder Cay Way Jupiter, FL | 5.0 | 3.0 | 2972 | $6,000 | $2.02 | 6d | 1 | 0.90mi |
| 18363 Island Oak Ave Jupiter, FL | 5.0 | 4.0 | 3833 | $18,000 | $4.70 | 26d | 1 | 1.08mi |
HOA detail
- Monthly dues
- $591 · $7,092/yr
- Likely covers
- waterpool
Listing history 2 events
-
2026-06-17remarks 699-char remark
-
2026-06-17$2,499,000 Pending 336 DOM
ⓘ Source: listings_history table (triggers on properties + properties_extension) + one-shot
backfill from property_details.listing_events for pre-trigger history.
Nearby sold comps map
Loading sold comps map…
Walkable amenities ~0.75 mi
Loading nearby amenities…
Taxation est. · year 1
- Rental income
- $271,817
- − Mortgage interest
- −$139,983
- − Property taxes
- −$37,485
- − Insurance
- −$12,495
- − Repairs & maintenance
- −$21,745
- − Management
- −$21,745
- − HOA
- −$7,092
- − Depreciation
- −$72,698
- Taxable loss
- −$41,427
- Est. tax savings @ 24.0%
- +$9,942
- After-tax cash flow
- $10,346/yr
For passive investors: Depreciation is non-cash, so a rental often shows a tax loss while cash-flowing — sheltering income. Rental losses are passive: they offset passive income freely, and up to $25,000/yr can offset ordinary (W-2) income if you actively participate and your MAGI is under $100k (phasing out to $0 by $150k); unused losses carry forward. On sale, claimed depreciation is recaptured at up to 25%, and gains may owe capital-gains tax (a 1031 exchange can defer both). Figures are a year-1 estimate at your 24.0% rate — not tax advice; consult a CPA.
Schools (NCES district)
- District
- Palm Beach
- NCES district ID
- 1201500
- Math proficiency
- 46% ▼ -16.00%
- Reading proficiency
- 53% ▼ -4.00%
- Median HH income
- $53,943
- Composite
- 42.72/100
- National rank
- #3160
- State rank
- #34 of 73 in FL
Livability — Jupiter
- Score
- 70/100
- State rank
- #415
- US rank
- #7386
Category grades
Schools grade is shown separately in the Schools card above.
Census & demographics
- Census place
- Jupiter, FL
- City population
- 68,420
- Population (ZIP)
- 15,205
Population outlook (Palm Beach County) Hauer SSP2
- Today (2025)
- 1,637,487 people
- By 2030
- 1,743,255 · +6.5%
- By 2040
- 1,948,712 · +19.0%
- By 2050
- 2,132,979 · +30.3%
- By 2075
- 2,530,027 · +54.5%
- By 2100
- 2,706,979 · +65.3%
Race, ethnicity, and origin ACS 2023
- Neighborhood character
- Predominantly White (80%)
- Race & ethnicity
- White 80% Two or more races 14% Hispanic / Latino 8% Asian 3%
- Hispanic origin (detail)
- Puerto Rican 1% Cuban 1%
- Common ancestry
- Slovak 4% Romanian 4% Italian 3%
- Foreign-born
- 10% · Canada, China, Vietnam
- Languages at home
- 86% English-only · Spanish 5% Other Indo-European 4% Russian/Polish/Slavic 1%
Political lean MEDSL · Palm Beach
- 2024 margin
- Toss-up / Even · D 50.0% · R 49.2%
- 2008→2024 swing
- -22.1pp toward R · 2008: 22.9pp · 2024: 0.8pp
- All cycles
- 2024: D+0.8 2020: D+12.8 2016: D+15.3 2012: D+17.0 2008: D+22.9
Not yet ingested
- Civics
- —
Market trends
- HPI YoY
- ▼ -306.11%
- Current HPI
- 427.5178
- Rent YoY
- —
- Metro
- —
- State GDP YoY
- ▲ 3.28%
- F500 in state
- 36
Industry mix (Fortune 500 HQ in FL)
| Industry | F500 HQs | Revenue |
|---|---|---|
| Industrial Technology | 2 | $29B |
|
||
| Insurance | 2 | $17B |
|
||
| Retail | 1 | $60B |
|
||
| Technology Distribution | 1 | $58B |
|
||
| Homebuilding | 1 | $35B |
|
||
| Technology Manufacturing | 1 | $35B |
|
||
Cash-flow waterfall
monthlySold comps — $/sqft
last 12 mo · ≤1 miLoading sold comps…