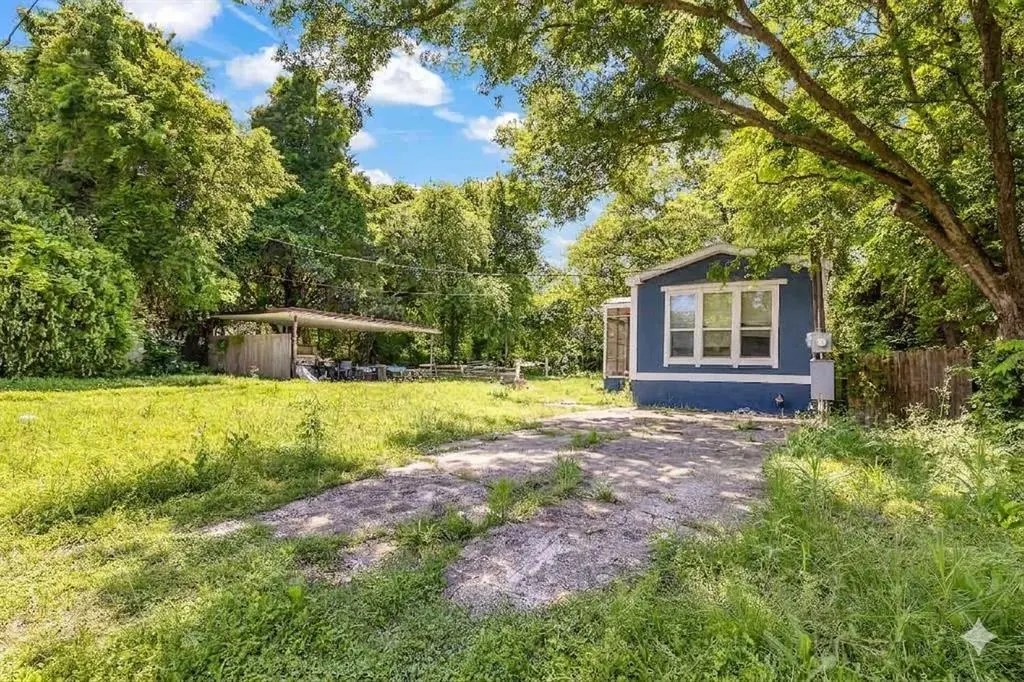
120 Huling Dr · Azle, TX
Flood risk 1/10 · Minimal
- FEMA flood zone
- X (unshaded)
- Chance of flooding over 30 yrs
- 0.0%
- Est. flood insurance / yr
- $507 – $1,088
Fire risk 5/10 · Moderate
- Est. fire insurance / yr
- $1,222 – $2,270
Heat risk 7/10 · Major
- Hot days now (above 109°F)
- 7 days/yr
- Hot days in 30 yrs
- 23 days/yr
Wind risk 6/10 · Moderate
- Chance of severe wind over 30 yrs
- 27.0%
Air-quality risk 2/10 · Minimal
- Unhealthy air days now
- 1 days/yr
- Unhealthy air days in 30 yrs
- 1 days/yr
Risk factors via First Street. Map © Google.
Why this score? — see what drove the D- grade
The composite is a weighted blend of 9 inputs, each scored 0–100. Each bar is that input's sub-score; the figure is the points it added to the 100-point composite (weight × sub-score).
- Cash flow +12.6/30.0
- ARV discount +7.5/15.0
- DSCR +3.8/10.0
- Schools +3.6/10.0
- Livability +3.6/5.0
- 1% rule +3.3/10.0
- Rent growth +3.1/5.0
- Condition / age +2.5/5.0
- Appreciation +0.0/10.0
$160,000
🖨 Deal sheet (PDF) 📄 Offer letter ✓ Due diligence
Listing remarks MLS
Almost a half acre lot with beautiful mature oak trees. 3 bedroom, 2 bath singlewide. Well and septic. Carport. Mobile needs some work. In sought after Silver Creek Elementary school zone. Close to Main Street with shopping, park, and library. Will only go cash or conventional. HVAC was replaced in 2008.
Key facts
- Mature oak trees
- Spacious lot
- Functional layout
Tags
Property features AI
Finance
- Financial info: No second mortgage reported; Listed For Sale
- HOA & community: No homeowners association
Exterior
- Parking: Carport (1 carport space)
- Utilities: Well water; Not in a municipal utility district
- Home design: Manufactured home; Residential property; Single-story
- Construction: Built in 2008
- Exterior features: Lot less than 0.5 acre (approximately 0.466 acres); Subdivision: M G Huling; Directions available
Interior
- Kitchen: No appliances included
- Bedrooms: 3 bedrooms (primary bedroom on main level)
- Bathrooms: 2 full bathrooms
- Interior features: One level; One living area; One dining area; Other interior features
- Laundry & utility: No specific laundry appliances listed
Neighborhood map
What this means for you Summary
Snapshot
- This is a 3-bed/2.0-bath manufactured listed at $160k.
Deal economics
- At list price, monthly cash flow is $-21 ($-248/yr) — negative.
- To cash-flow at today's rent, offer at most $156k (2.3% below list).
- To meet the 1% rule (rent ≥ 1% of price), the offer needs to be $132k (17.4% below list).
- Recommended offer: $132k (17.4% below list) — sets the bar for 1% rule.
- Cap rate 6.1% vs local median 3.1% in Azle — top-decile yield for the area; either an underpriced asset or a hidden risk that comps aren't pricing in. Stress-test before assuming the spread holds.
Location & tenants
- Location reads 72/100 on livability (#267 in TX) — a middle-class / working-renter tenant base. Strengths: cost of living A+, housing A+, employment A; Watch: health & safety D+, amenities F, commute F.
- Azle ISD (suburban): math 37% / reading 43% proficiency, ranked #351 of 826 in TX (top 42%) — families likely to look elsewhere, expect single-tenant / working-renter base with shorter leases.
- Zoned schools: Silver Creek El (math 37% / reading 42%, grade F, #1,545 of 4,322 statewide, top 38%, 509 students, 42% FRL); Azle J H South (math 31% / reading 41%, grade F, #805 of 1,662 statewide, top 50%, 584 students, 43% FRL); Azle H S (math 41% / reading 50%, grade D-, #634 of 1,632 statewide, top 39%, 2,054 students, 44% FRL) — zoned schools at 43% FRL track the district average.
- Market conditions: Rents rising (+2.3%/yr); 597 active listings in the ZIP; 9 comparable units currently listed for rent nearby; rentals at typical pace (median 21d on market — plan ~3-4 weeks tenant-placement turnaround); solid renter incomes; 437 units permitted in Parker County in 2024 (0 in 5+ unit buildings).
Forward outlook
- Local home prices are declining (-3.0%/yr); year-one equity from $1k of loan paydown is wiped out by about $5k of value loss. Plan a longer hold.
- Parker County population projected at +32% by 2050 — long-run rental-demand tailwind backs the buy-and-hold thesis.
Negotiation context
- It's been on market 52 days — a 3% lower offer ($155k) is reasonable based on typical stale-listing flexibility.
- 2 sale attempts since 5y ago with the ask held roughly flat each time — persistent listings suggest the price (not the market) is what's stuck; bring a comps-based counter.
Risks & watch-outs
- Climate carrying-cost: major wind risk, 27% chance of damaging wind over 30y; moderate wildfire risk; extreme-heat days projected 7→23/yr by 2055 (HVAC capex compounding) — expect insurance premiums to compound above CPI over the hold.
Questions for the listing agent
- What do current leases actually rent for vs. the listed asking? Can we see a recent rent roll and the last 12 months of T-12 income?
- It's been on market 52 days. Have you received any prior offers? Is the seller open to a 17% concession, seller financing, or rate buy-down credit?
- Is there a deadline driving the sale (1031 exchange, divorce, estate, relocation)? That informs how much negotiation room exists.
- The area grade is low — what's the realistic commute time and amenity access for the typical tenant pool here? Any planned neighborhood developments (good or bad) we should know about?
- What's the average days-on-market for RENTAL listings here right now (not sales)? A rising rental-DOM trend means longer vacancies and softer asking-rent achievability than the comps imply.
- What's the recent tenant-quality profile in this submarket — average credit score on applications, eviction rate, late-payment / NSF rate, and stable-employment percentage? A property-management company in the area should have these aggregated.
- How much new for-sale + rental construction is in the pipeline within 1–3 miles? Heavy new supply typically softens prices + rents 12–24 months out; constrained supply supports both.
Investment metrics
- 1% rule
- 0.83% ✗
- Cap rate
- 6.14%
- Cash-on-cash
- -0.55%
- DSCR
- 0.98
- GRM
- 10.1
CMA / ARV
No comps found within radius.
Projected returns pro-forma
-3.0% appreciation · 2.31% rent growth · sell at horizon
- IRR
- -18.0%
- Equity multiple
- 0.37×
- Total profit
- $-28,162
- Equity at exit
- $23,857
- IRR
- -11.5%
- Equity multiple
- 0.33×
- Total profit
- $-29,931
- Equity at exit
- $13,834
Cash invested: $44,800 (down + closing). Projections, not guarantees.
Landlord ↔ Tenant lean methodology
- Overall (STATE)
- 87 Strongly Landlord-Friendly
- State Texas
- 87 Strongly Landlord-Friendly · R+5
- County
- — inherits STATE
- City
- — inherits STATE
ZIP-level market 76020
- Home prices YoY
- -20.6%
- Rents YoY
- 2.3%
- Active inventory
- 597
- Price-to-rent
- 10.1×
Monthly cashflow live
- Estimated rent
- $1,322 high interval (Pro) →
- Mortgage (P&I)
- −$839
- Tax from tax record
- −$160 /mo · $1,915/yr
- Insurance
- −$67
- HOA
- −$0
- Lot rent leased land?
- −$0
- Vacancy / Maint / Mgmt
- −$278
- Net cashflow
- $-21
Break-even live
Sensitivity live
| Price | -10% $70 | -5% $25 | +0% $-21 | +5% $-66 | +10% $-111 |
|---|---|---|---|---|---|
| Rent | -10% $-125 | -5% $-73 | +0% $-21 | +5% $32 | +10% $84 |
| Rate | -1.0pp $60 | -0.5pp $20 | base $-21 | +0.5pp $-62 | +1.0pp $-104 |
UW: 25.0% down · 7.5% · 30yr · 1.5% tax · 5.0% vac · 8.0% maint · 8.0% mgmt
Financing live
Cash to close
- Down payment
- $40,000
- Closing costs
- $4,800
- Reserves months
- —
- Total cash needed
- —
Loan-product check · same deal, 3 products live
Conventional
25% down · 7.5% · 30yr
- Down + closing
- —
- Monthly P&I
- —
- Monthly cashflow
- —
- DSCR
- —
- Eligible?
- —
Personal DTI + credit; lowest rate.
DSCR
20% down · 8.5% · 30yr
- Down + closing
- —
- Monthly P&I
- —
- Monthly cashflow
- —
- DSCR
- —
- Eligible?
- —
No personal income docs; deal must DSCR.
Hard money
10% down · 12.0% · 12mo
- Down + closing
- —
- Monthly P&I
- —
- Monthly cashflow
- —
- DSCR
- —
- Eligible?
- —
Short-term bridge; refi at stabilization.
Rent comps 9 comps
| Address | Beds | Baths | Sqft | Rent | $/sqft | DOM | Units | Dist |
|---|---|---|---|---|---|---|---|---|
| 819 Keli Ct Azle, TX | 3.0 | 2.0 | 1082 | $1,600 | $1.48 | 21d | 1 | 0.81mi |
| 1032 Greg St Azle, TX | 2.0 | 2.0 | 1200 | $1,695 | $1.41 | 21d | 1 | 0.84mi |
| 515 W Main St Azle, TX | 2.0 | 1.0 | 1080 | $1,250 | $1.16 | 46d | 1 | 0.93mi |
| 519 W Main St Azle, TX | 2.0 | 1.0 | 721 | $1,150 | $1.60 | 0d | 1 | 0.94mi |
| 527 W Main St Apt 40 Azle, TX | 2.0 | 1.0 | 1080 | $1,250 | $1.16 | 46d | 1 | 0.95mi |
| 108 Parkwood Ct Azle, TX | 3.0 | 2.0 | 1226 | $1,899 | $1.55 | 5d | 1 | 1.24mi |
| 1005 Idlewood Ave Azle, TX | 3.0 | 3.0 | 1456 | $1,899 | $1.30 | 26d | 1 | 1.42mi |
| 220 Baughman Hill Rd Unit 8 Azle, TX | 3.0 | 2.0 | 1100 | $1,300 | $1.18 | 19d | 1 | 1.44mi |
| 728 Poe St Azle, TX | 3.0 | 2.0 | 1249 | $1,675 | $1.34 | 26d | 1 | 1.44mi |
Listing history 25 events
-
2026-06-22days on market $160,000 Active 52 DOM
-
2026-06-21days on market $160,000 Active 51 DOM
-
2026-06-18days on market $160,000 Active 48 DOM
-
2026-06-17days on market $160,000 Active 47 DOM
-
2026-06-16days on market $160,000 Active 46 DOM
-
2026-06-15days on market $160,000 Active 45 DOM
-
2026-06-13days on market $160,000 Active 43 DOM
-
2026-06-13days on market $160,000 Active 42 DOM
-
2026-06-09days on market $160,000 Active 39 DOM
-
2026-06-08days on market $160,000 Active 38 DOM
-
2026-06-07days on market $160,000 Active 37 DOM
-
2026-06-04days on market $160,000 Active 34 DOM
-
2026-06-03days on market $160,000 Active 33 DOM
-
2026-06-02days on market $160,000 Active 32 DOM
-
2026-06-01days on market $160,000 Active 31 DOM
-
2026-05-31days on market $160,000 Active 30 DOM
-
2026-04-30$160,000 Active 730-char remark
-
2021-06-10soldstatus Sold 305-char remark
Show marketing remark (305 chars)
Almost a half acre lot with beautiful mature oak trees. 3 bedroom, 2 bath singlewide. Well and septic. Carport. Mobile needs some work. In sought after Silver Creek Elementary school zone. Close to Main Street with shopping, park, and library. Will only go cash or conventional. HVAC was replaced in 2008.
-
2021-06-10soldstatus
Show marketing remark (305 chars)
Almost a half acre lot with beautiful mature oak trees. 3 bedroom, 2 bath singlewide. Well and septic. Carport. Mobile needs some work. In sought after Silver Creek Elementary school zone. Close to Main Street with shopping, park, and library. Will only go cash or conventional. HVAC was replaced in 2008.
-
2021-06-03status Pending 305-char remark
Show marketing remark (305 chars)
Almost a half acre lot with beautiful mature oak trees. 3 bedroom, 2 bath singlewide. Well and septic. Carport. Mobile needs some work. In sought after Silver Creek Elementary school zone. Close to Main Street with shopping, park, and library. Will only go cash or conventional. HVAC was replaced in 2008.
-
2021-05-29historical Active Option Contract 305-char remark
Show marketing remark (305 chars)
Almost a half acre lot with beautiful mature oak trees. 3 bedroom, 2 bath singlewide. Well and septic. Carport. Mobile needs some work. In sought after Silver Creek Elementary school zone. Close to Main Street with shopping, park, and library. Will only go cash or conventional. HVAC was replaced in 2008.
-
2021-05-21price $89,900 305-char remark
Show marketing remark (305 chars)
Almost a half acre lot with beautiful mature oak trees. 3 bedroom, 2 bath singlewide. Well and septic. Carport. Mobile needs some work. In sought after Silver Creek Elementary school zone. Close to Main Street with shopping, park, and library. Will only go cash or conventional. HVAC was replaced in 2008.
-
2021-05-14$94,000 Active 305-char remark
Show marketing remark (305 chars)
Almost a half acre lot with beautiful mature oak trees. 3 bedroom, 2 bath singlewide. Well and septic. Carport. Mobile needs some work. In sought after Silver Creek Elementary school zone. Close to Main Street with shopping, park, and library. Will only go cash or conventional. HVAC was replaced in 2008.
-
2016-01-25soldstatus
-
1980-07-22soldstatus
ⓘ Source: listings_history table (triggers on properties + properties_extension) + one-shot
backfill from property_details.listing_events for pre-trigger history.
Tax reassessment forecast TX · Resets to sale price
- Current annual tax
- $1,915 · $160/mo
- Projected year-2 tax
- $2,928 · $244/mo
- Expected delta
- +$1,013/yr (+$84/mo · 52.9%)
ⓘ Screening estimate from a state-policy table — verify with the county assessor before closing.
Climate risk First Street
- Flood 1/10 Low FEMA zone X (unshaded) · 0% chance over 30 yrs
- Wildfire 5/10 Major
- Heat 7/10 Severe 7 d/yr ≥109°F today · 23 d/yr by 30 yrs out
- Wind 6/10 Major 27% chance of damaging wind over 30 yrs
- Air quality 2/10 Low 1 unhealthy d/yr today · 1 by 30 yrs out
Nearby sold comps map
Loading sold comps map…
Walkable amenities ~0.75 mi
Loading nearby amenities…
Taxation est. · year 1
- Rental income
- $15,868
- − Mortgage interest
- −$8,962
- − Property taxes
- −$1,915
- − Insurance
- −$800
- − Repairs & maintenance
- −$1,269
- − Management
- −$1,269
- − Depreciation
- −$4,655
- Taxable loss
- −$3,003
- Est. tax savings @ 24.0%
- +$721
- After-tax cash flow
- $472/yr
For passive investors: Depreciation is non-cash, so a rental often shows a tax loss while cash-flowing — sheltering income. Rental losses are passive: they offset passive income freely, and up to $25,000/yr can offset ordinary (W-2) income if you actively participate and your MAGI is under $100k (phasing out to $0 by $150k); unused losses carry forward. On sale, claimed depreciation is recaptured at up to 25%, and gains may owe capital-gains tax (a 1031 exchange can defer both). Figures are a year-1 estimate at your 24.0% rate — not tax advice; consult a CPA.
Schools (NCES district)
- District
- Azle ISD
- NCES district ID
- 4809200
- Math proficiency
- 37% ▼ -11.00%
- Reading proficiency
- 43% ▼ -5.00%
- Median HH income
- $61,473
- Composite
- 35.57/100
- National rank
- #4900
- State rank
- #351 of 826 in TX
Livability — Azle
- Score
- 72/100
- State rank
- #267
- US rank
- #6239
Category grades
Schools grade is shown separately in the Schools card above.
Census & demographics
- Census place
- Azle, TX
- County
- Parker County · 144,797 people
- City population
- 34,602
- Metro
- Dallas-Fort Worth-Arlington, TX
- Population (ZIP)
- 34,602
- Household income
- $87,298
- Rent vs Own
- Severe rent burden
- 433.0
Population outlook (Parker County) Hauer SSP2
- Today (2025)
- 147,426 people
- By 2030
- 157,863 · +7.1%
- By 2040
- 177,519 · +20.4%
- By 2050
- 194,786 · +32.1%
- By 2075
- 238,799 · +62.0%
- By 2100
- 264,126 · +79.2%
Race, ethnicity, and origin ACS 2023
- Neighborhood character
- Predominantly White (78%)
- Race & ethnicity
- White 78% Hispanic / Latino 18% Two or more races 9% Black 1%
- Hispanic origin (detail)
- Mexican 15%
- Common ancestry
- Slovak 2% Italian 1% Portuguese 1%
- Foreign-born
- 5% · Canada
- Languages at home
- 89% English-only · Spanish 11%
Political lean MEDSL · Parker
- 2024 margin
- Solid R (+66.4) · D 16.4% · R 82.8%
- 2008→2024 swing
- -11.2pp toward R · 2008: -55.2pp · 2024: -66.4pp
- All cycles
- 2024: R+66.4 2020: R+64.4 2016: R+67.5 2012: R+65.8 2008: R+55.2
Not yet ingested
- Civics
- —
Market trends
- HPI YoY
- ▼ -74.72%
- Current HPI
- 287.155
- Rent YoY
- ▲ 2.31%
- Metro
- Dallas-Fort Worth-Arlington, TX
- State GDP YoY
- ▲ 3.95%
- F500 in state
- 110
Industry mix (Fortune 500 HQ in TX)
| Industry | F500 HQs | Revenue |
|---|---|---|
| Energy | 16 | $1,198B |
|
||
| Technology | 5 | $198B |
|
||
| Engineering / Construction | 4 | $72B |
|
||
| Energy Services | 3 | $60B |
|
||
| Utilities | 3 | $41B |
|
||
| Healthcare | 2 | $330B |
|
||
Price history
+70.2% since first listed9 events — show timeline
- 2026-04-30 Listed $160,000 NTREIS
- 2021-06-10 Sold (Public Records) — Public Records
- 2021-06-10 Sold (MLS) — NTREIS
- 2021-06-03 Pending — NTREIS
- 2021-05-29 Contingent — NTREIS
- 2021-05-21 Price Changed $89,900 NTREIS
- 2021-05-14 Listed $94,000 NTREIS
- 2016-01-25 Sold (Public Records) — Public Records
- 1980-07-22 Sold (Public Records) — Public Records
Property tax history
+12.6%/yrLatest (2025): $1,915 · -30.7% YoY. Source: county tax records.
Cash-flow waterfall
monthlySold comps — $/sqft
last 12 mo · ≤1 miLoading sold comps…