226 Sullivan Ave · London, OH
Flood risk 1/10 · Minimal
- FEMA flood zone
- X (unshaded)
- Chance of flooding over 30 yrs
- 0.0%
- Est. flood insurance / yr
- $473 – $860
Fire risk 1/10 · Minimal
- Est. fire insurance / yr
- $713 – $1,323
Heat risk 3/10 · Minor
- Hot days now (above 99°F)
- 7 days/yr
- Hot days in 30 yrs
- 17 days/yr
Wind risk 2/10 · Minimal
- Chance of severe wind over 30 yrs
- 1.0%
Air-quality risk 3/10 · Minor
- Unhealthy air days now
- 2 days/yr
- Unhealthy air days in 30 yrs
- 4 days/yr
Risk factors via First Street. Map © Google.
Why this score? — see what drove the B grade
The composite is a weighted blend of 9 inputs, each scored 0–100. Each bar is that input's sub-score; the figure is the points it added to the 100-point composite (weight × sub-score).
- Cash flow +30.0/30.0
- 1% rule +10.0/10.0
- DSCR +10.0/10.0
- ARV discount +7.5/15.0
- Schools +4.0/10.0
- Livability +3.5/5.0
- Rent growth +2.5/5.0
- Condition / age +2.5/5.0
- Appreciation +0.0/10.0
$49,900
🖨 Deal sheet (PDF) 📄 Offer letter ✓ Due diligence
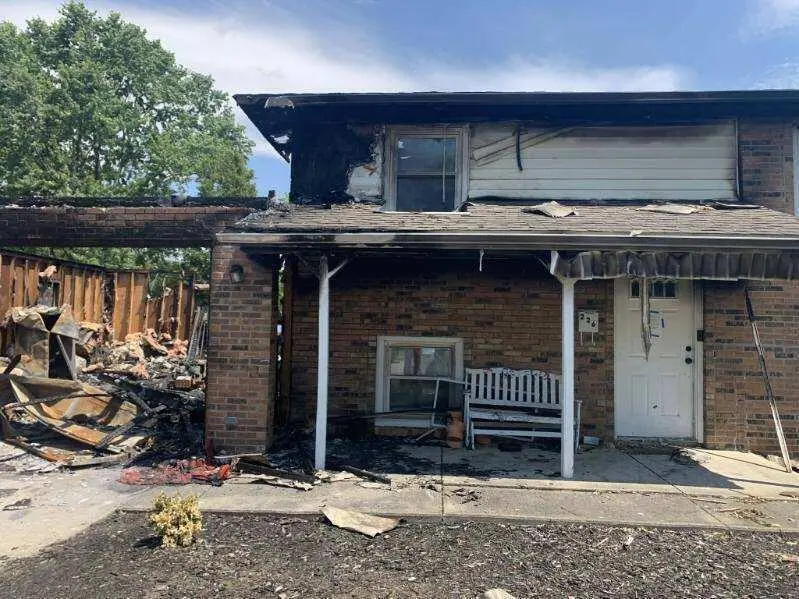
Listing remarks MLS
BEAUTIFULLY DECORATED BI-LEVEL ON CUL-DE-SAC. LOTS OF FLOWER BEDS ANDROSES. LARGE COVERED DECK. REMODELED KITCHEN.
Key facts
- 6,098 sq ft lot
- 2 garage spots
- Built 1978
Property features AI
Exterior
- Parking: Attached 2-car garage
- Utilities: Public water; Public sewer
- Home design: Single-family residence; Bi-level design; Built in 1978; No common walls
- Construction: Block foundation
- Exterior features: Additional parcel(s) included (31-03052.000, 31-03053.000)
Interior
- Bathrooms: 1 full bathroom; 1 half bathroom (1.5 total)
- Interior features: Partial basement
Neighborhood map
What this means for you Summary
Snapshot
- This is a 3-bed/1.5-bath single-family listed at $50k.
Deal economics
- At list price, monthly cash flow is $754 ($9k/yr) — positive.
- The deal already cash-flows at list — no discount required.
- Meets the 1% rule at list price ($1k rent vs $50k).
- Cap rate 24.4% vs local median 3.1% in London — top-decile yield for the area; either an underpriced asset or a hidden risk that comps aren't pricing in. Stress-test before assuming the spread holds.
Location & tenants
- Location reads 70/100 on livability (#477 in OH) — a middle-class / working-renter tenant base. Strengths: crime A+, cost of living A+, housing A+; Watch: amenities F, commute F, health & safety F.
- London City (town): math 39% / reading 54% proficiency, ranked #479 of 656 in OH (top 73%) — families likely to look elsewhere, expect single-tenant / working-renter base with shorter leases.
- Market conditions: 112 active listings in the ZIP; 3 comparable units currently listed for rent nearby; rentals leasing fast (median 4d on market — plan ~1-2 weeks tenant-placement turnaround); solid renter incomes; 530 units permitted in Madison County in 2024 (120 in 5+ unit buildings).
Forward outlook
- Local home prices are declining (-3.0%/yr); year-one equity from $345 of loan paydown is wiped out by about $1k of value loss. Plan a longer hold.
- Madison County population projected at +4% by 2050 — modest demand growth; plan on rents tracking national, not racing it.
- At projected returns (-3.0% appreciation + 3.0% rent growth), your $14k cash investment doubles in ~2 years — after that, you're playing with house money.
Negotiation context
- Only 5 days on market — expect competitive offers; lowballing is unlikely to land.
- 2 sale attempts since 31y ago; this cycle's ask has dropped $25k (33%) from the opening price — seller is motivated, your offer sets the floor, not the list.
Risks & watch-outs
- Watch-outs: property tax is 2.9% of price.
Questions for the listing agent
- Built in 1978 — when were the roof, HVAC, electrical panel, plumbing, and water heater last replaced?
- Property tax is high relative to price — has the assessment been appealed recently, and will the sale trigger a re-assessment?
- Is there a deadline driving the sale (1031 exchange, divorce, estate, relocation)? That informs how much negotiation room exists.
- Schools are B-rated — typically a magnet for longer-tenancy family renters. What's the average tenant stay here, and is there a school-zone premium baked into asking?
- What's the average days-on-market for RENTAL listings here right now (not sales)? A rising rental-DOM trend means longer vacancies and softer asking-rent achievability than the comps imply.
- What's the recent tenant-quality profile in this submarket — average credit score on applications, eviction rate, late-payment / NSF rate, and stable-employment percentage? A property-management company in the area should have these aggregated.
- How much new for-sale + rental construction is in the pipeline within 1–3 miles? Heavy new supply typically softens prices + rents 12–24 months out; constrained supply supports both.
Investment metrics
- 1% rule
- 2.94% ✓
- Cap rate
- 24.43%
- Cash-on-cash
- 64.77%
- DSCR
- 3.88
- GRM
- 2.8
CMA / ARV
- ARV (on-the-fly)
- $227,520
- Comps found
- 12
Show comp detail 12 sales within ~0.75 mi
| Address | Dist | Beds/Ba | Sqft | Sold | Price | $/sf | Match |
|---|---|---|---|---|---|---|---|
| 200 Washington Ave | 0.42mi | 3/2.0 | 1,395 (-3%) | 2mo | $225,000 | $161 | 72 |
| 25 Vernon Ave | 0.38mi | 3/2.0 | 1,456 (+1%) | 11mo | $204,900 | $141 | 69 |
| 37 Lotspeich Ave | 0.47mi | 3/1.5 | 1,494 (+4%) | 4mo | $213,000 | $143 | 68 |
| 188 S Oak St | 0.47mi | 4/1.5 (+1) | 1,404 (-2%) | 11mo | $250,000 | $178 | 60 |
| 121 Maple St | 0.29mi | 3/1.0 | 1,264 (-12%) | 11mo | $199,900 | $158 | 55 |
| 244 S Main St | 0.30mi | 2/1.0 (-1) | 1,248 (-13%) | 4mo | $180,000 | $144 | 54 |
| 148 New Hampshire Ave | 0.59mi | 3/1.0 | 1,364 (-5%) | 11mo | $190,000 | $139 | 53 |
| 161 Western Ave | 0.72mi | 4/1.0 (+1) | 1,356 (-6%) | 5mo | $175,000 | $129 | 46 |
| 202 Toland St | 0.61mi | 4/2.5 (+1) | 1,502 (+4%) | 11mo | $300,000 | $200 | 46 |
| 251 E 1st St | 0.50mi | 4/1.5 (+1) | 1,225 (-15%) | 1mo | $224,000 | $183 | 46 |
| 151 New Hampshire Ave | 0.60mi | 4/3.0 (+1) | 1,551 (+8%) | 11mo | $310,000 | $200 | 39 |
| 84 E 5th St | 0.70mi | 3/1.0 | 1,620 (+12%) | 7mo | $220,000 | $136 | 38 |
Match score weights: distance 35% · size 25% · config 20% · recency 20%. Top-matched comps best support the ARV.
Projected returns pro-forma
-3.0% appreciation · 3.0% rent growth · sell at horizon
- IRR
- 63.9%
- Equity multiple
- 3.86×
- Total profit
- $40,004
- Equity at exit
- $7,440
- IRR
- 68.4%
- Equity multiple
- 7.94×
- Total profit
- $96,921
- Equity at exit
- $4,314
Cash invested: $13,972 (down + closing). Projections, not guarantees.
Landlord ↔ Tenant lean methodology
- Overall (STATE)
- 73 Landlord-Friendly
- State Ohio
- 73 Landlord-Friendly · R+6
- County
- — inherits STATE
- City
- — inherits STATE
ZIP-level market 43140
- Active inventory
- 112
- Price-to-rent
- 2.8×
Monthly cashflow live
- Estimated rent
- $1,466 medium interval (Pro) →
- Mortgage (P&I)
- −$262
- Tax from tax record
- −$122 /mo · $1,463/yr
- Insurance
- −$21
- HOA
- −$0
- Vacancy / Maint / Mgmt
- −$308
- Net cashflow
- $754
Break-even live
Sensitivity live
| Price | -10% $782 | -5% $768 | +0% $754 | +5% $740 | +10% $726 |
|---|---|---|---|---|---|
| Rent | -10% $638 | -5% $696 | +0% $754 | +5% $812 | +10% $870 |
| Rate | -1.0pp $779 | -0.5pp $767 | base $754 | +0.5pp $741 | +1.0pp $728 |
UW: 25.0% down · 7.5% · 30yr · 1.5% tax · 5.0% vac · 8.0% maint · 8.0% mgmt
Financing live
Cash to close
- Down payment
- $12,475
- Closing costs
- $1,497
- Reserves months
- —
- Total cash needed
- —
Loan-product check · same deal, 3 products live
Conventional
25% down · 7.5% · 30yr
- Down + closing
- —
- Monthly P&I
- —
- Monthly cashflow
- —
- DSCR
- —
- Eligible?
- —
Personal DTI + credit; lowest rate.
DSCR
20% down · 8.5% · 30yr
- Down + closing
- —
- Monthly P&I
- —
- Monthly cashflow
- —
- DSCR
- —
- Eligible?
- —
No personal income docs; deal must DSCR.
Hard money
10% down · 12.0% · 12mo
- Down + closing
- —
- Monthly P&I
- —
- Monthly cashflow
- —
- DSCR
- —
- Eligible?
- —
Short-term bridge; refi at stabilization.
Rent comps 3 comps
| Address | Beds | Baths | Sqft | Rent | $/sqft | DOM | Units | Dist |
|---|---|---|---|---|---|---|---|---|
| 64 W Center St London, OH | 3.0 | 1.0 | 963 | $1,595 | $1.66 | 44d | 1 | 0.56mi |
| 1 E High St Unit 3G London, OH | 2.0 | 1.0 | 1200 | $955 | $0.80 | 2d | 1 | 0.69mi |
| 107 Chandler Ave London, OH | 3.0 | 2.5 | 1280 | $1,950 | $1.52 | 4d | 1 | 0.92mi |
Listing history 8 events
-
2026-05-22price $49,900
-
2026-05-21$75,000 Active
-
2023-05-24soldstatus $105,000
-
2001-10-11soldstatus $84,000
-
1995-07-06soldstatus $74,500
-
1995-06-30soldstatus $74,500 114-char remark
Show marketing remark (114 chars)
BEAUTIFULLY DECORATED BI-LEVEL ON CUL-DE-SAC. LOTS OF FLOWER BEDS ANDROSES. LARGE COVERED DECK. REMODELED KITCHEN.
-
1995-05-24historical 114-char remark
Show marketing remark (114 chars)
BEAUTIFULLY DECORATED BI-LEVEL ON CUL-DE-SAC. LOTS OF FLOWER BEDS ANDROSES. LARGE COVERED DECK. REMODELED KITCHEN.
-
1995-02-14$74,500 114-char remark
Show marketing remark (114 chars)
BEAUTIFULLY DECORATED BI-LEVEL ON CUL-DE-SAC. LOTS OF FLOWER BEDS ANDROSES. LARGE COVERED DECK. REMODELED KITCHEN.
ⓘ Source: listings_history table (triggers on properties + properties_extension) + one-shot
backfill from property_details.listing_events for pre-trigger history.
Tax reassessment forecast OH · Partial reset (capped growth)
- Current annual tax
- $1,463 · $122/mo
- Projected year-2 tax
- $1,463 · $122/mo
- Expected delta
- $0/yr ($0/mo · 0.0%)
ⓘ Screening estimate from a state-policy table — verify with the county assessor before closing.
Climate risk First Street
- Flood 1/10 Low FEMA zone X (unshaded) · 0% chance over 30 yrs
- Wildfire 1/10 Low
- Heat 3/10 Moderate 7 d/yr ≥99°F today · 17 d/yr by 30 yrs out
- Wind 2/10 Low 100% chance of damaging wind over 30 yrs
- Air quality 3/10 Moderate 2 unhealthy d/yr today · 4 by 30 yrs out
Nearby sold comps map
Loading sold comps map…
Walkable amenities ~0.75 mi
Loading nearby amenities…
Taxation est. · year 1
- Rental income
- $17,598
- − Mortgage interest
- −$2,795
- − Property taxes
- −$1,463
- − Insurance
- −$250
- − Repairs & maintenance
- −$1,408
- − Management
- −$1,408
- − Depreciation
- −$1,452
- Taxable income
- $8,823
- Est. tax owed @ 24.0%
- −$2,117
- After-tax cash flow
- $6,932/yr
For passive investors: Depreciation is non-cash, so a rental often shows a tax loss while cash-flowing — sheltering income. Rental losses are passive: they offset passive income freely, and up to $25,000/yr can offset ordinary (W-2) income if you actively participate and your MAGI is under $100k (phasing out to $0 by $150k); unused losses carry forward. On sale, claimed depreciation is recaptured at up to 25%, and gains may owe capital-gains tax (a 1031 exchange can defer both). Figures are a year-1 estimate at your 24.0% rate — not tax advice; consult a CPA.
Schools (NCES district)
- District
- London City
- NCES district ID
- 3904425
- Math proficiency
- 39% ▼ -19.00%
- Reading proficiency
- 54% ▼ -9.00%
- Median HH income
- $53,859
- Composite
- 40.19/100
- National rank
- #3785
- State rank
- #479 of 656 in OH
Livability — London
- Score
- 70/100
- State rank
- #477
- US rank
- #7937
Category grades
Schools grade is shown separately in the Schools card above.
Census & demographics
- Census place
- London, OH
- County
- Madison · 56,187 people
- Metro
- Columbus, OH
- Population (ZIP)
- 24,162
- Household income
- $82,598
- Rent vs Own
- Severe rent burden
- 7.4
Population outlook (Madison County) Hauer SSP2
- Today (2025)
- 46,050 people
- By 2030
- 46,826 · +1.7%
- By 2040
- 47,941 · +4.1%
- By 2050
- 47,919 · +4.1%
- By 2075
- 46,160 · +0.2%
- By 2100
- 38,584 · -16.2%
Race, ethnicity, and origin ACS 2023
- Neighborhood character
- Predominantly White (82%)
- Race & ethnicity
- White 82% Black 8% Two or more races 7% Hispanic / Latino 2% Asian 2%
- Common ancestry
- Slovak 2% Iranian 2% Lithuanian 1%
- Foreign-born
- 3% · Canada, South Korea
- Languages at home
- 95% English-only · Spanish 2% Other Indo-European 1%
Political lean MEDSL · Madison
- 2024 margin
- Solid R (+43.7) · D 27.6% · R 71.3% · Other 1.1%
- 2008→2024 swing
- -20.3pp toward R · 2008: -23.4pp · 2024: -43.7pp
- All cycles
- 2024: R+43.7 2020: R+41.0 2016: R+39.7 2012: R+20.4 2008: R+23.4
Not yet ingested
- Civics
- —
Market trends
- HPI YoY
- ▼ -224.46%
- Current HPI
- 249.4987
- Rent YoY
- —
- Metro
- —
- State GDP YoY
- ▲ 1.98%
- F500 in state
- 48
Industry mix (Fortune 500 HQ in OH)
| Industry | F500 HQs | Revenue |
|---|---|---|
| Insurance | 3 | $145B |
|
||
| Industrial Machinery | 3 | $49B |
|
||
| Financial Services | 3 | $24B |
|
||
| Consumer Goods | 2 | $93B |
|
||
| Aerospace / Defense | 2 | $47B |
|
||
| Utilities | 2 | $33B |
|
||
Price history
-33.0% since first listed8 events — show timeline
- 2026-05-22 Price Changed $49,900 CBRMLS
- 2026-05-21 Listed $75,000 CBRMLS
- 2023-05-24 Sold (Public Records) $105,000 Public Records
- 2001-10-11 Sold (Public Records) $84,000 Public Records
- 1995-07-06 Sold (Public Records) $74,500 Public Records
- 1995-06-30 Sold (MLS) $74,500 CBRMLS
- 1995-05-24 Listing Removed — CBRMLS
- 1995-02-14 Listed $74,500 CBRMLS
Property tax history
+1.5%/yrLatest (2025): $1,463 · -3.6% YoY. Source: county tax records.
Cash-flow waterfall
monthlySold comps — $/sqft
last 12 mo · ≤1 miLoading sold comps…