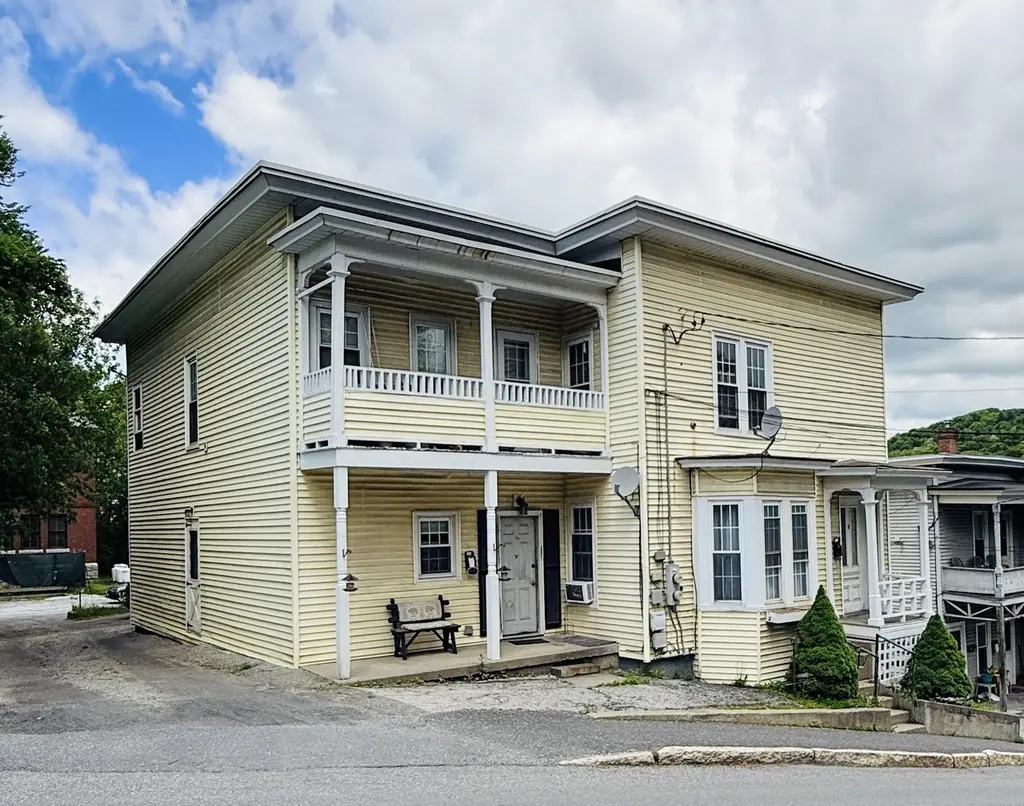
8 Mount St · Barre, VT
Flood risk 1/10 · Minimal
- FEMA flood zone
- X (unshaded)
- Chance of flooding over 30 yrs
- 0.0%
- Est. flood insurance / yr
- $473 – $860
Fire risk 3/10 · Minor
- Est. fire insurance / yr
- $480 – $892
Heat risk 2/10 · Minimal
- Hot days now (above 89°F)
- 8 days/yr
- Hot days in 30 yrs
- 19 days/yr
Wind risk 2/10 · Minimal
- Chance of severe wind over 30 yrs
- 3.0%
Air-quality risk 2/10 · Minimal
- Unhealthy air days now
- 0 days/yr
- Unhealthy air days in 30 yrs
- 1 days/yr
Risk factors via First Street. Map © Google.
Why this score? — see what drove the D grade
The composite is a weighted blend of 9 inputs, each scored 0–100. Each bar is that input's sub-score; the figure is the points it added to the 100-point composite (weight × sub-score).
- Cash flow +14.9/30.0
- ARV discount +7.5/15.0
- Schools +5.0/10.0
- DSCR +4.6/10.0
- 1% rule +3.5/10.0
- Livability +3.0/5.0
- Rent growth +2.5/5.0
- Condition / age +2.5/5.0
- Appreciation +0.0/10.0
$250,000
🖨 Deal sheet 📄 Offer letter ✓ Due diligence
Listing remarks MLS
Large 2 unit building. Lots of space and room for storage. up and down units with separate access. Good investment opportunity. Seller to retain easement to lot at VT History Center.
Key facts
- Two-story duplex
- Dine-in kitchen
- Separate utilities
Tags
Property features AI
Finance
- Other: Unit 1: 5 rooms, month-to-month lease; Unit 2: 5 rooms
- Financial info: Two-unit building with month-to-month leases; Contains two 2-bedroom units
Exterior
- Parking: Paved driveway
- Utilities: Public water; Public sewer; Cable available (Spectrum); High-speed internet available; Gas available via LP/bottle; Electric service by Green Mountain Power
- Home design: Multi-family property; Existing building; Yellow exterior
- Construction: Built in 1890; Vinyl exterior; Flat membrane roof
- Exterior features: Paved driveway; Sloping lot, in town location; Near shopping and public transportation; Easements on property; Public road frontage
Interior
- Kitchen: Electric water heater (owned, tank, separate)
- Bedrooms: Two 2-bedroom units (Unit 1 on first level)
- Flooring: Carpet; Laminate
- Bathrooms: Each unit has 1 bathroom
- Heating & cooling: Propane and oil heating; Direct vent heating; Hot air heat; No central cooling
- Interior features: Basement with interior access; Unfinished walkout basement with stairs
- Laundry & utility: High-capacity 100 Amp electric service
Neighborhood map
What this means for you Summary
Snapshot
- This is a 4-bed/2.0-bath other listed at $250k.
Deal economics
- At list price, monthly cash flow is $74 ($886/yr) — positive.
- The deal already cash-flows at list — no discount required.
- To meet the 1% rule (rent ≥ 1% of price), the offer needs to be $212k (15.3% below list).
- Recommended offer: $212k (15.3% below list) — sets the bar for 1% rule.
- Cap rate 6.6% vs local median 4.5% in Barre — top-decile yield for the area; either an underpriced asset or a hidden risk that comps aren't pricing in. Stress-test before assuming the spread holds.
Location & tenants
- Location reads 60/100 on livability (#92 in VT) — a middle-class / working-renter tenant base. Strengths: cost of living A+, health & safety A+, housing A-; Watch: crime F, amenities F, commute F.
- Zoned schools: Barre City Elementary/Middle School (math 20% / reading 33%, grade F, #159 of 192 statewide, top 83%, 784 students, 39% FRL).
- Market conditions: 91 active listings in the ZIP; solid renter incomes; 185 units permitted in Washington County in 2024 (30 in 5+ unit buildings).
- This rent runs 33% of the median local income ($77k/yr) — at the standard rent-burdened threshold; future hikes will face affordability resistance.
Forward outlook
- Local home prices are declining (-3.0%/yr); year-one equity from $2k of loan paydown is wiped out by about $8k of value loss. Plan a longer hold.
- Washington County population projected at -19% by 2050 — secular population decline; favor cash flow + early exit over multi-decade hold.
Negotiation context
- It's been on market 18 days — a 2% lower offer ($246k) is reasonable based on typical stale-listing flexibility.
- 2 sale attempts since 19y ago with the ask held roughly flat each time — persistent listings suggest the price (not the market) is what's stuck; bring a comps-based counter.
- Current owner paid $90k; list at $250k implies a 178% gain — meaningful room to come down on a strong offer.
Risks & watch-outs
- Watch-outs: built in 1890 — expect roof / HVAC / electrical / plumbing capex.
Questions for the listing agent
- Built in 1890 — when were the roof, HVAC, electrical panel, plumbing, and water heater last replaced?
- Is there a deadline driving the sale (1031 exchange, divorce, estate, relocation)? That informs how much negotiation room exists.
- Schools are F-rated, which usually means shorter tenancies and higher turnover. Who's the typical renter profile here, and what's been the actual vacancy rate?
- Crime grade is F in this area — have there been break-ins, vandalism, or insurance claims at this property in the last 3 years? What carrier currently insures it and at what premium?
- The area grade is low — what's the realistic commute time and amenity access for the typical tenant pool here? Any planned neighborhood developments (good or bad) we should know about?
- What's the average days-on-market for RENTAL listings here right now (not sales)? A rising rental-DOM trend means longer vacancies and softer asking-rent achievability than the comps imply.
- What's the recent tenant-quality profile in this submarket — average credit score on applications, eviction rate, late-payment / NSF rate, and stable-employment percentage? A property-management company in the area should have these aggregated.
- How much new for-sale + rental construction is in the pipeline within 1–3 miles? Heavy new supply typically softens prices + rents 12–24 months out; constrained supply supports both.
Investment metrics
- 1% rule
- 0.85% ✗
- Cap rate
- 6.65%
- Cash-on-cash
- 1.27%
- DSCR
- 1.06
- GRM
- 9.8
CMA / ARV
No comps found within radius.
Projected returns pro-forma
-3.0% appreciation · 3.0% rent growth · sell at horizon
- IRR
- -14.3%
- Equity multiple
- 0.49×
- Total profit
- $-35,854
- Equity at exit
- $37,276
- IRR
- -5.6%
- Equity multiple
- 0.64×
- Total profit
- $-25,355
- Equity at exit
- $21,615
Cash invested: $70,000 (down + closing). Projections, not guarantees.
Landlord ↔ Tenant lean methodology
- Overall (STATE)
- 41 Moderately Tenant-Leaning
- State Vermont
- 41 Moderately Tenant-Leaning · D+15
- County
- — inherits STATE
- City
- — inherits STATE
ZIP-level market 05641
- Home prices YoY
- -19.7%
- Active inventory
- 91
- Price-to-rent
- 9.8×
Monthly cashflow live
- Estimated rent
- $2,118 medium interval (Pro) →
- Mortgage (P&I)
- −$1,311
- Tax from tax record
- −$184 /mo · $2,211/yr
- Insurance
- −$104
- HOA
- −$0
- Vacancy / Maint / Mgmt
- −$445
- Net cashflow
- $74
Break-even live
UW: 25.0% down · 7.5% · 30yr · 1.5% tax · 5.0% vac · 8.0% maint · 8.0% mgmt
Financing live
Cash to close
- Down payment
- $62,500
- Closing costs
- $7,500
- Reserves months
- —
- Total cash needed
- —
Loan-product check · same deal, 3 products live
Conventional
25% down · 7.5% · 30yr
- Down + closing
- —
- Monthly P&I
- —
- Monthly cashflow
- —
- DSCR
- —
- Eligible?
- —
Personal DTI + credit; lowest rate.
DSCR
20% down · 8.5% · 30yr
- Down + closing
- —
- Monthly P&I
- —
- Monthly cashflow
- —
- DSCR
- —
- Eligible?
- —
No personal income docs; deal must DSCR.
Hard money
10% down · 12.0% · 12mo
- Down + closing
- —
- Monthly P&I
- —
- Monthly cashflow
- —
- DSCR
- —
- Eligible?
- —
Short-term bridge; refi at stabilization.
Listing history 13 events
-
2026-06-19days on market $250,000 Active 18 DOM
-
2026-06-18days on market $250,000 Active 17 DOM
-
2026-06-17days on market $250,000 Active 16 DOM
-
2026-06-16days on market $250,000 Active 15 DOM
-
2026-06-15days on market $250,000 Active 14 DOM
-
2026-06-14days on market $250,000 Active 12 DOM
-
2026-06-12days on market $250,000 Active 11 DOM
-
2026-06-09days on market $250,000 Active 8 DOM
-
2026-06-08days on market $250,000 Active 7 DOM
-
2026-06-07days on market $250,000 Active 6 DOM
-
2026-06-04days on market $250,000 Active 2 DOM
-
2026-06-01remarks 699-char remark
-
2026-06-01$250,000 Active 1 DOM
ⓘ Source: listings_history table (triggers on properties + properties_extension) + one-shot
backfill from property_details.listing_events for pre-trigger history.
Tax reassessment forecast VT · Partial reset (capped growth)
- Current annual tax
- $2,211 · $184/mo
- Projected year-2 tax
- $3,480 · $290/mo
- Expected delta
- +$1,270/yr (+$106/mo · 57.4%)
ⓘ Screening estimate from a state-policy table — verify with the county assessor before closing.
Climate risk First Street
- Flood 1/10 Low FEMA zone X (unshaded) · 0% chance over 30 yrs
- Wildfire 3/10 Moderate
- Heat 2/10 Low 8 d/yr ≥89°F today · 19 d/yr by 30 yrs out
- Wind 2/10 Low 3% chance of damaging wind over 30 yrs
- Air quality 2/10 Low 0 unhealthy d/yr today · 1 by 30 yrs out
Nearby sold comps map
Loading sold comps map…
Walkable amenities ~0.75 mi
Loading nearby amenities…
Taxation est. · year 1
- Rental income
- $25,417
- − Mortgage interest
- −$14,004
- − Property taxes
- −$2,211
- − Insurance
- −$1,250
- − Repairs & maintenance
- −$2,033
- − Management
- −$2,033
- − Depreciation
- −$7,273
- Taxable loss
- −$3,387
- Est. tax savings @ 24.0%
- +$813
- After-tax cash flow
- $1,699/yr
For passive investors: Depreciation is non-cash, so a rental often shows a tax loss while cash-flowing — sheltering income. Rental losses are passive: they offset passive income freely, and up to $25,000/yr can offset ordinary (W-2) income if you actively participate and your MAGI is under $100k (phasing out to $0 by $150k); unused losses carry forward. On sale, claimed depreciation is recaptured at up to 25%, and gains may owe capital-gains tax (a 1031 exchange can defer both). Figures are a year-1 estimate at your 24.0% rate — not tax advice; consult a CPA.
Schools (NCES district)
No district data.
Livability — Barre
- Score
- 60/100
- State rank
- #92
- US rank
- #19335
Category grades
Schools grade is shown separately in the Schools card above.
Census & demographics
- Census place
- Barre, VT
- County
- Washington County · 16,936 people
- City population
- 16,936
- Metro
- Barre, VT
- Population (ZIP)
- 16,936
- Household income
- $76,855
- Rent vs Own
- Severe rent burden
- 588.0
Population outlook (Washington County) Hauer SSP2
- Today (2025)
- 56,608 people
- By 2030
- 54,731 · -3.3%
- By 2040
- 50,227 · -11.3%
- By 2050
- 45,893 · -18.9%
- By 2075
- 36,818 · -35.0%
- By 2100
- 28,143 · -50.3%
Race, ethnicity, and origin ACS 2023
- Neighborhood character
- Predominantly White (92%)
- Race & ethnicity
- White 92% Hispanic / Latino 4% Two or more races 3% Black 1%
- Common ancestry
- Lithuanian 15% Slovak 7% Serbian 2%
- Foreign-born
- 2% · Canada
- Languages at home
- 97% English-only · French/Haitian/Cajun 1% Spanish 1% Russian/Polish/Slavic 1%
Political lean MEDSL · Washington
- 2024 margin
- Solid D (+43.4) · D 70.0% · R 26.6% · Other 3.4%
- 2008→2024 swing
- +2.4pp toward D · 2008: 41.0pp · 2024: 43.4pp
- All cycles
- 2024: D+43.4 2020: D+46.1 2016: D+37.0 2012: D+42.2 2008: D+41.0
Not yet ingested
- Civics
- —
Market trends
- HPI YoY
- ▼ -82.01%
- Current HPI
- 333.7046
- Rent YoY
- —
- Metro
- Barre, VT
- State GDP YoY
- —
- F500 in state
- 0
Price history
+171.7% since first listed4 events — show timeline
- 2026-06-01 Listed $250,000 PrimeMLS
- 2008-06-16 Sold (MLS) $90,000 PrimeMLS
- 2007-05-22 Listed $97,500 PrimeMLS
- 2000-11-09 Sold (Public Records) $92,000 Public Records
Property tax history
-5.4%/yrLatest (2024): $2,211 · +8.0% YoY. Source: county tax records.
Cash-flow waterfall
monthlySold comps — $/sqft
last 12 mo · ≤1 miLoading sold comps…