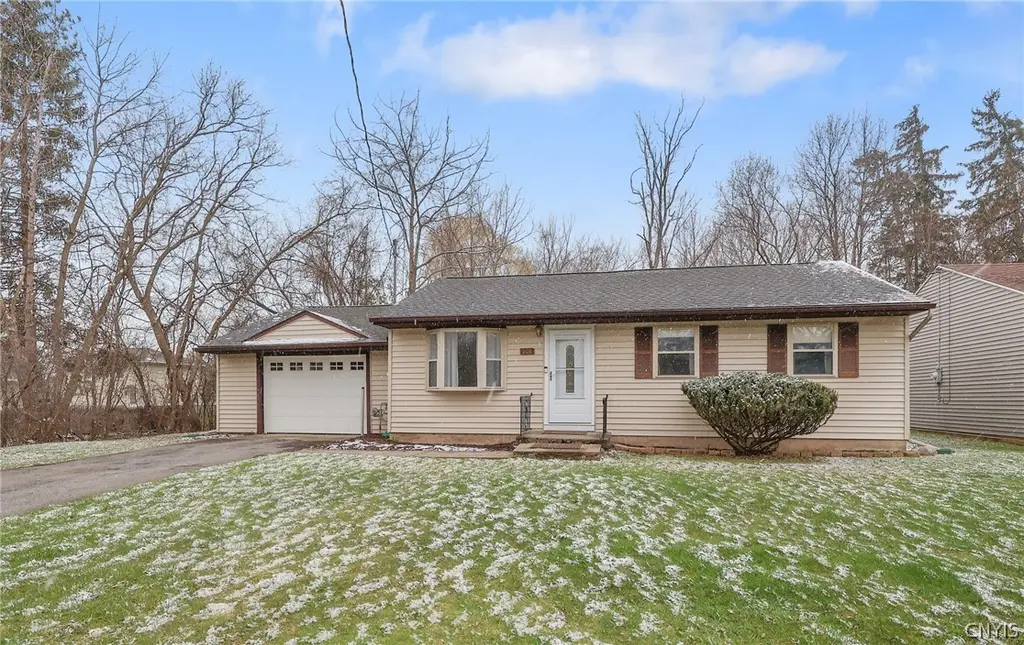
101 2nd St · Fayetteville, NY
Flood risk 1/10 · Minimal
- FEMA flood zone
- X (unshaded)
- Chance of flooding over 30 yrs
- 0.0%
- Est. flood insurance / yr
- $507 – $1,088
Fire risk 1/10 · Minimal
- Est. fire insurance / yr
- $691 – $1,283
Heat risk 3/10 · Minor
- Hot days now (above 95°F)
- 7 days/yr
- Hot days in 30 yrs
- 16 days/yr
Wind risk 1/10 · Minimal
- Chance of severe wind over 30 yrs
- 0.0%
Air-quality risk 2/10 · Minimal
- Unhealthy air days now
- 0 days/yr
- Unhealthy air days in 30 yrs
- 1 days/yr
Risk factors via First Street. Map © Google.
Why this score? — see what drove the C- grade
The composite is a weighted blend of 9 inputs, each scored 0–100. Each bar is that input's sub-score; the figure is the points it added to the 100-point composite (weight × sub-score).
- Cash flow +14.9/30.0
- ARV discount +12.0/15.0
- Schools +7.1/10.0
- 1% rule +5.7/10.0
- DSCR +4.5/10.0
- Livability +4.1/5.0
- Rent growth +2.5/5.0
- Condition / age +2.5/5.0
- Appreciation +0.0/10.0
$199,900
🖨 Deal sheet 📄 Offer letter ✓ Due diligence
Listing remarks
Welcome to this charming and move-in ready 3-bedroom, 1-bath ranch in the Fayetteville-Manlius School District! Enjoy the simplicity of one-floor living with a functional layout and comfortable living spaces throughout! This well-maintained home offers low-maintenance living, making it easy to spend more time doing what you love. The spacious, open living room flows seamlessly into the kitchen, creating a bright and airy feel with plenty of natural light throughout! Conveniently situated near shopping, dining, and everyday amenities, offering easy access to local conveniences. An oversized garage and additional shed provide ample storage space, while the private yard offers a great setting
Key facts
- Ample storage space
- Open living room
- One-floor living
Tags
Property features AI
Exterior
- Parking: Attached garage; Approximately 1.5 garage spaces
- Utilities: Public water (connected); Sewer connected
- Home design: Single-story home; Vinyl siding; Existing construction; Block foundation
- Construction: Vinyl siding exterior; Block foundation
- Exterior features: Blacktop driveway; Rectangular residential lot; 66 x 100 lot dimensions; City street frontage
Interior
- Kitchen: Gas oven; Gas range; Refrigerator
- Bedrooms: 3 main-level bedrooms
- Flooring: Carpet; Varies
- Bathrooms: 1 full bathroom (main level)
- Heating & cooling: Gas forced air heating; Central air conditioning
- Interior features: Eat-in kitchen; Separate/formal living room; Bedroom on main level; Crawl space basement
- Laundry & utility: Gas water heater
Neighborhood map
What this means for you Summary
Snapshot
- This is a 3-bed/1.0-bath single-family listed at $200k.
Deal economics
- At list price, monthly cash flow is $57 ($684/yr) — positive.
- The deal already cash-flows at list — no discount required.
- Meets the 1% rule at list price ($2k rent vs $200k).
- Recommended offer: $197k (1.5% below list) — sets the bar for market timing.
- Cap rate 6.6% vs local median 3.1% in Fayetteville — top-decile yield for the area; either an underpriced asset or a hidden risk that comps aren't pricing in. Stress-test before assuming the spread holds.
Location & tenants
- Location reads 82/100 on livability (#71 in NY, #1,067 nationally) — a professional / high-income tenant draw. Strengths: schools A+, employment A+, housing A+; Watch: amenities D, commute F.
- Fayetteville-Manlius Central School District (suburban): math 79% / reading 81% proficiency, ranked #49 of 590 in NY (top 8%) — strong family-tenant draw, lease renewals of 3-5y typical; only 7% free/reduced lunch — higher-income household profile.
- Market conditions: 65 active listings in the ZIP; 616 units permitted in Onondaga County in 2024 (256 in 5+ unit buildings).
Forward outlook
- Local home prices are declining (-3.0%/yr); year-one equity from $1k of loan paydown is wiped out by about $6k of value loss. Plan a longer hold.
- Onondaga County population projected to shrink 9% by 2050 — rents likely to lag national; underwrite the cash flow, not the appreciation.
Negotiation context
- It's been on market 23 days — a 2% lower offer ($197k) is reasonable based on typical stale-listing flexibility.
Risks & watch-outs
- Watch-outs: property tax is 3.0% of price; built in 1954 — expect roof / HVAC / electrical / plumbing capex.
Questions for the listing agent
- Built in 1954 — when were the roof, HVAC, electrical panel, plumbing, and water heater last replaced?
- Property tax is high relative to price — has the assessment been appealed recently, and will the sale trigger a re-assessment?
- Is there a deadline driving the sale (1031 exchange, divorce, estate, relocation)? That informs how much negotiation room exists.
- Schools are A-rated — typically a magnet for longer-tenancy family renters. What's the average tenant stay here, and is there a school-zone premium baked into asking?
- What's the average days-on-market for RENTAL listings here right now (not sales)? A rising rental-DOM trend means longer vacancies and softer asking-rent achievability than the comps imply.
- What's the recent tenant-quality profile in this submarket — average credit score on applications, eviction rate, late-payment / NSF rate, and stable-employment percentage? A property-management company in the area should have these aggregated.
- How much new for-sale + rental construction is in the pipeline within 1–3 miles? Heavy new supply typically softens prices + rents 12–24 months out; constrained supply supports both.
Investment metrics
- 1% rule
- 1.07% ✓
- Cap rate
- 6.64%
- Cash-on-cash
- 1.22%
- DSCR
- 1.05
- GRM
- 7.8
CMA / ARV
- ARV (on-the-fly)
- $222,176
- Comps found
- 4
Show comp detail 4 sales within ~0.75 mi
| Address | Dist | Beds/Ba | Sqft | Sold | Price | $/sf | Match |
|---|---|---|---|---|---|---|---|
| 101 2nd St | 0.00mi | 3/1.0 | 924 (+9%) | 0mo | $195,000 | $211 | 85 |
| 516 Cleveland Blvd | 0.46mi | 3/1.0 | 903 (+6%) | 17mo | $237,000 | $262 | 54 |
| 420 Cleveland Blvd | 0.38mi | 2/1.0 (-1) | 736 (-13%) | 6mo | $210,000 | $285 | 50 |
| 104 Sims Pl | 0.62mi | 2/1.0 (-1) | 720 (-15%) | 23mo | $171,000 | $238 | 22 |
Match score weights: distance 35% · size 25% · config 20% · recency 20%. Top-matched comps best support the ARV.
Projected returns pro-forma
-3.0% appreciation · 3.0% rent growth · sell at horizon
- IRR
- -14.2%
- Equity multiple
- 0.49×
- Total profit
- $-28,574
- Equity at exit
- $29,806
- IRR
- -5.3%
- Equity multiple
- 0.65×
- Total profit
- $-19,438
- Equity at exit
- $17,284
Cash invested: $55,972 (down + closing). Projections, not guarantees.
Landlord ↔ Tenant lean methodology
- Overall (STATE)
- 15 Strongly Tenant-Friendly
- State New York
- 15 Strongly Tenant-Friendly · D+10
- County
- — inherits STATE
- City
- — inherits STATE
ZIP-level market 13066
- Home prices YoY
- -28.0%
- Active inventory
- 65
- Price-to-rent
- 7.8×
Monthly cashflow live
- Estimated rent
- $2,144 medium interval (Pro) →
- Mortgage (P&I)
- −$1,048
- Tax from tax record
- −$506 /mo · $6,067/yr
- Insurance
- −$83
- HOA
- −$0
- Vacancy / Maint / Mgmt
- −$450
- Net cashflow
- $57
Break-even live
UW: 25.0% down · 7.5% · 30yr · 1.5% tax · 5.0% vac · 8.0% maint · 8.0% mgmt
Financing live
Cash to close
- Down payment
- $49,975
- Closing costs
- $5,997
- Reserves months
- —
- Total cash needed
- —
Loan-product check · same deal, 3 products live
Conventional
25% down · 7.5% · 30yr
- Down + closing
- —
- Monthly P&I
- —
- Monthly cashflow
- —
- DSCR
- —
- Eligible?
- —
Personal DTI + credit; lowest rate.
DSCR
20% down · 8.5% · 30yr
- Down + closing
- —
- Monthly P&I
- —
- Monthly cashflow
- —
- DSCR
- —
- Eligible?
- —
No personal income docs; deal must DSCR.
Hard money
10% down · 12.0% · 12mo
- Down + closing
- —
- Monthly P&I
- —
- Monthly cashflow
- —
- DSCR
- —
- Eligible?
- —
Short-term bridge; refi at stabilization.
Listing history 3 events
-
2026-05-02status Pending
-
2026-04-14historical Active Under Contract
-
2026-04-09$199,900 Active
ⓘ Source: listings_history table (triggers on properties + properties_extension) + one-shot
backfill from property_details.listing_events for pre-trigger history.
Tax reassessment forecast NY · Partial reset (capped growth)
- Current annual tax
- $6,067 · $506/mo
- Projected year-2 tax
- $6,067 · $506/mo
- Expected delta
- $0/yr ($0/mo · 0.0%)
ⓘ Screening estimate from a state-policy table — verify with the county assessor before closing.
Climate risk First Street
- Flood 1/10 Low FEMA zone X (unshaded) · 0% chance over 30 yrs
- Wildfire 1/10 Low
- Heat 3/10 Moderate 7 d/yr ≥95°F today · 16 d/yr by 30 yrs out
- Wind 1/10 Low 0% chance of damaging wind over 30 yrs
- Air quality 2/10 Low 0 unhealthy d/yr today · 1 by 30 yrs out
Nearby sold comps map
Loading sold comps map…
Walkable amenities ~0.75 mi
Loading nearby amenities…
Taxation est. · year 1
- Rental income
- $25,734
- − Mortgage interest
- −$11,198
- − Property taxes
- −$6,067
- − Insurance
- −$1,000
- − Repairs & maintenance
- −$2,059
- − Management
- −$2,059
- − Depreciation
- −$5,815
- Taxable loss
- −$2,463
- Est. tax savings @ 24.0%
- +$591
- After-tax cash flow
- $1,275/yr
For passive investors: Depreciation is non-cash, so a rental often shows a tax loss while cash-flowing — sheltering income. Rental losses are passive: they offset passive income freely, and up to $25,000/yr can offset ordinary (W-2) income if you actively participate and your MAGI is under $100k (phasing out to $0 by $150k); unused losses carry forward. On sale, claimed depreciation is recaptured at up to 25%, and gains may owe capital-gains tax (a 1031 exchange can defer both). Figures are a year-1 estimate at your 24.0% rate — not tax advice; consult a CPA.
Schools (NCES district)
- District
- Fayetteville-Manlius Central School District
- NCES district ID
- 3618330
- Math proficiency
- 79% ▼ -5.00%
- Reading proficiency
- 81% ▲ 7.00%
- Median HH income
- $86,156
- Composite
- 71.12/100
- National rank
- #238
- State rank
- #49 of 590 in NY
Livability — Fayetteville
- Score
- 82/100
- State rank
- #71
- US rank
- #1067
Category grades
Schools grade is shown separately in the Schools card above.
Census & demographics
- City population
- 12,680
- Population (ZIP)
- 12,680
Population outlook (Onondaga County) Hauer SSP2
- Today (2025)
- 467,894 people
- By 2030
- 463,381 · -1.0%
- By 2040
- 447,697 · -4.3%
- By 2050
- 426,399 · -8.9%
- By 2075
- 373,661 · -20.1%
- By 2100
- 307,967 · -34.2%
Race, ethnicity, and origin ACS 2023
- Neighborhood character
- Predominantly White (88%)
- Race & ethnicity
- White 88% Two or more races 4% Hispanic / Latino 3% Asian 3% Black 2%
- Common ancestry
- Romanian 5% Scotch-Irish 3% Lithuanian 3%
- Foreign-born
- 7% · Canada, China
- Languages at home
- 92% English-only · Other Indo-European 2% Chinese 2% Spanish 1%
Political lean MEDSL · Onondaga
- 2024 margin
- D (+17.3) · D 58.6% · R 41.4%
- 2008→2024 swing
- -3.0pp toward R · 2008: 20.3pp · 2024: 17.3pp
- All cycles
- 2024: D+17.3 2020: D+20.6 2016: D+12.8 2012: D+21.1 2008: D+20.3
Not yet ingested
- Civics
- —
Market trends
- HPI YoY
- ▼ -124.65%
- Current HPI
- 319.9702
- Rent YoY
- —
- Metro
- —
- State GDP YoY
- ▲ 2.60%
- F500 in state
- 92
Industry mix (Fortune 500 HQ in NY)
| Industry | F500 HQs | Revenue |
|---|---|---|
| Financial Services | 10 | $950B |
|
||
| Consumer Goods | 9 | $162B |
|
||
| Insurance | 4 | $225B |
|
||
| Telecommunications | 2 | $144B |
|
||
| Pharmaceuticals | 2 | $112B |
|
||
| Media / Entertainment | 2 | $69B |
|
||
Price history
3 events — show timeline
- 2026-05-02 Pending — CNYIS
- 2026-04-14 Contingent — CNYIS
- 2026-04-09 Listed $199,900 CNYIS
Property tax history
+6.9%/yrLatest (2025): $6,067 · +3.0% YoY. Source: county tax records.
Cash-flow waterfall
monthlySold comps — $/sqft
last 12 mo · ≤1 miLoading sold comps…