 🏗️ New Construction
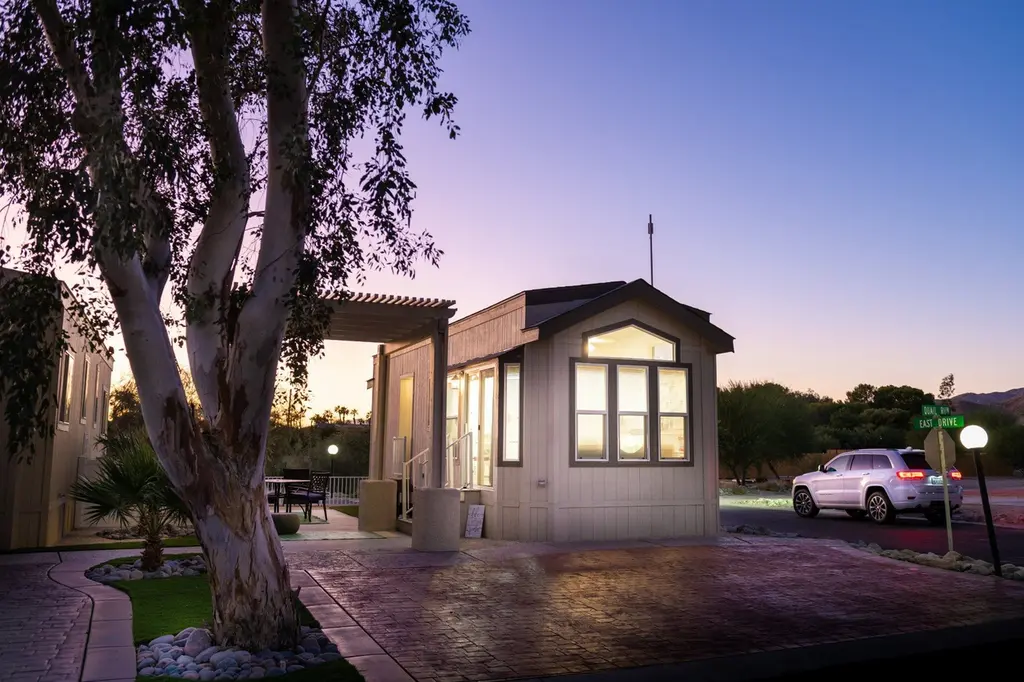
The Casita Sky Valley Plan · Sky Valley, CA
Flood risk 1/10 · Minimal
- FEMA flood zone
- D
- Chance of flooding over 30 yrs
- 0.0%
- Est. flood insurance / yr
- $544 – $1,084
Fire risk 3/10 · Minor
- Est. fire insurance / yr
- $659 – $1,223
Heat risk 8/10 · Major
- Hot days now (above 111°F)
- 7 days/yr
- Hot days in 30 yrs
- 20 days/yr
Wind risk 1/10 · Minimal
- Chance of severe wind over 30 yrs
- —
Air-quality risk 5/10 · Moderate
- Unhealthy air days now
- 6 days/yr
- Unhealthy air days in 30 yrs
- 8 days/yr
Risk factors via First Street. Map © Google.
Why this score? — see what drove the B- grade
The composite is a weighted blend of 9 inputs, each scored 0–100. Each bar is that input's sub-score; the figure is the points it added to the 100-point composite (weight × sub-score).
- Cash flow +30.0/30.0
- 1% rule +10.0/10.0
- DSCR +10.0/10.0
- ARV discount +7.5/15.0
- Schools +2.7/10.0
- Livability +2.6/5.0
- Rent growth +2.5/5.0
- Condition / age +1.0/5.0
- Appreciation +0.0/10.0
$82,900
🖨 Deal sheet 📄 Offer letter ✓ Due diligence
Listing remarks MLS
Well-designed, efficient, and virtually maintenance-free — the perfect home for weekenders, snowbirds, or year-round residents who want to make the most of their time in the desert. There are three-floor plan options with this home as well. With this floor-plan there is an option to add an additional California room for additional living space. This is a custom order home and we may not have a model home on site. Contact us to find out more! Some standard and upgraded options include: CASITA HOME STANDARD & UPGRADED FEATURES: -Bay window in the master bedroom -Stainless steel appliances -Solatubes -Window and flooring upgrades -Cabinet and hardware options -Mirrored wardrobe doors
Key facts
- Listed 611 days
Neighborhood map
What this means for you Summary
Snapshot
- This is a 1-bed/1.0-bath manufactured listed at $83k. Condition is rated poor.
Deal economics
- At list price, monthly cash flow is $721 ($9k/yr) — positive.
- The deal already cash-flows at list — no discount required.
- Meets the 1% rule at list price ($1k rent vs $83k).
- Recommended offer: $73k (12.0% below list) — sets the bar for market timing.
- Cap rate 25.8% vs local median 9.6% in Sky Valley — top-decile yield for the area; either an underpriced asset or a hidden risk that comps aren't pricing in. Stress-test before assuming the spread holds.
Location & tenants
- Location reads 52/100 on livability (#1,041 in CA) — a working-class tenant base; expect higher turnover. Strengths: housing A; Watch: schools F, amenities F, commute F.
- Palm Springs Unified (suburban): math 21% / reading 42% proficiency, ranked #328 of 517 in CA (top 63%) — families likely to look elsewhere, expect single-tenant / working-renter base with shorter leases; 73% free/reduced lunch — lower-income household profile, screen leases tightly.
- Market conditions: 216 active listings in the ZIP; 9,195 units permitted in Riverside County in 2024 (1,512 in 5+ unit buildings).
Forward outlook
- Local home prices are declining (-3.0%/yr); year-one equity from $307 of loan paydown is wiped out by about $1k of value loss. Plan a longer hold.
- Riverside County population projected at +22% by 2050 — long-run rental-demand tailwind backs the buy-and-hold thesis.
- At projected returns (-3.0% appreciation + 3.0% rent growth), your $12k cash investment doubles in ~2 years — after that, you're playing with house money.
Negotiation context
- It's been on market 612 days — a 12% lower offer ($73k) is reasonable based on typical stale-listing flexibility.
Risks & watch-outs
- Climate carrying-cost: extreme-heat days projected 7→20/yr by 2055 (HVAC capex compounding) — expect insurance premiums to compound above CPI over the hold.
Questions for the listing agent
- It's been on market 612 days. Have you received any prior offers? Is the seller open to a 12% concession, seller financing, or rate buy-down credit?
- Have any recent inspections been done? Can we get a copy of the seller's disclosures and any deferred-maintenance estimates?
- Why hasn't it sold? Are there any deal-killer items the seller is aware of (foundation, flood, title, zoning, code violations)?
- Is there a deadline driving the sale (1031 exchange, divorce, estate, relocation)? That informs how much negotiation room exists.
- Schools are F-rated, which usually means shorter tenancies and higher turnover. Who's the typical renter profile here, and what's been the actual vacancy rate?
- What's the average days-on-market for RENTAL listings here right now (not sales)? A rising rental-DOM trend means longer vacancies and softer asking-rent achievability than the comps imply.
- What's the recent tenant-quality profile in this submarket — average credit score on applications, eviction rate, late-payment / NSF rate, and stable-employment percentage? A property-management company in the area should have these aggregated.
- How much new for-sale + rental construction is in the pipeline within 1–3 miles? Heavy new supply typically softens prices + rents 12–24 months out; constrained supply supports both.
Investment metrics
- 1% rule
- 2.93% ✓
- Cap rate
- 25.82%
- Cash-on-cash
- 69.72%
- DSCR
- 4.10
- GRM
- 2.8
CMA / ARV
- ARV (median comp)
- $44,334
- List price
- $82,900
- Delta
- 86.99%
- Verdict
- OVERPRICED
- Comps
- 13 within 1.0 mi
Show comp detail 12 sales within ~0.75 mi
| Address | Dist | Beds/Ba | Sqft | Sold | Price | $/sf | Match |
|---|---|---|---|---|---|---|---|
| 74711 Dillon Rd #819 | 0.00mi | 1/1.0 | 399 (-0%) | 0mo | $37,000 | $93 | 99 |
| 74711 Dillon Rd Spc 1023 | 0.00mi | 1/1.0 | 399 (-0%) | 4mo | $36,000 | $90 | 96 |
| 74711 Dillon Rd Spc 64 | 0.00mi | 1/1.0 | 399 (-0%) | 5mo | $48,500 | $122 | 96 |
| 74711 Dillon Rd #271 | 0.00mi | 1/1.0 | 399 (-0%) | 6mo | $67,000 | $168 | 95 |
| 74711 Dillon Rd #709 | 0.00mi | 1/1.0 | 399 (-0%) | 6mo | $45,000 | $113 | 94 |
| 74711 Dillon Rd Spc 114 | 0.00mi | 1/1.0 | 399 (-0%) | 9mo | $62,000 | $155 | 92 |
| 74711 Dillon Rd Spc 126 | 0.00mi | 1/1.0 | 399 (-0%) | 10mo | $53,000 | $133 | 92 |
| 74711 Dillon Rd #1007 | 0.00mi | 1/1.0 | 399 (-0%) | 10mo | $60,000 | $150 | 91 |
| 74711 Dillon Rd #884 | 0.00mi | 1/1.0 | 399 (-0%) | 10mo | $37,000 | $93 | 91 |
| 74711 Dillon Rd #247 | 0.16mi | 1/1.0 | 399 (-0%) | 2mo | $48,000 | $120 | 90 |
| 74711 Dillon Rd #878 | 0.16mi | 1/1.0 | 399 (-0%) | 9mo | $28,000 | $70 | 85 |
| 74711 Dillon Rd Spc 746 | 0.17mi | 1/1.0 | 399 (-0%) | 10mo | $34,000 | $85 | 83 |
Match score weights: distance 35% · size 25% · config 20% · recency 20%. Top-matched comps best support the ARV.
Projected returns pro-forma
-3.0% appreciation · 3.0% rent growth · sell at horizon
- IRR
- 69.2%
- Equity multiple
- 4.12×
- Total profit
- $38,773
- Equity at exit
- $6,610
- IRR
- 73.3%
- Equity multiple
- 8.49×
- Total profit
- $92,995
- Equity at exit
- $3,833
Cash invested: $12,414 (down + closing). Projections, not guarantees.
Landlord ↔ Tenant lean methodology
- Overall (STATE)
- 18 Strongly Tenant-Friendly
- State California
- 18 Strongly Tenant-Friendly · D+13
- County
- — inherits STATE
- City
- — inherits STATE
ZIP-level market 92241
- Home prices YoY
- -22.8%
- Active inventory
- 216
- Price-to-rent
- 5.3×
Monthly cashflow live
- Estimated rent
- $1,301 medium interval (Pro) →
- Mortgage (P&I)
- −$232
- Tax est. 1.5%
- −$55 /mo · $665/yr
- Insurance
- −$18
- HOA
- −$0
- Vacancy / Maint / Mgmt
- −$273
- Net cashflow
- $721
Break-even live
UW: 25.0% down · 7.5% · 30yr · 1.5% tax · 5.0% vac · 8.0% maint · 8.0% mgmt
Financing live
Cash to close
- Down payment
- $11,084
- Closing costs
- $1,330
- Reserves months
- —
- Total cash needed
- —
Loan-product check · same deal, 3 products live
Conventional
25% down · 7.5% · 30yr
- Down + closing
- —
- Monthly P&I
- —
- Monthly cashflow
- —
- DSCR
- —
- Eligible?
- —
Personal DTI + credit; lowest rate.
DSCR
20% down · 8.5% · 30yr
- Down + closing
- —
- Monthly P&I
- —
- Monthly cashflow
- —
- DSCR
- —
- Eligible?
- —
No personal income docs; deal must DSCR.
Hard money
10% down · 12.0% · 12mo
- Down + closing
- —
- Monthly P&I
- —
- Monthly cashflow
- —
- DSCR
- —
- Eligible?
- —
Short-term bridge; refi at stabilization.
Listing history 15 events
-
2026-06-18days on market $82,900 Active 612 DOM
-
2026-06-17days on market $82,900 Active 611 DOM
-
2026-06-16days on market $82,900 Active 610 DOM
-
2026-06-15days on market $82,900 Active 609 DOM
-
2026-06-13days on market $82,900 Active 607 DOM
-
2026-06-13days on market $82,900 Active 606 DOM
-
2026-06-09days on market $82,900 Active 603 DOM
-
2026-06-08days on market $82,900 Active 602 DOM
-
2026-06-07days on market $82,900 Active 601 DOM
-
2026-06-04days on market $82,900 Active 598 DOM
-
2026-06-03days on market $82,900 Active 597 DOM
-
2026-06-02days on market $82,900 Active 596 DOM
-
2026-06-01days on market $82,900 Active 595 DOM
-
2026-05-31days on market $82,900 Active 594 DOM
-
2024-10-14$82,900 Active 706-char remark
Show marketing remark (706 chars)
Well-designed, efficient, and virtually maintenance-free — the perfect home for weekenders, snowbirds, or year-round residents who want to make the most of their time in the desert. There are three-floor plan options with this home as well. With this floor-plan there is an option to add an additional California room for additional living space. This is a custom order home and we may not have a model home on site. Contact us to find out more! Some standard and upgraded options include: CASITA HOME STANDARD & UPGRADED FEATURES: -Bay window in the master bedroom -Stainless steel appliances -Solatubes -Window and flooring upgrades -Cabinet and hardware options -Mirrored wardrobe doors
ⓘ Source: listings_history table (triggers on properties + properties_extension) + one-shot
backfill from property_details.listing_events for pre-trigger history.
Climate risk First Street
- Flood 1/10 Low FEMA zone D · 0% chance over 30 yrs
- Wildfire 3/10 Moderate
- Heat 8/10 Severe 7 d/yr ≥111°F today · 20 d/yr by 30 yrs out
- Wind 1/10 Low
- Air quality 5/10 Major 6 unhealthy d/yr today · 8 by 30 yrs out
Nearby sold comps map
Loading sold comps map…
Walkable amenities ~0.75 mi
Loading nearby amenities…
Taxation est. · year 1
- Rental income
- $15,610
- − Mortgage interest
- −$2,483
- − Property taxes
- −$665
- − Insurance
- −$222
- − Repairs & maintenance
- −$1,249
- − Management
- −$1,249
- − Depreciation
- −$1,290
- Taxable income
- $8,452
- Est. tax owed @ 24.0%
- −$2,029
- After-tax cash flow
- $6,627/yr
For passive investors: Depreciation is non-cash, so a rental often shows a tax loss while cash-flowing — sheltering income. Rental losses are passive: they offset passive income freely, and up to $25,000/yr can offset ordinary (W-2) income if you actively participate and your MAGI is under $100k (phasing out to $0 by $150k); unused losses carry forward. On sale, claimed depreciation is recaptured at up to 25%, and gains may owe capital-gains tax (a 1031 exchange can defer both). Figures are a year-1 estimate at your 24.0% rate — not tax advice; consult a CPA.
Condition & rehab AI · 1 photo
This manufactured home requires extensive repairs and updates to its exterior, roof, HVAC, windows, and landscaping to improve its condition and value.
Repairs flagged
- Major exterior siding — Significant wear and tear
- Major roof — No visible damage, but not inspected
- Major HVAC/mechanicals — No visible HVAC/mechanicals, but not inspected
- Major windows — No visible windows, but not inspected
- Major foundation/structure — No visible foundation/structure, but not inspected
- Major landscaping/curb appeal — No visible landscaping/curb appeal, but not inspected
Value-add opportunities
- Both exterior siding repair — Improves curb appeal and structural integrity
- Both roof repair — Essential for structural integrity and water resistance
- Both HVAC/mechanicals upgrade — Enhances comfort and energy efficiency
- Both windows replacement — Improves energy efficiency and security
- Both landscaping and curb appeal — Enhances curb appeal and property value
Renovation cost estimate screening
| Repair item | Severity | Est. cost |
|---|---|---|
| exterior siding · Significant wear and tear | Major | $15,000–50,000 |
| roof · No visible damage, but not inspected | Major | $15,000–50,000 |
| HVAC/mechanicals · No visible HVAC/mechanicals, but not inspected | Major | $15,000–50,000 |
| windows · No visible windows, but not inspected | Major | $15,000–50,000 |
| foundation/structure · No visible foundation/structure, but not inspected | Major | $15,000–50,000 |
| landscaping/curb appeal · No visible landscaping/curb appeal, but not inspected | Major | $15,000–50,000 |
| Total estimated repair cost · 6 items | $90,000–300,000 |
Value-add ROI direction
- Both exterior siding repair — Improves curb appeal and structural integrity ↑
- Both roof repair — Essential for structural integrity and water resistance ↑
- Both HVAC/mechanicals upgrade — Enhances comfort and energy efficiency ↑
- Both windows replacement — Improves energy efficiency and security ↑
- Both landscaping and curb appeal — Enhances curb appeal and property value ↑
ⓘ Cost ranges are severity-bucket heuristics (US national rule-of-thumb). Get contractor quotes + a written scope before underwriting a rehab budget.
Schools (NCES district)
- District
- Palm Springs Unified
- NCES district ID
- 0629550
- Math proficiency
- 21% ▼ -7.00%
- Reading proficiency
- 42% ▬ 0.00%
- Median HH income
- $43,638
- Composite
- 26.76/100
- National rank
- #7131
- State rank
- #328 of 517 in CA
Livability — Sky Valley
- Score
- 52/100
- State rank
- #1041
- US rank
- #25108
Category grades
Schools grade is shown separately in the Schools card above.
Census & demographics
- Census place
- Sky Valley, CA
- Population (ZIP)
- 8,624
Population outlook (Riverside County) Hauer SSP2
- Today (2025)
- 2,664,475 people
- By 2030
- 2,802,692 · +5.2%
- By 2040
- 3,050,904 · +14.5%
- By 2050
- 3,256,783 · +22.2%
- By 2075
- 3,655,058 · +37.2%
- By 2100
- 3,766,594 · +41.4%
Race, ethnicity, and origin ACS 2023
- Race & ethnicity
- White 50% Hispanic / Latino 46% Two or more races 16% Asian 2% Native American 1%
- Hispanic origin (detail)
- Mexican 36%
- Common ancestry
- Lithuanian 3% Slovak 2% Portuguese 2%
- Foreign-born
- 28% · Canada, South Korea
- Languages at home
- 57% English-only · Spanish 38% Chinese 1% Russian/Polish/Slavic 1%
Political lean MEDSL · Riverside
- 2024 margin
- Toss-up / Even · D 48.0% · R 49.3% · Other 2.6%
- 2008→2024 swing
- -3.6pp toward R · 2008: 2.3pp · 2024: -1.3pp
- All cycles
- 2024: R+1.3 2020: D+8.0 2016: D+4.3 2012: R+0.4 2008: D+2.3
Not yet ingested
- Civics
- —
Market trends
- HPI YoY
- ▼ -118.23%
- Current HPI
- 400.5663
- Rent YoY
- —
- Metro
- —
- State GDP YoY
- ▲ 3.21%
- F500 in state
- 116
Industry mix (Fortune 500 HQ in CA)
| Industry | F500 HQs | Revenue |
|---|---|---|
| Technology | 27 | $1,492B |
|
||
| Financial Services | 3 | $174B |
|
||
| Retail | 3 | $44B |
|
||
| Insurance | 3 | $26B |
|
||
| Media / Entertainment | 2 | $115B |
|
||
| Pharmaceuticals / Biotech | 2 | $62B |
|
||
Price history
1 event — show timeline
- 2024-10-14 Listed $82,900 Zillow
Cash-flow waterfall
monthlySold comps — $/sqft
last 12 mo · ≤1 miLoading sold comps…