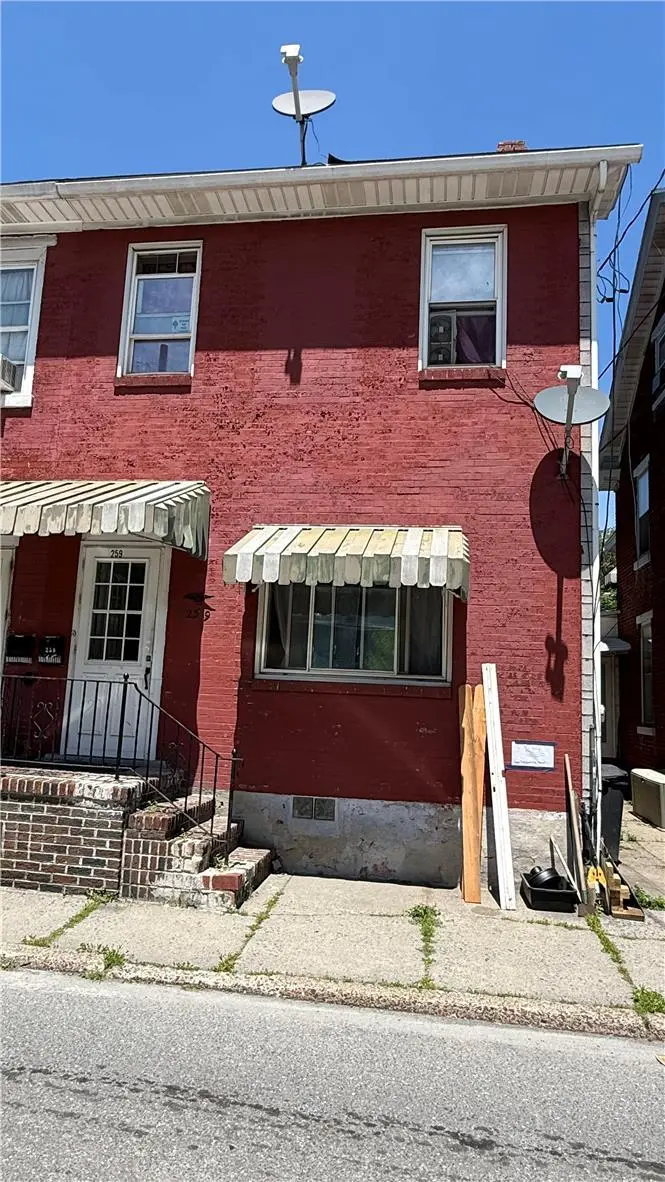
259 W Rowe · Tamaqua, PA
Flood risk 9/10 · Severe
- FEMA flood zone
- AE
- Chance of flooding over 30 yrs
- 0.99%
- Est. flood insurance / yr
- $2,026 – $9,024
Fire risk 3/10 · Minor
- Est. fire insurance / yr
- $511 – $949
Heat risk 4/10 · Minor
- Hot days now (above 95°F)
- 8 days/yr
- Hot days in 30 yrs
- 17 days/yr
Wind risk 4/10 · Minor
- Chance of severe wind over 30 yrs
- 8.0%
Air-quality risk 2/10 · Minimal
- Unhealthy air days now
- 1 days/yr
- Unhealthy air days in 30 yrs
- 2 days/yr
Risk factors via First Street. Map © Google.
Why this score? — see what drove the B+ grade
The composite is a weighted blend of 9 inputs, each scored 0–100. Each bar is that input's sub-score; the figure is the points it added to the 100-point composite (weight × sub-score).
- Cash flow +30.0/30.0
- ARV discount +15.0/15.0
- 1% rule +10.0/10.0
- DSCR +10.0/10.0
- Livability +4.0/5.0
- Schools +3.6/10.0
- Rent growth +2.5/5.0
- Condition / age +2.5/5.0
- Appreciation +0.0/10.0
$85,000
🖨 Deal sheet 📄 Offer letter ✓ Due diligence
Listing remarks MLS
NICE BRICK TWIN WITH NICE SIZE ROOMS, MODERN BATH, CEDAR LINED CLOSET IN MASTER BEDROOM, NEWER REPLACEMENT WINDOWS, NEWER ROOF, THIRD FLOOR COULD BE USED AS THIRD BEDROOM. LARGE YARD. CLOSE TO DOWNTOWN AND SCHOOLS. Amp: 100
Key facts
- Historic tamaqua
- Fenced-in yard
- Built 1900
Tags
Property features AI
Exterior
- Parking: On-street parking
- Utilities: Public water; Public sewer; Electric service with 100 amps and circuit breakers
- Home design: Two-story property; Brick construction; Asphalt/fiberglass roof
- Construction: Brick construction; Asphalt/fiberglass roof
- Exterior features: Residential zoning; Property has a view; Lot dimensions approximately 22 x 130
Interior
- Kitchen: Kitchen on first level (approx. 15.0 x 12.0); Electric water heater
- Bedrooms: Bedroom on third level (approx. 17.0 x 13.0); Bedroom on second level (approx. 10.0 x 13.0); Bedroom on second level (approx. 13.0 x 16.0)
- Flooring: Carpet; Ceramic tile; Laminate; Resilient flooring
- Bathrooms: One full bathroom (second level, approx. 11.0 x 9.0)
- Heating & cooling: Baseboard heating (oil); Wall cooling unit(s)
- Interior features: Dining area and separate/formal dining room; Partially finished basement
- Laundry & utility: Laundry room on second level (approx. 5.0 x 10.5); Washer hookup, Dryer hookup
Neighborhood map
What this means for you Summary
Snapshot
- This is a 3-bed/1.0-bath townhouse listed at $85k.
Deal economics
- At list price, monthly cash flow is $55 ($660/yr) — positive.
- The deal already cash-flows at list — no discount required.
- Meets the 1% rule at list price ($1k rent vs $85k).
- Cap rate 13.6% vs local median 6.8% in Tamaqua — top-decile yield for the area; either an underpriced asset or a hidden risk that comps aren't pricing in. Stress-test before assuming the spread holds.
Location & tenants
- Location reads 80/100 on livability (#209 in PA, #1,844 nationally) — a professional / high-income tenant draw. Strengths: amenities A+, cost of living A+, housing A+; Watch: commute D+, employment F.
- Tamaqua Area SD (rural): math 31% / reading 53% proficiency, ranked #331 of 539 in PA (top 61%) — families likely to look elsewhere, expect single-tenant / working-renter base with shorter leases.
- Market conditions: 75 active listings in the ZIP; 2 comparable units currently listed for rent nearby; 169 units permitted in Schuylkill County in 2024 (0 in 5+ unit buildings).
Forward outlook
- Local home prices are declining (-3.0%/yr); year-one equity from $588 of loan paydown is wiped out by about $3k of value loss. Plan a longer hold.
- Schuylkill County population projected at -16% by 2050 — secular population decline; favor cash flow + early exit over multi-decade hold.
Negotiation context
- Only 13 days on market — expect competitive offers; lowballing is unlikely to land.
- 3 sale attempts since 21y ago; this cycle's ask has dropped $12k (13%) from the opening price — seller is motivated, your offer sets the floor, not the list.
- Current owner paid $18k; list at $85k implies a 386% gain — meaningful room to come down on a strong offer.
Risks & watch-outs
- Watch-outs: flood insurance adds $460/mo; built in 1900 — expect roof / HVAC / electrical / plumbing capex.
- Climate carrying-cost: in FEMA flood zone AE (mandatory federal flood insurance) — expect insurance premiums to compound above CPI over the hold.
Questions for the listing agent
- Built in 1900 — when were the roof, HVAC, electrical panel, plumbing, and water heater last replaced?
- What's the actual annual flood-insurance premium (NFIP or private), and is the property in a SFHA with mandatory coverage?
- Is there a deadline driving the sale (1031 exchange, divorce, estate, relocation)? That informs how much negotiation room exists.
- What's the average days-on-market for RENTAL listings here right now (not sales)? A rising rental-DOM trend means longer vacancies and softer asking-rent achievability than the comps imply.
- What's the recent tenant-quality profile in this submarket — average credit score on applications, eviction rate, late-payment / NSF rate, and stable-employment percentage? A property-management company in the area should have these aggregated.
- How much new for-sale + rental construction is in the pipeline within 1–3 miles? Heavy new supply typically softens prices + rents 12–24 months out; constrained supply supports both.
Investment metrics
- 1% rule
- 1.64% ✓
- Cap rate
- 13.57%
- Cash-on-cash
- 25.99%
- DSCR
- 2.16
- GRM
- 5.1
CMA / ARV
- ARV (on-the-fly)
- $114,680
- Comps found
- 12
Show comp detail 12 sales within ~0.75 mi
| Address | Dist | Beds/Ba | Sqft | Sold | Price | $/sf | Match |
|---|---|---|---|---|---|---|---|
| 299 High St | 0.15mi | 4/1.0 (+1) | 1,829 (-3%) | 8mo | $62,000 | $34 | 77 |
| 297 High St | 0.15mi | 3/1.5 | 2,018 (+7%) | 8mo | $88,000 | $44 | 72 |
| 254 Mahanoy St | 0.13mi | 4/1.0 (+1) | 1,740 (-7%) | 14mo | $74,500 | $43 | 65 |
| 267 Clay St | 0.10mi | 4/2.0 (+1) | 1,700 (-10%) | 13mo | $145,000 | $85 | 60 |
| 119 Hunter St | 0.32mi | 4/2.0 (+1) | 1,740 (-7%) | 14mo | $160,000 | $92 | 52 |
| 341 Hazle St | 0.62mi | 4/2.0 (+1) | 1,858 (-1%) | 12mo | $199,900 | $108 | 50 |
| 355 W Willing St | 0.68mi | 4/2.0 (+1) | 1,843 (-2%) | 9mo | $112,000 | $61 | 48 |
| 333 Willing St | 0.64mi | 3/1.0 | 1,624 (-14%) | 6mo | $90,000 | $55 | 42 |
| 404 Arlington St | 0.68mi | 3/1.0 | 1,654 (-12%) | 8mo | $80,000 | $48 | 42 |
| 404-1/2 Arlington St | 0.68mi | 3/1.0 | 1,654 (-12%) | 9mo | $80,000 | $48 | 41 |
| 304 Arlington St | 0.60mi | 3/1.5 | 2,136 (+14%) | 14mo | $132,000 | $62 | 36 |
| 321 Willing St | 0.62mi | 4/1.5 (+1) | 1,619 (-14%) | 16mo | $145,000 | $90 | 28 |
Match score weights: distance 35% · size 25% · config 20% · recency 20%. Top-matched comps best support the ARV.
Projected returns pro-forma
-3.0% appreciation · 3.0% rent growth · sell at horizon
- IRR
- -11.5%
- Equity multiple
- 0.58×
- Total profit
- $-9,969
- Equity at exit
- $12,674
- IRR
- -1.8%
- Equity multiple
- 0.88×
- Total profit
- $-2,939
- Equity at exit
- $7,349
Cash invested: $23,800 (down + closing). Projections, not guarantees.
Landlord ↔ Tenant lean methodology
- Overall (STATE)
- 62 Landlord-Friendly
- State Pennsylvania
- 62 Landlord-Friendly · EVEN
- County
- — inherits STATE
- City
- — inherits STATE
ZIP-level market 18252
- Home prices YoY
- -15.4%
- Active inventory
- 75
- Price-to-rent
- 5.1×
Monthly cashflow live
- Estimated rent
- $1,396 medium interval (Pro) →
- Mortgage (P&I)
- −$446
- Tax est. 1.5%
- −$106 /mo · $1,275/yr
- Insurance
- −$35
- Flood insurance flood zone
- −$460 /mo · $5,525/yr
- HOA
- −$0
- Vacancy / Maint / Mgmt
- −$293
- Net cashflow
- $55
Break-even live
UW: 25.0% down · 7.5% · 30yr · 1.5% tax · 5.0% vac · 8.0% maint · 8.0% mgmt
Financing live
Cash to close
- Down payment
- $21,250
- Closing costs
- $2,550
- Reserves months
- —
- Total cash needed
- —
Loan-product check · same deal, 3 products live
Conventional
25% down · 7.5% · 30yr
- Down + closing
- —
- Monthly P&I
- —
- Monthly cashflow
- —
- DSCR
- —
- Eligible?
- —
Personal DTI + credit; lowest rate.
DSCR
20% down · 8.5% · 30yr
- Down + closing
- —
- Monthly P&I
- —
- Monthly cashflow
- —
- DSCR
- —
- Eligible?
- —
No personal income docs; deal must DSCR.
Hard money
10% down · 12.0% · 12mo
- Down + closing
- —
- Monthly P&I
- —
- Monthly cashflow
- —
- DSCR
- —
- Eligible?
- —
Short-term bridge; refi at stabilization.
Rent comps 2 comps
| Address | Beds | Baths | Sqft | Rent | $/sqft | DOM | Units | Dist |
|---|---|---|---|---|---|---|---|---|
| 128 E Broad St Unit 128B Tamaqua, PA | 3.0 | 1.0 | 1623 | $1,450 | $0.89 | 43d | 1 | 0.35mi |
| 435 E Union St Tamaqua, PA | 3.0 | 1.0 | 1560 | $1,275 | $0.82 | 14d | 1 | 0.74mi |
Listing history 11 events
-
2026-06-18days on market $85,000 Active 13 DOM
-
2026-06-17days on market $85,000 Active 12 DOM
-
2026-06-16days on market $85,000 Active 11 DOM
-
2026-06-15days on market $85,000 Active 10 DOM
-
2026-06-13days on market $85,000 Active 8 DOM
-
2026-06-12pricedays on market $85,000 Active 7 DOM
-
2026-06-09days on market $97,500 Active 4 DOM
-
2026-06-08days on market $97,500 Active 3 DOM
-
2026-06-08days on market $97,500 Active 2 DOM
-
2026-06-07remarks 660-char remark
-
2026-06-07$97,500 Active 1 DOM
ⓘ Source: listings_history table (triggers on properties + properties_extension) + one-shot
backfill from property_details.listing_events for pre-trigger history.
Climate risk First Street
- Flood 9/10 Extreme FEMA zone AE · 99% chance over 30 yrs
- Wildfire 3/10 Moderate
- Heat 4/10 Moderate 8 d/yr ≥95°F today · 17 d/yr by 30 yrs out
- Wind 4/10 Moderate 8% chance of damaging wind over 30 yrs
- Air quality 2/10 Low 1 unhealthy d/yr today · 2 by 30 yrs out
Nearby sold comps map
Loading sold comps map…
Walkable amenities ~0.75 mi
Loading nearby amenities…
Taxation est. · year 1
- Rental income
- $16,751
- − Mortgage interest
- −$4,761
- − Property taxes
- −$1,275
- − Insurance
- −$5,950
- − Repairs & maintenance
- −$1,340
- − Management
- −$1,340
- − Depreciation
- −$2,473
- Taxable loss
- −$388
- Est. tax savings @ 24.0%
- +$93
- After-tax cash flow
- $753/yr
For passive investors: Depreciation is non-cash, so a rental often shows a tax loss while cash-flowing — sheltering income. Rental losses are passive: they offset passive income freely, and up to $25,000/yr can offset ordinary (W-2) income if you actively participate and your MAGI is under $100k (phasing out to $0 by $150k); unused losses carry forward. On sale, claimed depreciation is recaptured at up to 25%, and gains may owe capital-gains tax (a 1031 exchange can defer both). Figures are a year-1 estimate at your 24.0% rate — not tax advice; consult a CPA.
Schools (NCES district)
- District
- Tamaqua Area SD
- NCES district ID
- 4223220
- Math proficiency
- 31% ▼ -9.00%
- Reading proficiency
- 53% ▼ -8.00%
- Median HH income
- $45,184
- Composite
- 35.61/100
- National rank
- #4893
- State rank
- #331 of 539 in PA
Livability — Tamaqua
- Score
- 80/100
- State rank
- #209
- US rank
- #1844
Category grades
Schools grade is shown separately in the Schools card above.
Census & demographics
- Census place
- Tamaqua, PA
- Population (ZIP)
- 11,065
Population outlook (Schuylkill County) Hauer SSP2
- Today (2025)
- 137,447 people
- By 2030
- 133,121 · -3.1%
- By 2040
- 124,172 · -9.7%
- By 2050
- 115,611 · -15.9%
- By 2075
- 100,796 · -26.7%
- By 2100
- 86,667 · -36.9%
Race, ethnicity, and origin ACS 2023
- Neighborhood character
- Predominantly White (87%)
- Race & ethnicity
- White 87% Hispanic / Latino 9% Two or more races 8%
- Hispanic origin (detail)
- Mexican 3% Puerto Rican 3% Salvadoran 2%
- Common ancestry
- Romanian 11% Iranian 3% Polish 2%
- Foreign-born
- 2% · Canada, Dominican Republic
- Languages at home
- 97% English-only · Spanish 2%
Political lean MEDSL · Schuylkill
- 2024 margin
- Solid R (+42.1) · D 28.5% · R 70.6%
- 2008→2024 swing
- -33.4pp toward R · 2008: -8.7pp · 2024: -42.1pp
- All cycles
- 2024: R+42.1 2020: R+39.9 2016: R+43.4 2012: R+13.4 2008: R+8.7
Not yet ingested
- Civics
- —
Market trends
- HPI YoY
- ▼ -35.53%
- Current HPI
- 194.8976
- Rent YoY
- —
- Metro
- —
- State GDP YoY
- ▲ 1.68%
- F500 in state
- 34
Industry mix (Fortune 500 HQ in PA)
| Industry | F500 HQs | Revenue |
|---|---|---|
| Healthcare | 2 | $309B |
|
||
| Insurance | 2 | $27B |
|
||
| Telecommunications / Media | 1 | $124B |
|
||
| Industrial Distribution | 1 | $22B |
|
||
| Financial Services | 1 | $20B |
|
||
| Chemicals / Materials | 1 | $18B |
|
||
Price history
+163.5% since first listed10 events — show timeline
- 2026-06-05 Listed $97,500 GLVRMLS
- 2026-03-16 Sold (Public Records) $17,500 Public Records
- 2016-01-22 Listing Removed — BRIGHT MLS
- 2008-04-23 Sold (MLS) $38,500 BRIGHT MLS
- 2008-04-11 Sold (Public Records) $37,500 Public Records
- 2007-08-07 Listing Removed — BRIGHT MLS
- 2007-08-07 Listed $38,500 BRIGHT MLS
- 2006-10-31 Sold (MLS) $37,000 BRIGHT MLS
- 2006-10-23 Sold (Public Records) $37,000 Public Records
- 2005-08-31 Listed $37,000 BRIGHT MLS
Property tax history
+15.7%/yrLatest (2026): $5,873 · +280.8% YoY. Source: county tax records.
Cash-flow waterfall
monthlySold comps — $/sqft
last 12 mo · ≤1 miLoading sold comps…