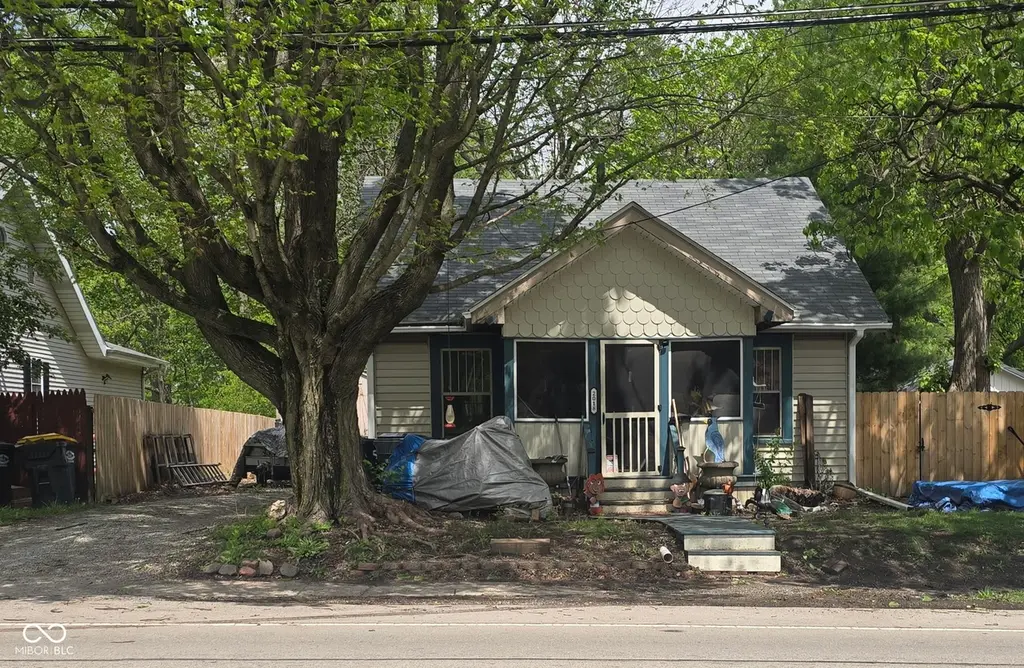
2018 Ohio Ave · Anderson, IN
Flood risk 1/10 · Minimal
- FEMA flood zone
- X (unshaded)
- Chance of flooding over 30 yrs
- 0.0%
- Est. flood insurance / yr
- $473 – $860
Fire risk 1/10 · Minimal
- Est. fire insurance / yr
- $717 – $1,331
Heat risk 3/10 · Minor
- Hot days now (above 100°F)
- 7 days/yr
- Hot days in 30 yrs
- 18 days/yr
Wind risk 2/10 · Minimal
- Chance of severe wind over 30 yrs
- 0.0%
Air-quality risk 3/10 · Minor
- Unhealthy air days now
- 2 days/yr
- Unhealthy air days in 30 yrs
- 3 days/yr
Risk factors via First Street. Map © Google.
Why this score? — see what drove the B+ grade
The composite is a weighted blend of 9 inputs, each scored 0–100. Each bar is that input's sub-score; the figure is the points it added to the 100-point composite (weight × sub-score).
- Cash flow +30.0/30.0
- ARV discount +15.0/15.0
- 1% rule +10.0/10.0
- DSCR +10.0/10.0
- Rent growth +4.5/5.0
- Livability +3.0/5.0
- Condition / age +2.5/5.0
- Schools +1.6/10.0
- Appreciation +0.0/10.0
$47,500
🖨 Deal sheet 📄 Offer letter ✓ Due diligence
Listing remarks
ATTENTION: INVESTORS, "AS IS CONDITION", CASH ONLY! Some remodeling started, never completed. The spacious uncompleted room could be the original 2nd bedroom, office or room of your choice. Some materials will remain on the property. The second bedroom has been remodeled to open concept. Nice screen front porch. Motivated Seller!
Key facts
- 7,200 sq ft lot
- Built 1930
- Listed 50 days
Property features AI
Finance
- Other: Lot is approximately 0.17 acres (city lot, access); Building area total 1,231; living area 832
Exterior
- Utilities: Public water; Septic system; Electricity connected; Natural gas available and connected; Water connected
- Home design: Single-family residence; One story; Fixer condition
- Construction: Other construction materials; Other foundation
- Exterior features: Covered porch; Deck; Partial fencing; Storage shed
Interior
- Kitchen: Microwave; Refrigerator
- Bedrooms: 1 bedroom on the main level
- Bathrooms: 1 full bathroom on the main level
- Heating & cooling: Forced air heating (natural gas); Window unit(s) for cooling; No central air
- Interior features: Eat-in kitchen; Cellar with interior entry
- Laundry & utility: Main-level laundry room
Neighborhood map
What this means for you Summary
Snapshot
- This is a 2-bed/1.0-bath single-family listed at $48k.
Deal economics
- At list price, monthly cash flow is $408 ($5k/yr) — positive.
- The deal already cash-flows at list — no discount required.
- Meets the 1% rule at list price ($904 rent vs $48k).
- Recommended offer: $46k (3.0% below list) — sets the bar for market timing.
- Cap rate 16.6% vs local median 6.5% in Anderson — top-decile yield for the area; either an underpriced asset or a hidden risk that comps aren't pricing in. Stress-test before assuming the spread holds.
Location & tenants
- Location reads 60/100 on livability (#521 in IN) — a middle-class / working-renter tenant base. Strengths: cost of living A+, housing A+; Watch: crime D-, amenities F, commute F.
- Anderson Community School Corporation (urban): math 15% / reading 23% proficiency, ranked #280 of 301 in IN (top 93%) — low school quality limits family demand, transient renter base, plan for 1-2y turnover; 70% free/reduced lunch — lower-income household profile, screen leases tightly.
- Zoned schools: Anderson Elementary School (math 12% / reading 12%, grade F, #893 of 994 statewide, top 91%, 378 students, 92% FRL); Anderson High School (math 21% / reading 51%, grade F, #261 of 369 statewide, top 71%, 1,790 students, 76% FRL).
- Market conditions: Rents rising fast (+7.9%/yr); 185 active listings in the ZIP; 40 comparable units currently listed for rent nearby; rentals at typical pace (median 24d on market — plan ~3-4 weeks tenant-placement turnaround); 45% of comp listings sitting > 30 days — soft ceiling on asking rent; lower-income renter base — watch delinquency; 184 units permitted in Madison County in 2024 (0 in 5+ unit buildings).
- This rent runs 30% of the median local income ($36k/yr) — at the standard rent-burdened threshold; future hikes will face affordability resistance.
Forward outlook
- Local home prices are declining (-3.0%/yr); year-one equity from $328 of loan paydown is wiped out by about $1k of value loss. Plan a longer hold.
- Madison County population projected at -14% by 2050 — secular population decline; favor cash flow + early exit over multi-decade hold.
- At projected returns (-3.0% appreciation + 7.9% rent growth), your $13k cash investment doubles in ~3 years — after that, you're playing with house money.
Negotiation context
- It's been on market 50 days — a 3% lower offer ($46k) is reasonable based on typical stale-listing flexibility.
- 2 sale attempts since 11y ago; this cycle's ask has dropped $8k (14%) from the opening price — seller is motivated, your offer sets the floor, not the list.
Risks & watch-outs
- Watch-outs: built in 1930 — expect roof / HVAC / electrical / plumbing capex.
Questions for the listing agent
- It's been on market 50 days. Have you received any prior offers? Is the seller open to a 3% concession, seller financing, or rate buy-down credit?
- Built in 1930 — when were the roof, HVAC, electrical panel, plumbing, and water heater last replaced?
- Is there a deadline driving the sale (1031 exchange, divorce, estate, relocation)? That informs how much negotiation room exists.
- Schools are F-rated, which usually means shorter tenancies and higher turnover. Who's the typical renter profile here, and what's been the actual vacancy rate?
- Crime grade is D in this area — have there been break-ins, vandalism, or insurance claims at this property in the last 3 years? What carrier currently insures it and at what premium?
- What's the average days-on-market for RENTAL listings here right now (not sales)? A rising rental-DOM trend means longer vacancies and softer asking-rent achievability than the comps imply.
- What's the recent tenant-quality profile in this submarket — average credit score on applications, eviction rate, late-payment / NSF rate, and stable-employment percentage? A property-management company in the area should have these aggregated.
- How much new for-sale + rental construction is in the pipeline within 1–3 miles? Heavy new supply typically softens prices + rents 12–24 months out; constrained supply supports both.
Investment metrics
- 1% rule
- 1.90% ✓
- Cap rate
- 16.61%
- Cash-on-cash
- 36.84%
- DSCR
- 2.64
- GRM
- 4.4
CMA / ARV
- ARV (median comp)
- $69,142
- List price
- $47,500
- Delta
- -31.30%
- Verdict
- UNDERPRICED
- Comps
- 20 within 1.0 mi
Show comp detail 6 sales within ~0.75 mi
| Address | Dist | Beds/Ba | Sqft | Sold | Price | $/sf | Match |
|---|---|---|---|---|---|---|---|
| 1221 E 22nd St | 0.17mi | 2/1.0 | 864 (+4%) | 12mo | $65,000 | $75 | 76 |
| 1718 Cincinnati Ave | 0.30mi | 2/1.0 | 898 (+8%) | 4mo | $115,000 | $128 | 70 |
| 1739 E 18th St | 0.33mi | 2/1.0 | 869 (+4%) | 10mo | $30,000 | $35 | 69 |
| 1411 Home Ave | 0.69mi | 3/1.0 (+1) | 810 (-3%) | 2mo | $71,000 | $88 | 57 |
| 2330 Ridgewood Dr | 0.73mi | 2/1.0 | 925 (+11%) | 12mo | $145,000 | $157 | 37 |
| 1423 E 30th St | 0.72mi | 2/1.0 | 769 (-8%) | 22mo | $90,500 | $118 | 36 |
Match score weights: distance 35% · size 25% · config 20% · recency 20%. Top-matched comps best support the ARV.
Projected returns pro-forma
-3.0% appreciation · 7.88% rent growth · sell at horizon
- IRR
- 38.0%
- Equity multiple
- 2.73×
- Total profit
- $22,965
- Equity at exit
- $7,082
- IRR
- 46.8%
- Equity multiple
- 6.61×
- Total profit
- $74,629
- Equity at exit
- $4,107
Cash invested: $13,300 (down + closing). Projections, not guarantees.
Landlord ↔ Tenant lean methodology
- Overall (STATE)
- 90 Strongly Landlord-Friendly
- State Indiana
- 90 Strongly Landlord-Friendly · R+11
- County
- — inherits STATE
- City
- — inherits STATE
ZIP-level market 46016
- Home prices YoY
- -3.5%
- Rents YoY
- 7.9%
- Active inventory
- 185
- Price-to-rent
- 4.4×
Monthly cashflow live
- Estimated rent
- $904 high interval (Pro) →
- Mortgage (P&I)
- −$249
- Tax from tax record
- −$37 /mo · $445/yr
- Insurance
- −$20
- HOA
- −$0
- Vacancy / Maint / Mgmt
- −$190
- Net cashflow
- $408
Break-even live
UW: 25.0% down · 7.5% · 30yr · 1.5% tax · 5.0% vac · 8.0% maint · 8.0% mgmt
Financing live
Cash to close
- Down payment
- $11,875
- Closing costs
- $1,425
- Reserves months
- —
- Total cash needed
- —
Loan-product check · same deal, 3 products live
Conventional
25% down · 7.5% · 30yr
- Down + closing
- —
- Monthly P&I
- —
- Monthly cashflow
- —
- DSCR
- —
- Eligible?
- —
Personal DTI + credit; lowest rate.
DSCR
20% down · 8.5% · 30yr
- Down + closing
- —
- Monthly P&I
- —
- Monthly cashflow
- —
- DSCR
- —
- Eligible?
- —
No personal income docs; deal must DSCR.
Hard money
10% down · 12.0% · 12mo
- Down + closing
- —
- Monthly P&I
- —
- Monthly cashflow
- —
- DSCR
- —
- Eligible?
- —
Short-term bridge; refi at stabilization.
Rent comps 40 comps
| Address | Beds | Baths | Sqft | Rent | $/sqft | DOM | Units | Dist |
|---|---|---|---|---|---|---|---|---|
| 2233 E Lynn St Anderson, IN | 1.0 | 1.0 | 700 | $695 | $0.99 | 2d | 1 | 0.31mi |
| 1719 Johnson Ave Anderson, IN | 1.0 | 1.0 | 616 | $824 | $1.34 | 44d | 1 | 0.31mi |
| 2002 Jefferson St Unit 3 Anderson, IN | 1.0 | 2.0 | 725 | $600 | $0.83 | 44d | 1 | 0.50mi |
| 702 E 23rd St Anderson, IN | 1.0 | 1.0 | 560 | $595 | $1.06 | 15d | 1 | 0.53mi |
| 1710 Jefferson St Apt 2 Anderson, IN | 2.0 | 1.0 | 550 | $950 | $1.73 | 44d | 1 | 0.53mi |
| 1232 E 28th St Anderson, IN | 2.0 | 2.0 | 795 | $950 | $1.19 | 44d | 1 | 0.54mi |
| 1726-1728 Walnut St Anderson, IN | 2.0 | 2.0 | 900 | $995 | $1.11 | 2d | 1 | 0.64mi |
| 1045 Alhambra Dr Unit 6 Anderson, IN | 2.0 | 1.5 | 900 | $975 | $1.08 | 24d | 1 | 0.70mi |
| 1411 Home Ave Anderson, IN | 3.0 | 1.0 | 810 | $1,295 | $1.60 | 24d | 1 | 0.71mi |
| 3009 E Lynn St Unit 1 Anderson, IN | 3.0 | 1.0 | 1000 | $875 | $0.88 | 20d | 1 | 0.75mi |
| 1501 E 31st St Anderson, IN | 2.0 | 1.0 | 840 | $1,199 | $1.43 | 20d | 1 | 0.75mi |
| 1829 E 8th St Anderson, IN | 1.0–3.0 | 1.0 | 810 | $1,025 | $1.27 | 24d | 9 | 0.78mi |
| 2111 Central Ave Anderson, IN | 3.0 | 1.0 | 1026 | $1,250 | $1.22 | 44d | 1 | 0.85mi |
| 3006 Noble St Anderson, IN | 2.0 | 1.0 | 1064 | $995 | $0.94 | 7d | 1 | 0.87mi |
| 917 E 8th St Unit 2 Anderson, IN | 2.0 | 1.0 | 550 | $825 | $1.50 | 7d | 1 | 0.88mi |
| 414 Wheeler Ave Apt B Anderson, IN | 1.0 | 1.0 | 600 | $650 | $1.08 | 44d | 1 | 0.90mi |
| 221 E 13th St Anderson, IN | 1.0 | 1.0 | 595 | $995 | $1.67 | 15d | 1 | 0.93mi |
| 219 E 13th St Anderson, IN | 3.0 | 1.0 | 882 | $1,000 | $1.13 | 4d | 1 | 0.94mi |
| 2505 E 10th St Anderson, IN | 1.0–2.0 | 1.0 | 850 | $949 | $1.12 | 44d | 2 | 0.95mi |
| 223 E 11th St Anderson, IN | 2.0 | 1.0 | 800 | $900 | $1.12 | 44d | 1 | 1.00mi |
| 2625 Main St Anderson, IN | 2.0 | 1.0 | 988 | $895 | $0.91 | 24d | 1 | 1.01mi |
| 3000 Fletcher St Unit 3000 Anderson, IN | 2.0 | 1.0 | 800 | $650 | $0.81 | 44d | 1 | 1.01mi |
| 919 E 6th St Apt 2 Anderson, IN | 1.0 | 1.0 | 700 | $625 | $0.89 | 24d | 1 | 1.02mi |
| 328 E 31st St Anderson, IN | 1.0 | 1.0 | 600 | $750 | $1.25 | 44d | 1 | 1.02mi |
| 1317 Main St Anderson, IN | 2.0 | 1.0 | 750 | $800 | $1.07 | 44d | 1 | 1.03mi |
| 530 Alhambra Dr Anderson, IN | 1.0–2.0 | 1.0 | 879 | $1,100 | $1.25 | 44d | 1 | 1.03mi |
| 2412 E 7th St Anderson, IN | 2.0 | 1.0 | 600 | $895 | $1.49 | 2d | 1 | 1.11mi |
| 2324 Chase St Anderson, IN | 2.0 | 1.0 | 783 | $950 | $1.21 | 44d | 1 | 1.21mi |
| 3614 Columbus Ave Anderson, IN | 1.0 | 1.0 | 553 | $725 | $1.31 | 15d | 1 | 1.23mi |
| 915 High St Unit 915 1/2 Anderson, IN | 1.0 | 1.0 | 600 | $650 | $1.08 | 44d | 1 | 1.29mi |
| 2627 Chase St Anderson, IN | 3.0 | 1.0 | 1050 | $850 | $0.81 | 18d | 1 | 1.30mi |
| 120 W 10th St Anderson, IN | 1.0–3.0 | 1.0 | 1066 | $1,025 | $0.96 | 2d | 1 | 1.31mi |
| 602 Meridian St Apt C Anderson, IN | 2.0 | 1.0 | 800 | $900 | $1.12 | 44d | 1 | 1.34mi |
| 602 Meridian St Unit 608 A Anderson, IN | 1.0 | 1.0 | 650 | $750 | $1.15 | 24d | 1 | 1.34mi |
| 2442 Morton St Anderson, IN | 2.0 | 1.0 | 862 | $1,125 | $1.31 | 24d | 1 | 1.36mi |
| 2904 Lincoln St Anderson, IN | 2.0 | 1.0 | 864 | $900 | $1.04 | 44d | 1 | 1.40mi |
| 608 Ellenhurst Dr Anderson, IN | 2.0 | 1.0 | 686 | $1,100 | $1.60 | 24d | 1 | 1.40mi |
| 618 W 22nd St Anderson, IN | 3.0 | 1.0 | 900 | $1,250 | $1.39 | 44d | 1 | 1.43mi |
| 702 W 23rd St Anderson, IN | 1.0 | 1.0 | 560 | $595 | $1.06 | 4d | 1 | 1.48mi |
| 2301 Sheridan St Anderson, IN | 2.0 | 1.0 | 900 | $950 | $1.06 | 44d | 1 | 1.48mi |
Listing history 16 events
-
2026-06-18days on market $47,500 Active 50 DOM
-
2026-06-17days on market $47,500 Active 49 DOM
-
2026-06-16days on market $47,500 Active 48 DOM
-
2026-06-15days on market $47,500 Active 47 DOM
-
2026-06-13days on market $47,500 Active 45 DOM
-
2026-06-09days on market $47,500 Active 41 DOM
-
2026-06-08days on market $47,500 Active 40 DOM
-
2026-06-07days on market $47,500 Active 39 DOM
-
2026-06-05days on market $47,500 Active 36 DOM
-
2026-06-03days on market $47,500 Active 35 DOM
-
2026-06-02days on market $47,500 Active 34 DOM
-
2026-06-01days on market $47,500 Active 33 DOM
-
2026-05-31days on market $47,500 Active 32 DOM
-
2026-04-28$55,000 Active 273-char remark
-
2015-12-14historical
-
2015-10-20$13,500 Active
ⓘ Source: listings_history table (triggers on properties + properties_extension) + one-shot
backfill from property_details.listing_events for pre-trigger history.
Tax reassessment forecast IN · Partial reset (capped growth)
- Current annual tax
- $445 · $37/mo
- Projected year-2 tax
- $445 · $37/mo
- Expected delta
- $0/yr ($0/mo · 0.0%)
ⓘ Screening estimate from a state-policy table — verify with the county assessor before closing.
Climate risk First Street
- Flood 1/10 Low FEMA zone X (unshaded) · 0% chance over 30 yrs
- Wildfire 1/10 Low
- Heat 3/10 Moderate 7 d/yr ≥100°F today · 18 d/yr by 30 yrs out
- Wind 2/10 Low 0% chance of damaging wind over 30 yrs
- Air quality 3/10 Moderate 2 unhealthy d/yr today · 3 by 30 yrs out
Nearby sold comps map
Loading sold comps map…
Walkable amenities ~0.75 mi
Loading nearby amenities…
Taxation est. · year 1
- Rental income
- $10,850
- − Mortgage interest
- −$2,661
- − Property taxes
- −$445
- − Insurance
- −$238
- − Repairs & maintenance
- −$868
- − Management
- −$868
- − Depreciation
- −$1,382
- Taxable income
- $4,389
- Est. tax owed @ 24.0%
- −$1,053
- After-tax cash flow
- $3,846/yr
For passive investors: Depreciation is non-cash, so a rental often shows a tax loss while cash-flowing — sheltering income. Rental losses are passive: they offset passive income freely, and up to $25,000/yr can offset ordinary (W-2) income if you actively participate and your MAGI is under $100k (phasing out to $0 by $150k); unused losses carry forward. On sale, claimed depreciation is recaptured at up to 25%, and gains may owe capital-gains tax (a 1031 exchange can defer both). Figures are a year-1 estimate at your 24.0% rate — not tax advice; consult a CPA.
Schools (NCES district)
- District
- Anderson Community School Corporation
- NCES district ID
- 1800150
- Math proficiency
- 15% ▼ -14.00%
- Reading proficiency
- 23% ▼ -7.00%
- Median HH income
- $38,208
- Composite
- 15.93/100
- National rank
- #9250
- State rank
- #280 of 301 in IN
Livability — Anderson
- Score
- 60/100
- State rank
- #521
- US rank
- #18709
Category grades
Schools grade is shown separately in the Schools card above.
Census & demographics
- Census place
- Anderson, IN
- County
- Madison County · 69,445 people
- City population
- 57,762
- Metro
- Indianapolis-Carmel-Anderson, IN
- Population (ZIP)
- 17,834
- Household income
- $36,029
- Rent vs Own
- Severe rent burden
- 1193.0
Population outlook (Madison County) Hauer SSP2
- Today (2025)
- 125,800 people
- By 2030
- 122,640 · -2.5%
- By 2040
- 115,420 · -8.3%
- By 2050
- 108,148 · -14.0%
- By 2075
- 91,838 · -27.0%
- By 2100
- 75,670 · -39.8%
Race, ethnicity, and origin ACS 2023
- Neighborhood character
- Diverse neighborhood (Simpson 0.58)
- Race & ethnicity
- White 61% Black 18% Hispanic / Latino 13% Two or more races 11% Native American 1%
- Hispanic origin (detail)
- Mexican 10% Puerto Rican 1%
- Common ancestry
- Italian 2% Slovak 1% Iranian 1%
- Foreign-born
- 4% · Canada
- Languages at home
- 86% English-only · Spanish 12%
Political lean MEDSL · Madison
- 2024 margin
- Strong R (+26.9) · D 35.6% · R 62.5% · Other 1.9%
- 2008→2024 swing
- -33.5pp toward R · 2008: 6.5pp · 2024: -26.9pp
- All cycles
- 2024: R+26.9 2020: R+22.6 2016: R+25.7 2012: R+4.5 2008: D+6.5
Not yet ingested
- Civics
- —
Market trends
- HPI YoY
- ▼ -11.12%
- Current HPI
- 302.7437
- Rent YoY
- ▲ 7.88%
- Metro
- Indianapolis-Carmel-Anderson, IN
- State GDP YoY
- ▲ 2.90%
- F500 in state
- 18
Industry mix (Fortune 500 HQ in IN)
| Industry | F500 HQs | Revenue |
|---|---|---|
| Industrial Machinery | 2 | $37B |
|
||
| Healthcare | 1 | $177B |
|
||
| Pharmaceuticals | 1 | $45B |
|
||
| Metals / Steel | 1 | $18B |
|
||
| Agriculture | 1 | $17B |
|
||
| Packaging | 1 | $12B |
|
||
Price history
+251.9% since first listed4 events — show timeline
- 2026-05-22 Price Changed $47,500 MIBOR as Distributed by MLS Grid
- 2026-04-28 Listed $55,000 MIBOR as Distributed by MLS Grid
- 2015-12-14 Listing Removed — MIBOR as Distributed by MLS Grid
- 2015-10-20 Listed $13,500 MIBOR as Distributed by MLS Grid
Property tax history
+6.7%/yrLatest (2024): $445 · +5.8% YoY. Source: county tax records.
Cash-flow waterfall
monthlySold comps — $/sqft
last 12 mo · ≤1 miLoading sold comps…