100 E Glenolden Ave Unit R-10 · Glenolden, PA
Flood risk 1/10 · Minimal
- FEMA flood zone
- X (unshaded)
- Chance of flooding over 30 yrs
- 0.0%
- Est. flood insurance / yr
- $507 – $1,088
Fire risk 1/10 · Minimal
- Est. fire insurance / yr
- $511 – $949
Heat risk 7/10 · Major
- Hot days now (above 103°F)
- 7 days/yr
- Hot days in 30 yrs
- 15 days/yr
Wind risk 6/10 · Moderate
- Chance of severe wind over 30 yrs
- 27.0%
Air-quality risk 4/10 · Minor
- Unhealthy air days now
- 3 days/yr
- Unhealthy air days in 30 yrs
- 6 days/yr
Risk factors via First Street. Map © Google.
Why this score? — see what drove the D grade
The composite is a weighted blend of 9 inputs, each scored 0–100. Each bar is that input's sub-score; the figure is the points it added to the 100-point composite (weight × sub-score).
- ARV discount +13.3/15.0
- 1% rule +8.4/10.0
- Cash flow +7.9/30.0
- Livability +4.2/5.0
- Schools +3.3/10.0
- Rent growth +2.5/5.0
- Condition / age +2.5/5.0
- DSCR +1.9/10.0
- Appreciation +0.0/10.0
$94,900
🖨 Deal sheet (PDF) 📄 Offer letter ✓ Due diligence
Listing remarks
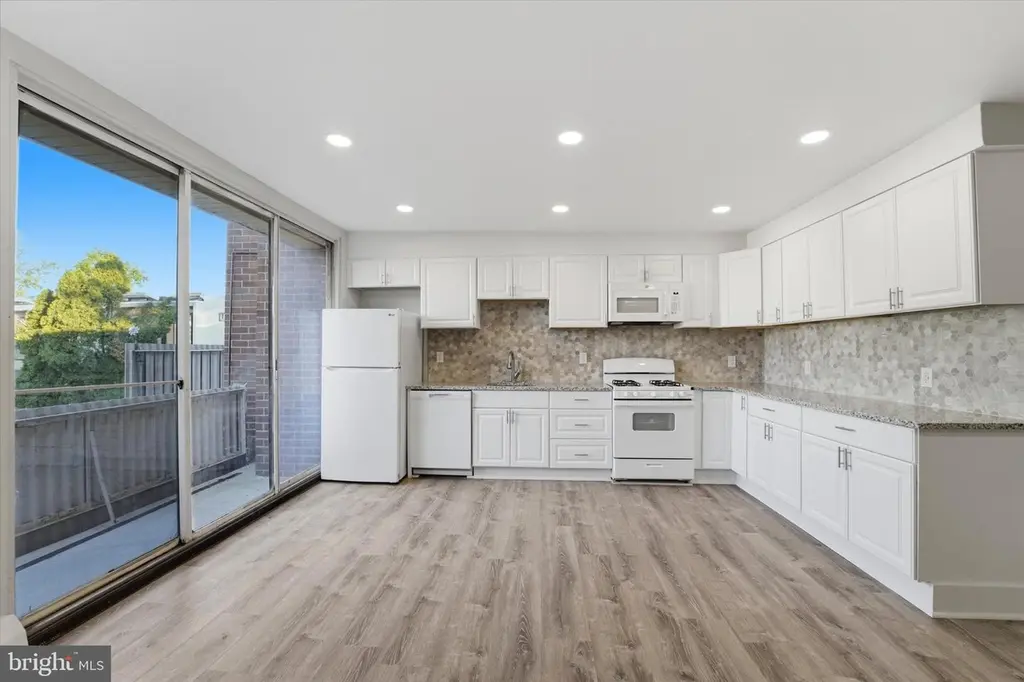
Brand new renovated condo in the sought-after Contemporary Villages Condominium Association! This 1 bed 1 bath unit offers modern comfort, maintenance-free living and excellent community amenities, all in a convenient Glenolden location. Enter Unit R10, tucked away off street through a tree-lined courtyard, to discover new luxury vinyl flooring and fresh paint throughout. The open concept kitchen/living room provides space for relaxing and entertaining, with recessed lights creating a bright and inviting atmosphere. A sliding glass door leads outside to a private balcony overlooking the community pool. The kitchen has been completely remodeled including new cabinets, countertops, backsplash
Key facts
- Upgraded bathroom
- Renovated condo
- Private balcony
Tags
Property features AI
Finance
- Other: Property manager present; Unit count: 1
- HOA & community: Monthly condo fee (approximately $414.34); Professionally managed on-site; Condo fee covers common area maintenance, exterior building maintenance, lawn maintenance, management, pest control, snow removal, pool(s), trash, and water; Community amenities include laundry facilities, outdoor pool, and tennis courts
Exterior
- Parking: On-street parking; Off-street parking; Parking lot
- Utilities: Public water; Public sewer
- Home design: Condominium unit (Garden style, 1–4 floors); Unit/flat structure; Entry on 2nd floor; Flat roof; No horse privileges
- Construction: Brick construction; Above-grade and below-grade structures; Estimated major renovation or effective year 2026
- Exterior features: Balcony; Community in-ground pool; Common grounds
Interior
- Kitchen: Refrigerator; Gas oven/range; Dishwasher
- Bedrooms: One bedroom on the main level
- Bathrooms: One full bathroom on the main level; One full bathroom total
- Heating & cooling: Baseboard hot water heating; Wall unit cooling (electric); 100 amp electrical service; Natural gas hot water
- Interior features: Unfurnished unit; Basement present (unfinished); Assessor-listed living area
- Laundry & utility: Laundry in basement (shared); No washer/dryer hookup in unit
Neighborhood map
What this means for you Summary
Snapshot
- This is a 1-bed/1.0-bath condo listed at $95k.
Deal economics
- At list price, monthly cash flow is $-102 ($-1k/yr) — negative.
- To cash-flow at today's rent, offer at most $77k (19.0% below list).
- Meets the 1% rule at list price ($1k rent vs $95k).
- Recommended offer: $77k (19.0% below list) — sets the bar for cash-flow.
- Cap rate 5.0% vs local median 3.8% in Glenolden — top-decile yield for the area; either an underpriced asset or a hidden risk that comps aren't pricing in. Stress-test before assuming the spread holds.
Location & tenants
- Location reads 85/100 on livability (#69 in PA, #481 nationally) — a professional / high-income tenant draw. Strengths: commute A+, cost of living A+, housing A+; Watch: amenities D.
- Interboro SD (suburban): math 25% / reading 50% proficiency, ranked #369 of 539 in PA (top 68%) — families likely to look elsewhere, expect single-tenant / working-renter base with shorter leases.
- Zoned schools: Glenolden Sch (math 17% / reading 51%, grade F, #1,076 of 1,518 statewide, top 71%, 611 students, 66% FRL); Interboro Shs (math 82% / reading 24%, grade C-, #104 of 437 statewide, top 24%, 1,028 students, 55% FRL) — zoned schools average 60% FRL vs 38% district-wide (22 pts higher); higher-poverty schools than district average — tighter screening recommended.
- Market conditions: 46 active listings in the ZIP; 25 comparable units currently listed for rent nearby; rentals at typical pace (median 26d on market — plan ~3-4 weeks tenant-placement turnaround); 40% of comp listings sitting > 30 days — soft ceiling on asking rent; solid renter incomes; 299 units permitted in Delaware County in 2024 (5 in 5+ unit buildings).
Forward outlook
- Local home prices are declining (-3.0%/yr); year-one equity from $656 of loan paydown is wiped out by about $3k of value loss. Plan a longer hold.
Negotiation context
- It's been on market 54 days — a 3% lower offer ($92k) is reasonable based on typical stale-listing flexibility.
- 2 sale attempts since 30y ago with the ask held roughly flat each time — persistent listings suggest the price (not the market) is what's stuck; bring a comps-based counter.
Risks & watch-outs
- Watch-outs: HOA is 33% of rent.
- Climate carrying-cost: major wind risk, 27% chance of damaging wind over 30y; extreme-heat days projected 7→15/yr by 2055 (HVAC capex compounding) — expect insurance premiums to compound above CPI over the hold.
Questions for the listing agent
- What do current leases actually rent for vs. the listed asking? Can we see a recent rent roll and the last 12 months of T-12 income?
- It's been on market 54 days. Have you received any prior offers? Is the seller open to a 19% concession, seller financing, or rate buy-down credit?
- Built in 1964 — when were the roof, HVAC, electrical panel, plumbing, and water heater last replaced?
- What does the HOA fee cover, when was the last increase, and are there any pending special assessments or reserve-fund shortfalls?
- Any open or pending special assessments — roof, HVAC, plumbing, elevator, façade? What's the per-unit balance and payoff schedule, and is the seller paying it off at close or rolling it to the buyer?
- Is there a deadline driving the sale (1031 exchange, divorce, estate, relocation)? That informs how much negotiation room exists.
- Schools are B-rated — typically a magnet for longer-tenancy family renters. What's the average tenant stay here, and is there a school-zone premium baked into asking?
- The area grade is low — what's the realistic commute time and amenity access for the typical tenant pool here? Any planned neighborhood developments (good or bad) we should know about?
- What's the average days-on-market for RENTAL listings here right now (not sales)? A rising rental-DOM trend means longer vacancies and softer asking-rent achievability than the comps imply.
- What's the recent tenant-quality profile in this submarket — average credit score on applications, eviction rate, late-payment / NSF rate, and stable-employment percentage? A property-management company in the area should have these aggregated.
- How much new apartment / multifamily construction is in the pipeline within 1–3 miles? Heavy new supply (>2% of stock underway) typically softens rents 12–24 months out; light construction supports rent growth.
Investment metrics
- 1% rule
- 1.34% ✓
- Cap rate
- 5.00%
- Cash-on-cash
- -4.62%
- DSCR
- 0.79
- GRM
- 6.2
CMA / ARV
- ARV (median comp)
- $108,814
- List price
- $94,900
- Delta
- -12.79%
- Verdict
- UNDERPRICED
- Comps
- 20 within 1.0 mi
Projected returns pro-forma
-3.0% appreciation · 3.0% rent growth · sell at horizon
- IRR
- -23.7%
- Equity multiple
- 0.19×
- Total profit
- $-21,592
- Equity at exit
- $14,150
- IRR
- -17.5%
- Equity multiple
- 0.02×
- Total profit
- $-25,982
- Equity at exit
- $8,205
Cash invested: $26,572 (down + closing). Projections, not guarantees.
Landlord ↔ Tenant lean methodology
- Overall (STATE)
- 62 Landlord-Friendly
- State Pennsylvania
- 62 Landlord-Friendly · EVEN
- County
- — inherits STATE
- City
- — inherits STATE
ZIP-level market 19036
- Active inventory
- 46
- Price-to-rent
- 6.2×
Monthly cashflow live
- Estimated rent
- $1,271 high interval (Pro) →
- Mortgage (P&I)
- −$498
- Tax from tax record
- −$155 /mo · $1,863/yr
- Insurance
- −$40
- HOA
- −$414
- Vacancy / Maint / Mgmt
- −$267
- Net cashflow
- $-102
Break-even live
Sensitivity live
| Price | -10% $-48 | -5% $-75 | +0% $-102 | +5% $-129 | +10% $-156 |
|---|---|---|---|---|---|
| Rent | -10% $-203 | -5% $-152 | +0% $-102 | +5% $-52 | +10% $-2 |
| Rate | -1.0pp $-54 | -0.5pp $-78 | base $-102 | +0.5pp $-127 | +1.0pp $-152 |
UW: 25.0% down · 7.5% · 30yr · 1.5% tax · 5.0% vac · 8.0% maint · 8.0% mgmt
Financing live
Cash to close
- Down payment
- $23,725
- Closing costs
- $2,847
- Reserves months
- —
- Total cash needed
- —
Loan-product check · same deal, 3 products live
Conventional
25% down · 7.5% · 30yr
- Down + closing
- —
- Monthly P&I
- —
- Monthly cashflow
- —
- DSCR
- —
- Eligible?
- —
Personal DTI + credit; lowest rate.
DSCR
20% down · 8.5% · 30yr
- Down + closing
- —
- Monthly P&I
- —
- Monthly cashflow
- —
- DSCR
- —
- Eligible?
- —
No personal income docs; deal must DSCR.
Hard money
10% down · 12.0% · 12mo
- Down + closing
- —
- Monthly P&I
- —
- Monthly cashflow
- —
- DSCR
- —
- Eligible?
- —
Short-term bridge; refi at stabilization.
Rent comps 25 comps
| Address | Beds | Baths | Sqft | Rent | $/sqft | DOM | Units | Dist |
|---|---|---|---|---|---|---|---|---|
| 100 E Glenolden Ave Glenolden, PA | 1.0–4.0 | 1.0–2.0 | 920 | $1,200 | $1.30 | 0d | 4 | 0.03mi |
| 200 Karen Cir Glenolden, PA | 1.0 | 1.0 | 637 | $1,248 | $1.96 | 0d | 4 | 0.21mi |
| 350 S Scott Ave Unit 1 Glenolden, PA | 2.0 | 1.0 | 715 | $1,700 | $2.38 | 26d | 1 | 0.23mi |
| 227 Chester Pike Unit 227-04 Glenolden, PA | 1.0 | 1.0 | 625 | $1,175 | $1.88 | 45d | 1 | 0.48mi |
| 60 W Winona Ave Norwood, PA | 1.0 | 1.0 | 625 | $1,250 | $2.00 | 0d | 2 | 0.62mi |
| 10 E Winona Ave Unit 10-B7 Norwood, PA | 1.0 | 1.0 | 600 | $1,195 | $1.99 | 26d | 1 | 0.64mi |
| 556 Chester Pike Unit 556-02 Norwood, PA | 1.0 | 1.0 | 550 | $1,175 | $2.14 | 45d | 1 | 0.77mi |
| 556 Chester Pike Unit 556-11 Norwood, PA | 1.0 | 1.0 | 550 | $1,275 | $2.32 | 45d | 1 | 0.77mi |
| 1528 Elmwood Ave Unit 108 Folcroft, PA | 1.0 | 1.0 | 600 | $1,200 | $2.00 | 26d | 1 | 0.78mi |
| 1528 Elmwood Ave Folcroft, PA | 1.0 | 1.0 | 600 | $1,350 | $2.25 | 45d | 1 | 0.78mi |
| 132 Folcroft Ave Folcroft, PA | 2.0 | 1.0 | 725 | $1,489 | $2.05 | 4d | 3 | 0.78mi |
| 1511 Elmwood Ave Folcroft, PA | 1.0–3.0 | 1.0 | 725 | $1,149 | $1.58 | 25d | 3 | 0.82mi |
| 430 Folcroft Ave Unit 2 Folcroft, PA | 1.0 | 1.0 | 500 | $950 | $1.90 | 45d | 1 | 0.85mi |
| 704 14th Ave Unit 3 Prospect Park, PA | 1.0 | 1.0 | 600 | $1,250 | $2.08 | 45d | 1 | 1.03mi |
| 701 Lincoln Ave Prospect Park, PA | 1.0–2.0 | 1.0 | 762 | $1,245 | $1.63 | 23d | 3 | 1.14mi |
| 640 South Ave Secane, PA | 1.0–2.0 | 1.0–1.5 | 742 | $1,210 | $1.63 | 14d | 5 | 1.18mi |
| 1637 Lincoln Ave Prospect Park, PA | 1.0–2.0 | 1.0 | 675 | $1,399 | $2.07 | 6d | 7 | 1.20mi |
| 1118 Lafayette Ave Apt 209 Prospect Park, PA | 1.0 | 1.0 | 612 | $1,300 | $2.12 | 45d | 1 | 1.20mi |
| 1010 Beechwood Ave Apt A Collingdale, PA | 1.0 | 1.0 | 480 | $1,350 | $2.81 | 19d | 1 | 1.24mi |
| 1628 Lincoln Ave Prospect Park, PA | 1.0 | 1.0 | 550 | $1,295 | $2.35 | 45d | 1 | 1.25mi |
| 1201 Bartram Ave Darby, PA | 2.0 | 1.0 | 700 | $1,350 | $1.93 | 12d | 1 | 1.31mi |
| 1037 Laurel Rd Sharon Hill, PA | 2.0 | 1.0 | 655 | $1,195 | $1.82 | 45d | 1 | 1.36mi |
| 1012 Burnside Rd Sharon Hill, PA | 2.0 | 1.0 | 655 | $1,295 | $1.98 | 46d | 1 | 1.39mi |
| 943 South Ave Clifton Heights, PA | 1.0–2.0 | 1.0 | 662 | $1,305 | $1.97 | 4d | 10 | 1.46mi |
| 100 S Oak Ave Glenolden, PA | 1.0–2.0 | 1.0–2.0 | 830 | $1,215 | $1.46 | 0d | 3 | 1.47mi |
HOA detail condo
- Monthly dues
- $414 · $4,968/yr
- Likely covers
- pool
- Assessments
- None detected in remarks — confirm with the listing agent.
Listing history 22 events
-
2026-06-21days on market $94,900 Active 54 DOM
-
2026-06-18days on market $94,900 Active 51 DOM
-
2026-06-17days on market $94,900 Active 50 DOM
-
2026-06-16days on market $94,900 Active 49 DOM
-
2026-06-15days on market $94,900 Active 48 DOM
-
2026-06-13days on market $94,900 Active 46 DOM
-
2026-06-13days on market $94,900 Active 45 DOM
-
2026-06-09days on market $94,900 Active 42 DOM
-
2026-06-08days on market $94,900 Active 41 DOM
-
2026-06-07days on market $94,900 Active 40 DOM
-
2026-06-04days on market $94,900 Active 37 DOM
-
2026-06-03days on market $94,900 Active 36 DOM
-
2026-06-02days on market $94,900 Active 35 DOM
-
2026-06-01days on market $94,900 Active 34 DOM
-
2026-05-31days on market $94,900 Active 33 DOM
-
2026-04-28$94,900 Active 1780-char remark
-
2007-04-20soldstatus $476,951
-
2000-02-03soldstatus $100,000
-
2000-02-03soldstatus $80,000
-
1997-01-30historical
-
1996-01-30$29,900
-
1991-04-15soldstatus $143,000
ⓘ Source: listings_history table (triggers on properties + properties_extension) + one-shot
backfill from property_details.listing_events for pre-trigger history.
Tax reassessment forecast PA · Partial reset (capped growth)
- Current annual tax
- $1,863 · $155/mo
- Projected year-2 tax
- $1,863 · $155/mo
- Expected delta
- $0/yr ($0/mo · 0.0%)
ⓘ Screening estimate from a state-policy table — verify with the county assessor before closing.
Climate risk First Street
- Flood 1/10 Low FEMA zone X (unshaded) · 0% chance over 30 yrs
- Wildfire 1/10 Low
- Heat 7/10 Severe 7 d/yr ≥103°F today · 15 d/yr by 30 yrs out
- Wind 6/10 Major 27% chance of damaging wind over 30 yrs
- Air quality 4/10 Moderate 3 unhealthy d/yr today · 6 by 30 yrs out
Nearby sold comps map
Loading sold comps map…
Walkable amenities ~0.75 mi
Loading nearby amenities…
Taxation est. · year 1
- Rental income
- $15,254
- − Mortgage interest
- −$5,316
- − Property taxes
- −$1,863
- − Insurance
- −$474
- − Repairs & maintenance
- −$1,220
- − Management
- −$1,220
- − HOA
- −$4,968
- − Depreciation
- −$2,761
- Taxable loss
- −$2,568
- Est. tax savings @ 24.0%
- +$616
- After-tax cash flow
- $-610/yr
For passive investors: Depreciation is non-cash, so a rental often shows a tax loss while cash-flowing — sheltering income. Rental losses are passive: they offset passive income freely, and up to $25,000/yr can offset ordinary (W-2) income if you actively participate and your MAGI is under $100k (phasing out to $0 by $150k); unused losses carry forward. On sale, claimed depreciation is recaptured at up to 25%, and gains may owe capital-gains tax (a 1031 exchange can defer both). Figures are a year-1 estimate at your 24.0% rate — not tax advice; consult a CPA.
Schools (NCES district)
- District
- Interboro SD
- NCES district ID
- 4212170
- Math proficiency
- 25% ▼ -17.00%
- Reading proficiency
- 50% ▼ -16.00%
- Median HH income
- $56,802
- Composite
- 32.97/100
- National rank
- #5587
- State rank
- #369 of 539 in PA
Livability — Glenolden
- Score
- 85/100
- State rank
- #69
- US rank
- #481
Category grades
Schools grade is shown separately in the Schools card above.
Census & demographics
- Census place
- Glenolden, PA
- County
- Delaware County · 399,863 people
- City population
- 13,668
- Metro
- Philadelphia-Camden-Wilmington, PA-NJ-DE-MD
- Population (ZIP)
- 13,668
- Household income
- $79,144
- Rent vs Own
- Severe rent burden
- 383.0
Population outlook (Delaware County) Hauer SSP2
- Today (2025)
- 577,490 people
- By 2030
- 581,243 · +0.6%
- By 2040
- 584,700 · +1.2%
- By 2050
- 586,581 · +1.6%
- By 2075
- 598,706 · +3.7%
- By 2100
- 590,823 · +2.3%
Race, ethnicity, and origin ACS 2023
- Neighborhood character
- Predominantly White (71%)
- Race & ethnicity
- White 71% Black 18% Two or more races 6% Hispanic / Latino 4% Asian 1%
- Common ancestry
- Romanian 5% Lithuanian 2% Hispanic 1%
- Foreign-born
- 5% · Canada, China
- Languages at home
- 92% English-only · Other Indo-European 1% French/Haitian/Cajun 1% Spanish 1%
Political lean MEDSL · Delaware
- 2024 margin
- Strong D (+23.7) · D 61.4% · R 37.6% · Other 1.0%
- 2008→2024 swing
- +2.3pp toward D · 2008: 21.4pp · 2024: 23.7pp
- All cycles
- 2024: D+23.7 2020: D+26.7 2016: D+22.0 2012: D+21.8 2008: D+21.4
Not yet ingested
- Civics
- —
Market trends
- HPI YoY
- ▼ -218.04%
- Current HPI
- 267.7452
- Rent YoY
- —
- Metro
- Philadelphia-Camden-Wilmington, PA-NJ-DE-MD
- State GDP YoY
- ▲ 1.68%
- F500 in state
- 34
Industry mix (Fortune 500 HQ in PA)
| Industry | F500 HQs | Revenue |
|---|---|---|
| Healthcare | 2 | $309B |
|
||
| Insurance | 2 | $27B |
|
||
| Telecommunications / Media | 1 | $124B |
|
||
| Industrial Distribution | 1 | $22B |
|
||
| Financial Services | 1 | $20B |
|
||
| Chemicals / Materials | 1 | $18B |
|
||
Price history
-33.6% since first listed7 events — show timeline
- 2026-04-28 Listed $94,900 BRIGHT MLS
- 2007-04-20 Sold (Public Records) $476,951 Public Records
- 2000-02-03 Sold (Public Records) $80,000 Public Records
- 2000-02-03 Sold (Public Records) $100,000 Public Records
- 1997-01-30 Listing Removed — BRIGHT MLS
- 1996-01-30 Listed $29,900 BRIGHT MLS
- 1991-04-15 Sold (Public Records) $143,000 Public Records
Property tax history
+1.8%/yrLatest (2026): $1,863 · +39.3% YoY. Source: county tax records.
Cash-flow waterfall
monthlySold comps — $/sqft
last 12 mo · ≤1 miLoading sold comps…