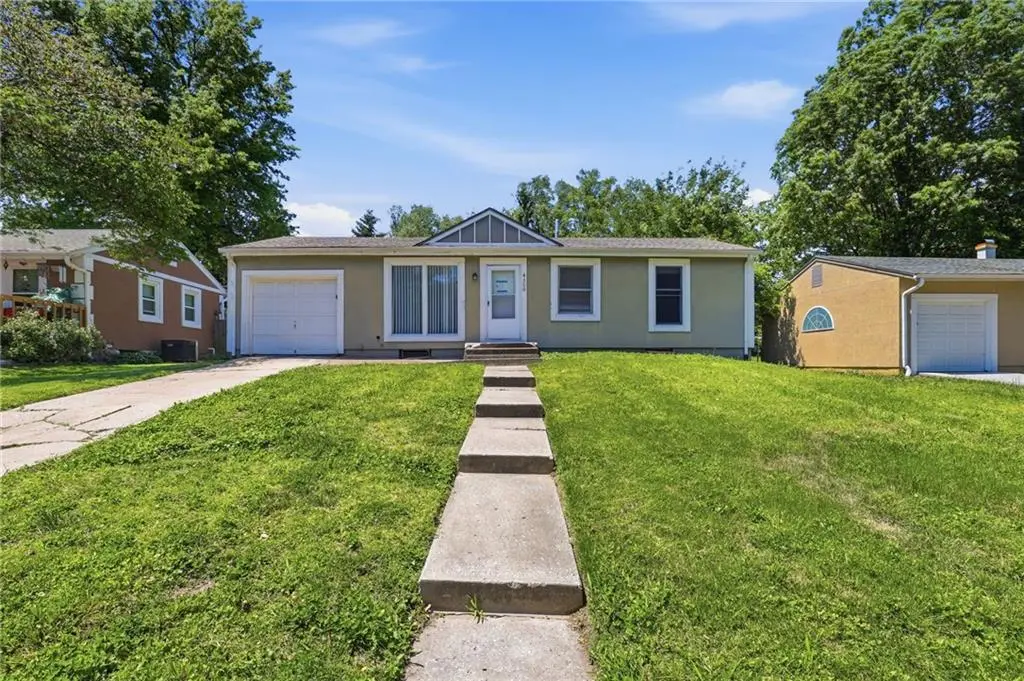
4300 S Liberty St · Independence, MO
Flood risk 1/10 · Minimal
- FEMA flood zone
- X (unshaded)
- Chance of flooding over 30 yrs
- 0.0%
- Est. flood insurance / yr
- $473 – $860
Fire risk 2/10 · Minimal
- Est. fire insurance / yr
- $1,054 – $1,958
Heat risk 4/10 · Minor
- Hot days now (above 107°F)
- 7 days/yr
- Hot days in 30 yrs
- 17 days/yr
Wind risk 2/10 · Minimal
- Chance of severe wind over 30 yrs
- —
Air-quality risk 3/10 · Minor
- Unhealthy air days now
- 3 days/yr
- Unhealthy air days in 30 yrs
- 3 days/yr
Risk factors via First Street. Map © Google.
Why this score? — see what drove the C- grade
The composite is a weighted blend of 9 inputs, each scored 0–100. Each bar is that input's sub-score; the figure is the points it added to the 100-point composite (weight × sub-score).
- Cash flow +17.4/30.0
- ARV discount +15.0/15.0
- DSCR +5.4/10.0
- Livability +4.1/5.0
- 1% rule +4.0/10.0
- Rent growth +3.8/5.0
- Schools +2.7/10.0
- Condition / age +2.5/5.0
- Appreciation +0.0/10.0
$159,999
🖨 Deal sheet 📄 Offer letter ✓ Due diligence
Listing remarks
Charming 1-story home featuring 3 bedrooms, 1 bathroom, and a 1-car garage with a functional layout designed for comfortable everyday living. The inviting living areas offer abundant natural light and create a warm, welcoming atmosphere throughout the home. The kitchen provides a practical setup with ample cabinet and counter space for meal preparation and dining. The bedrooms offer flexibility for guests, a home office, or hobbies. The functional floor plan and comfortable living spaces provide a great opportunity with plenty of potential to make this home your own. One or more photo(s) was virtually staged.
Key facts
- 7,894 sq ft lot
- Garage
- Built 1960
Property features AI
Finance
- Financial info: Annual tax amount reported
- HOA & community: No HOA fees
Exterior
- Parking: Attached garage (1 car)
- Utilities: Water: Other; Sewer: Other
- Home design: Single-family residence; Residential property; Ranch style
- Construction: Block construction; Composition roof
- Exterior features: Lot approximately 7,894 square feet
Interior
- Bedrooms: 3 bedrooms (all on the first floor)
- Bathrooms: 1 full bathroom
- Heating & cooling: Electric heating; Electric cooling (central)
- Interior features: Ranch floor plan; Full basement
Neighborhood map
What this means for you Summary
Snapshot
- This is a 3-bed/1.0-bath single-family listed at $160k.
Deal economics
- At list price, monthly cash flow is $119 ($1k/yr) — positive.
- The deal already cash-flows at list — no discount required.
- To meet the 1% rule (rent ≥ 1% of price), the offer needs to be $144k (10.0% below list).
- Recommended offer: $144k (10.0% below list) — sets the bar for 1% rule.
- Cap rate 7.2% vs local median 5.0% in Independence — top-decile yield for the area; either an underpriced asset or a hidden risk that comps aren't pricing in. Stress-test before assuming the spread holds.
Location & tenants
- Location reads 82/100 on livability (#10 in MO, #1,296 nationally) — a professional / high-income tenant draw. Strengths: amenities A+, commute A+, cost of living A+; Watch: employment D+, crime F.
- Independence 30 (suburban): math 26% / reading 38% proficiency, ranked #252 of 324 in MO (top 78%) — families likely to look elsewhere, expect single-tenant / working-renter base with shorter leases.
- Zoned schools: John W. Luff Elem. (math 52% / reading 57%, grade C, #190 of 1,115 statewide, top 19%, 354 students, 64% FRL); Truman High (math 18% / reading 34%, grade F, #430 of 521 statewide, top 83%, 1,662 students, 52% FRL) — zoned schools at 58% FRL track the district average.
- Market conditions: Rents rising fast (+5.1%/yr); 200 active listings in the ZIP; 5 comparable units currently listed for rent nearby; rentals at typical pace (median 16d on market — plan ~3-4 weeks tenant-placement turnaround); 4,002 units permitted in Jackson County in 2024 (2,271 in 5+ unit buildings).
Forward outlook
- Local home prices are declining (-3.0%/yr); year-one equity from $1k of loan paydown is wiped out by about $5k of value loss. Plan a longer hold.
- Jackson County population projected at +4% by 2050 — modest demand growth; plan on rents tracking national, not racing it.
Negotiation context
- It's been on market 34 days — a 3% lower offer ($155k) is reasonable based on typical stale-listing flexibility.
Questions for the listing agent
- It's been on market 34 days. Have you received any prior offers? Is the seller open to a 10% concession, seller financing, or rate buy-down credit?
- Built in 1960 — when were the roof, HVAC, electrical panel, plumbing, and water heater last replaced?
- Is there a deadline driving the sale (1031 exchange, divorce, estate, relocation)? That informs how much negotiation room exists.
- Crime grade is F in this area — have there been break-ins, vandalism, or insurance claims at this property in the last 3 years? What carrier currently insures it and at what premium?
- What's the average days-on-market for RENTAL listings here right now (not sales)? A rising rental-DOM trend means longer vacancies and softer asking-rent achievability than the comps imply.
- What's the recent tenant-quality profile in this submarket — average credit score on applications, eviction rate, late-payment / NSF rate, and stable-employment percentage? A property-management company in the area should have these aggregated.
- How much new for-sale + rental construction is in the pipeline within 1–3 miles? Heavy new supply typically softens prices + rents 12–24 months out; constrained supply supports both.
Investment metrics
- 1% rule
- 0.90% ✗
- Cap rate
- 7.19%
- Cash-on-cash
- 3.19%
- DSCR
- 1.14
- GRM
- 9.3
CMA / ARV
- ARV (median comp)
- $206,971
- List price
- $159,999
- Delta
- -20.28%
- Verdict
- UNDERPRICED
- Comps
- 20 within 1.0 mi
Show comp detail 12 sales within ~0.75 mi
| Address | Dist | Beds/Ba | Sqft | Sold | Price | $/sf | Match |
|---|---|---|---|---|---|---|---|
| 13804 E 43rd St S | 0.09mi | 3/1.0 | 864 (0%) | 1mo | $150,000 | $174 | 95 |
| 4305 S Main St | 0.08mi | 3/1.0 | 864 (0%) | 3mo | $169,000 | $196 | 94 |
| 4324 S Main St | 0.09mi | 3/1.0 | 864 (0%) | 9mo | $109,900 | $127 | 88 |
| 4319 S Liberty St | 0.07mi | 3/1.0 | 864 (0%) | 11mo | $169,000 | $196 | 88 |
| 13704 E 41st Ter S | 0.33mi | 3/1.0 | 888 (+3%) | 2mo | $175,000 | $197 | 78 |
| 13712 E 39th St S | 0.55mi | 3/1.0 | 877 (+2%) | 12mo | $197,000 | $225 | 62 |
| 3812 S Main St | 0.62mi | 2/1.0 (-1) | 878 (+2%) | 2mo | $169,000 | $192 | 62 |
| 13411 E 39th St | 0.58mi | 3/1.0 | 819 (-5%) | 4mo | $189,000 | $231 | 61 |
| 3936 S Pleasant St S | 0.50mi | 3/1.0 | 936 (+8%) | 6mo | $135,000 | $144 | 58 |
| 3904 S Main St | 0.50mi | 3/1.0 | 950 (+10%) | 12mo | $215,000 | $226 | 50 |
| 4217 S Pleasant St | 0.25mi | 2/2.0 (-1) | 944 (+9%) | 17mo | $175,000 | $185 | 50 |
| 3919 S Lynn St | 0.48mi | 3/1.5 | 988 (+14%) | 8mo | $190,000 | $192 | 45 |
Match score weights: distance 35% · size 25% · config 20% · recency 20%. Top-matched comps best support the ARV.
Projected returns pro-forma
-3.0% appreciation · 5.09% rent growth · sell at horizon
- IRR
- -9.1%
- Equity multiple
- 0.66×
- Total profit
- $-15,281
- Equity at exit
- $23,856
- IRR
- 2.7%
- Equity multiple
- 1.21×
- Total profit
- $9,567
- Equity at exit
- $13,834
Cash invested: $44,800 (down + closing). Projections, not guarantees.
Landlord ↔ Tenant lean methodology
- Overall (STATE)
- 81 Strongly Landlord-Friendly
- State Missouri
- 81 Strongly Landlord-Friendly · R+10
- County
- — inherits STATE
- City
- — inherits STATE
ZIP-level market 64055
- Rents YoY
- 5.1%
- Active inventory
- 200
- Price-to-rent
- 9.3×
Monthly cashflow live
- Estimated rent
- $1,439 high interval (Pro) →
- Mortgage (P&I)
- −$839
- Tax from tax record
- −$112 /mo · $1,347/yr
- Insurance
- −$67
- HOA
- −$0
- Vacancy / Maint / Mgmt
- −$302
- Net cashflow
- $119
Break-even live
UW: 25.0% down · 7.5% · 30yr · 1.5% tax · 5.0% vac · 8.0% maint · 8.0% mgmt
Financing live
Cash to close
- Down payment
- $40,000
- Closing costs
- $4,800
- Reserves months
- —
- Total cash needed
- —
Loan-product check · same deal, 3 products live
Conventional
25% down · 7.5% · 30yr
- Down + closing
- —
- Monthly P&I
- —
- Monthly cashflow
- —
- DSCR
- —
- Eligible?
- —
Personal DTI + credit; lowest rate.
DSCR
20% down · 8.5% · 30yr
- Down + closing
- —
- Monthly P&I
- —
- Monthly cashflow
- —
- DSCR
- —
- Eligible?
- —
No personal income docs; deal must DSCR.
Hard money
10% down · 12.0% · 12mo
- Down + closing
- —
- Monthly P&I
- —
- Monthly cashflow
- —
- DSCR
- —
- Eligible?
- —
Short-term bridge; refi at stabilization.
Rent comps 5 comps
| Address | Beds | Baths | Sqft | Rent | $/sqft | DOM | Units | Dist |
|---|---|---|---|---|---|---|---|---|
| 13511 E 41st Ter S Independence, MO | 3.0 | 2.0 | 925 | $1,530 | $1.65 | 23d | 1 | 0.27mi |
| 12817 E 47th St S Independence, MO | 2.0–3.0 | 1.0–2.0 | 1000 | $1,193 | $1.19 | 16d | 1 | 0.74mi |
| 12502 E 40th St S Unit C Independence, MO | 2.0 | 1.5 | 950 | $975 | $1.03 | 4d | 1 | 0.78mi |
| 3551 S Lynn St Unit 3551 Independence, MO | 2.0 | 1.0 | 850 | $899 | $1.06 | 43d | 1 | 0.83mi |
| 3100 Quail Creek Dr Independence, MO | 1.0–2.0 | 1.0 | 961 | $1,330 | $1.38 | 12d | 1 | 1.34mi |
Listing history 17 events
-
2026-06-18price $159,999 Active 34 DOM
-
2026-06-18days on market $164,999 Active 34 DOM
-
2026-06-17days on market $164,999 Active 33 DOM
-
2026-06-16days on market $164,999 Active 32 DOM
-
2026-06-15days on market $164,999 Active 31 DOM
-
2026-06-13days on market $164,999 Active 29 DOM
-
2026-06-09days on market $164,999 Active 25 DOM
-
2026-06-08days on market $164,999 Active 24 DOM
-
2026-06-07days on market $164,999 Active 23 DOM
-
2026-06-05pricedays on market $164,999 Active 20 DOM
-
2026-06-03days on market $175,000 Active 19 DOM
-
2026-06-02days on market $175,000 Active 18 DOM
-
2026-06-01days on market $175,000 Active 17 DOM
-
2026-05-31days on market $175,000 Active 16 DOM
-
2026-05-15$175,000 Active 616-char remark
-
1998-01-20soldstatus
-
1984-09-01soldstatus
ⓘ Source: listings_history table (triggers on properties + properties_extension) + one-shot
backfill from property_details.listing_events for pre-trigger history.
Tax reassessment forecast MO · Resets to sale price
- Current annual tax
- $1,347 · $112/mo
- Projected year-2 tax
- $1,552 · $129/mo
- Expected delta
- +$205/yr (+$17/mo · 15.2%)
ⓘ Screening estimate from a state-policy table — verify with the county assessor before closing.
Climate risk First Street
- Flood 1/10 Low FEMA zone X (unshaded) · 0% chance over 30 yrs
- Wildfire 2/10 Low
- Heat 4/10 Moderate 7 d/yr ≥107°F today · 17 d/yr by 30 yrs out
- Wind 2/10 Low
- Air quality 3/10 Moderate 3 unhealthy d/yr today · 3 by 30 yrs out
Nearby sold comps map
Loading sold comps map…
Walkable amenities ~0.75 mi
Loading nearby amenities…
Taxation est. · year 1
- Rental income
- $17,272
- − Mortgage interest
- −$8,962
- − Property taxes
- −$1,347
- − Insurance
- −$800
- − Repairs & maintenance
- −$1,382
- − Management
- −$1,382
- − Depreciation
- −$4,655
- Taxable loss
- −$1,255
- Est. tax savings @ 24.0%
- +$301
- After-tax cash flow
- $1,731/yr
For passive investors: Depreciation is non-cash, so a rental often shows a tax loss while cash-flowing — sheltering income. Rental losses are passive: they offset passive income freely, and up to $25,000/yr can offset ordinary (W-2) income if you actively participate and your MAGI is under $100k (phasing out to $0 by $150k); unused losses carry forward. On sale, claimed depreciation is recaptured at up to 25%, and gains may owe capital-gains tax (a 1031 exchange can defer both). Figures are a year-1 estimate at your 24.0% rate — not tax advice; consult a CPA.
Schools (NCES district)
- District
- Independence 30
- NCES district ID
- 2915480
- Math proficiency
- 26% ▼ -8.00%
- Reading proficiency
- 38% ▼ -5.00%
- Median HH income
- $41,843
- Composite
- 27.04/100
- National rank
- #7054
- State rank
- #252 of 324 in MO
Livability — Independence
- Score
- 82/100
- State rank
- #10
- US rank
- #1296
Category grades
Schools grade is shown separately in the Schools card above.
Census & demographics
- Census place
- Independence, MO
- County
- Jackson County · 687,798 people
- City population
- 117,675
- Metro
- Kansas City, MO-KS
- Population (ZIP)
- 35,960
- Household income
- $62,439
- Rent vs Own
- Severe rent burden
- 1404.0
Population outlook (Jackson County) Hauer SSP2
- Today (2025)
- 719,589 people
- By 2030
- 731,456 · +1.6%
- By 2040
- 746,689 · +3.8%
- By 2050
- 749,289 · +4.1%
- By 2075
- 736,227 · +2.3%
- By 2100
- 668,210 · -7.1%
Race, ethnicity, and origin ACS 2023
- Neighborhood character
- Predominantly White (71%)
- Race & ethnicity
- White 71% Black 13% Hispanic / Latino 10% Two or more races 8% Asian 1%
- Hispanic origin (detail)
- Mexican 7% Puerto Rican 2%
- Common ancestry
- Italian 9% Lithuanian 2% Slovak 2%
- Foreign-born
- 4% · Canada
- Languages at home
- 94% English-only · Spanish 4%
Political lean MEDSL · Jackson
- 2024 margin
- D (+19.3) · D 58.9% · R 39.5% · Other 1.6%
- 2008→2024 swing
- -6.1pp toward R · 2008: 25.4pp · 2024: 19.3pp
- All cycles
- 2024: D+19.3 2020: D+22.0 2016: D+16.6 2012: D+19.0 2008: D+25.4
Not yet ingested
- Civics
- —
Market trends
- HPI YoY
- ▼ -180.54%
- Current HPI
- 245.3636
- Rent YoY
- ▲ 5.09%
- Metro
- Kansas City, MO-KS
- State GDP YoY
- ▲ 1.84%
- F500 in state
- 20
Industry mix (Fortune 500 HQ in MO)
| Industry | F500 HQs | Revenue |
|---|---|---|
| Healthcare | 1 | $163B |
|
||
| Insurance | 1 | $21B |
|
||
| Industrial Technology | 1 | $17B |
|
||
| Retail | 1 | $16B |
|
||
| Industrial Distribution | 1 | $10B |
|
||
| Utilities | 1 | $9B |
|
||
Price history
-5.7% since first listed4 events — show timeline
- 2026-06-03 Price Changed $164,999 Heartland MLS as Distributed by MLS Grid
- 2026-05-15 Listed $175,000 Heartland MLS as Distributed by MLS Grid
- 1998-01-20 Sold (Public Records) — Public Records
- 1984-09-01 Sold (Public Records) — Public Records
Property tax history
-2.4%/yrLatest (2025): $1,347 · +2.5% YoY. Source: county tax records.
Cash-flow waterfall
monthlySold comps — $/sqft
last 12 mo · ≤1 miLoading sold comps…