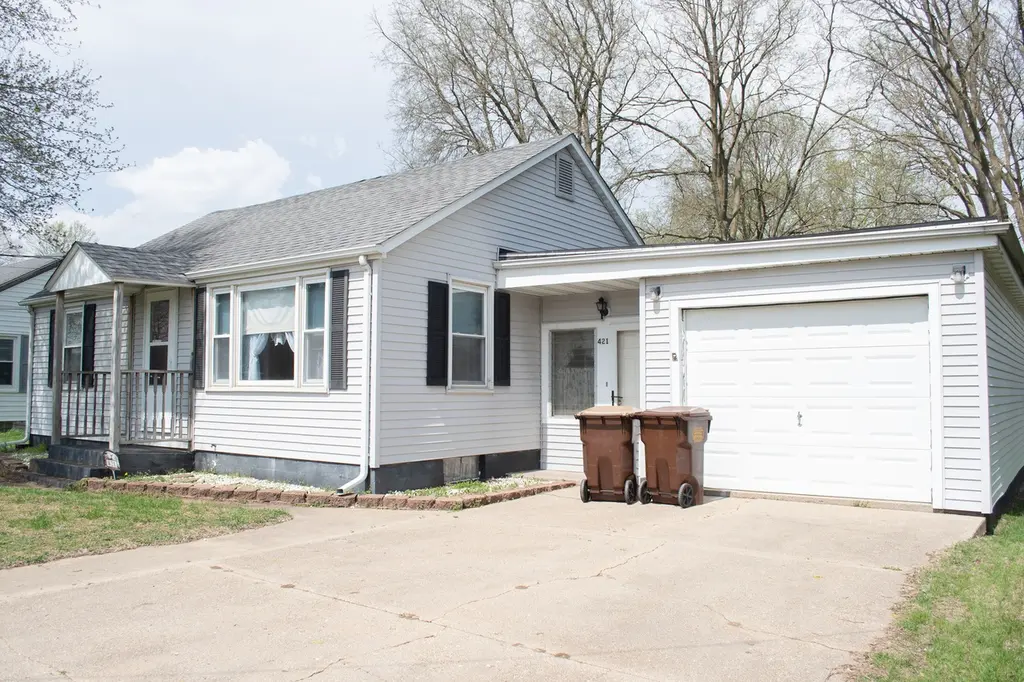
421 7th Ave · Erie, IL
Flood risk 3/10 · Minor
- FEMA flood zone
- X (shaded)
- Chance of flooding over 30 yrs
- 0.2%
- Est. flood insurance / yr
- $473 – $860
Fire risk 3/10 · Minor
- Est. fire insurance / yr
- $804 – $1,492
Heat risk 3/10 · Minor
- Hot days now (above 105°F)
- 7 days/yr
- Hot days in 30 yrs
- 16 days/yr
Wind risk 2/10 · Minimal
- Chance of severe wind over 30 yrs
- —
Air-quality risk 3/10 · Minor
- Unhealthy air days now
- 2 days/yr
- Unhealthy air days in 30 yrs
- 3 days/yr
Risk factors via First Street. Map © Google.
Why this score? — see what drove the C grade
The composite is a weighted blend of 9 inputs, each scored 0–100. Each bar is that input's sub-score; the figure is the points it added to the 100-point composite (weight × sub-score).
- Cash flow +26.8/30.0
- DSCR +9.2/10.0
- 1% rule +6.2/10.0
- ARV discount +5.0/15.0
- Livability +3.6/5.0
- Schools +3.2/10.0
- Rent growth +2.5/5.0
- Condition / age +2.5/5.0
- Appreciation +0.0/10.0
$80,000
🖨 Deal sheet 📄 Offer letter ✓ Due diligence
Listing remarks
This charming ranch-style home offers easy one-level living with 2 bedrooms and 1 full bath. Sitting on a 0.25-acre lot, there's plenty of space to enjoy the outdoors-plus the backyard backs up to a cornfield, giving you extra privacy and peaceful views. The full basement has potential to finish and add more living space. You'll also love the added security of a whole house generator. Located right next to the schools, this home is in a super convenient spot while still feeling tucked away. Whether you're looking for a starter home, downsizing, or an investment opportunity, this property offers solid value with the chance to make it your own.
Key facts
- Full basement
- Next to schools
- One level living
Tags
Neighborhood map
What this means for you Summary
Snapshot
- This is a 2-bed/1.0-bath single-family listed at $80k.
Deal economics
- At list price, monthly cash flow is $218 ($3k/yr) — positive.
- The deal already cash-flows at list — no discount required.
- Meets the 1% rule at list price ($892 rent vs $80k).
Location & tenants
- Location reads 72/100 on livability (#300 in IL) — a middle-class / working-renter tenant base. Strengths: crime A+, employment A+, cost of living A+; Watch: amenities F, commute F, health & safety F.
- Erie CUSD 1 (rural): math 35% / reading 38% proficiency, ranked #167 of 620 in IL (top 27%) — families likely to look elsewhere, expect single-tenant / working-renter base with shorter leases.
- Zoned schools: Erie Elem School (math 37% / reading 27%, grade F, #586 of 2,056 statewide, top 31%, 246 students, 0% FRL); Erie Middle School (math 37% / reading 47%, grade D-, #116 of 665 statewide, top 19%, 176 students, 0% FRL); Erie High School (math 34% / reading 34%, grade F, #126 of 693 statewide, top 21%, 184 students, 0% FRL) — zoned schools average 0% FRL vs 24% district-wide (24 pts lower); this property's tenant base skews higher-income than the district average.
- Market conditions: 20 active listings in the ZIP; 19 units permitted in Whiteside County in 2024 (0 in 5+ unit buildings).
Forward outlook
- Local home prices are declining (-3.0%/yr); year-one equity from $553 of loan paydown is wiped out by about $2k of value loss. Plan a longer hold.
- Whiteside County population projected at -21% by 2050 — secular population decline; favor cash flow + early exit over multi-decade hold.
- At projected returns (-3.0% appreciation + 3.0% rent growth), your $22k cash investment doubles in ~10 years — after that, you're playing with house money.
Negotiation context
- Only 2 days on market — expect competitive offers; lowballing is unlikely to land.
Risks & watch-outs
- Watch-outs: built in 1952 — expect roof / HVAC / electrical / plumbing capex.
Questions for the listing agent
- Built in 1952 — when were the roof, HVAC, electrical panel, plumbing, and water heater last replaced?
- Is there a deadline driving the sale (1031 exchange, divorce, estate, relocation)? That informs how much negotiation room exists.
- Schools are B-rated — typically a magnet for longer-tenancy family renters. What's the average tenant stay here, and is there a school-zone premium baked into asking?
- What's the average days-on-market for RENTAL listings here right now (not sales)? A rising rental-DOM trend means longer vacancies and softer asking-rent achievability than the comps imply.
- What's the recent tenant-quality profile in this submarket — average credit score on applications, eviction rate, late-payment / NSF rate, and stable-employment percentage? A property-management company in the area should have these aggregated.
- How much new for-sale + rental construction is in the pipeline within 1–3 miles? Heavy new supply typically softens prices + rents 12–24 months out; constrained supply supports both.
Investment metrics
- 1% rule
- 1.12% ✓
- Cap rate
- 9.56%
- Cash-on-cash
- 11.68%
- DSCR
- 1.52
- GRM
- 7.5
CMA / ARV
- ARV (on-the-fly)
- $75,845
- Comps found
- 2
Show comp detail 2 sales within ~0.75 mi
| Address | Dist | Beds/Ba | Sqft | Sold | Price | $/sf | Match |
|---|---|---|---|---|---|---|---|
| 421 7th Ave | 0.00mi | 2/1.0 | 985 (0%) | 1mo | $76,000 | $77 | 99 |
| 828 Main St | 0.39mi | 3/1.0 (+1) | 944 (-4%) | 7mo | $60,000 | $64 | 64 |
Match score weights: distance 35% · size 25% · config 20% · recency 20%. Top-matched comps best support the ARV.
Projected returns pro-forma
-3.0% appreciation · 3.0% rent growth · sell at horizon
- IRR
- 1.0%
- Equity multiple
- 1.04×
- Total profit
- $898
- Equity at exit
- $11,928
- IRR
- 10.6%
- Equity multiple
- 1.83×
- Total profit
- $18,555
- Equity at exit
- $6,917
Cash invested: $22,400 (down + closing). Projections, not guarantees.
Landlord ↔ Tenant lean methodology
- Overall (STATE)
- 43 Moderately Tenant-Leaning
- State Illinois
- 43 Moderately Tenant-Leaning · D+7
- County
- — inherits STATE
- City
- — inherits STATE
ZIP-level market 61250
- Home prices YoY
- -27.9%
- Active inventory
- 20
- Price-to-rent
- 7.5×
Monthly cashflow live
- Estimated rent
- $892 medium interval (Pro) →
- Mortgage (P&I)
- −$420
- Tax from tax record
- −$34 /mo · $407/yr
- Insurance
- −$33
- HOA
- −$0
- Vacancy / Maint / Mgmt
- −$187
- Net cashflow
- $218
Break-even live
UW: 25.0% down · 7.5% · 30yr · 1.5% tax · 5.0% vac · 8.0% maint · 8.0% mgmt
Financing live
Cash to close
- Down payment
- $20,000
- Closing costs
- $2,400
- Reserves months
- —
- Total cash needed
- —
Loan-product check · same deal, 3 products live
Conventional
25% down · 7.5% · 30yr
- Down + closing
- —
- Monthly P&I
- —
- Monthly cashflow
- —
- DSCR
- —
- Eligible?
- —
Personal DTI + credit; lowest rate.
DSCR
20% down · 8.5% · 30yr
- Down + closing
- —
- Monthly P&I
- —
- Monthly cashflow
- —
- DSCR
- —
- Eligible?
- —
No personal income docs; deal must DSCR.
Hard money
10% down · 12.0% · 12mo
- Down + closing
- —
- Monthly P&I
- —
- Monthly cashflow
- —
- DSCR
- —
- Eligible?
- —
Short-term bridge; refi at stabilization.
Listing history 2 events
-
2026-04-24status Pending
-
2026-04-21$80,000 Active
ⓘ Source: listings_history table (triggers on properties + properties_extension) + one-shot
backfill from property_details.listing_events for pre-trigger history.
Tax reassessment forecast IL · Partial reset (capped growth)
- Current annual tax
- $407 · $34/mo
- Projected year-2 tax
- $1,112 · $93/mo
- Expected delta
- +$704/yr (+$59/mo · 172.9%)
ⓘ Screening estimate from a state-policy table — verify with the county assessor before closing.
Climate risk First Street
- Flood 3/10 Moderate FEMA zone X (shaded) · 20% chance over 30 yrs
- Wildfire 3/10 Moderate
- Heat 3/10 Moderate 7 d/yr ≥105°F today · 16 d/yr by 30 yrs out
- Wind 2/10 Low
- Air quality 3/10 Moderate 2 unhealthy d/yr today · 3 by 30 yrs out
Nearby sold comps map
Loading sold comps map…
Walkable amenities ~0.75 mi
Loading nearby amenities…
Taxation est. · year 1
- Rental income
- $10,707
- − Mortgage interest
- −$4,481
- − Property taxes
- −$407
- − Insurance
- −$400
- − Repairs & maintenance
- −$857
- − Management
- −$857
- − Depreciation
- −$2,327
- Taxable income
- $1,378
- Est. tax owed @ 24.0%
- −$331
- After-tax cash flow
- $2,286/yr
For passive investors: Depreciation is non-cash, so a rental often shows a tax loss while cash-flowing — sheltering income. Rental losses are passive: they offset passive income freely, and up to $25,000/yr can offset ordinary (W-2) income if you actively participate and your MAGI is under $100k (phasing out to $0 by $150k); unused losses carry forward. On sale, claimed depreciation is recaptured at up to 25%, and gains may owe capital-gains tax (a 1031 exchange can defer both). Figures are a year-1 estimate at your 24.0% rate — not tax advice; consult a CPA.
Schools (NCES district)
- District
- Erie CUSD 1
- NCES district ID
- 1714350
- Math proficiency
- 35% ▼ -8.00%
- Reading proficiency
- 38% ▼ -17.00%
- Median HH income
- $57,258
- Composite
- 32.28/100
- National rank
- #5752
- State rank
- #167 of 620 in IL
Livability — Erie
- Score
- 72/100
- State rank
- #300
- US rank
- #5810
Category grades
Schools grade is shown separately in the Schools card above.
Census & demographics
- Census place
- Erie, IL
- Population (ZIP)
- 2,843
Population outlook (Whiteside County) Hauer SSP2
- Today (2025)
- 53,736 people
- By 2030
- 51,657 · -3.9%
- By 2040
- 47,169 · -12.2%
- By 2050
- 42,613 · -20.7%
- By 2075
- 32,691 · -39.2%
- By 2100
- 22,638 · -57.9%
Race, ethnicity, and origin ACS 2023
- Neighborhood character
- Predominantly White (96%)
- Race & ethnicity
- White 96% Two or more races 3%
- Common ancestry
- Iranian 7% English 3% Scottish 2%
- Foreign-born
- 0%
Political lean MEDSL · Whiteside
- 2024 margin
- R (+14.7) · D 41.7% · R 56.4% · Other 2.0%
- 2008→2024 swing
- -32.3pp toward R · 2008: 17.6pp · 2024: -14.7pp
- All cycles
- 2024: R+14.7 2020: R+8.3 2016: R+6.3 2012: D+17.3 2008: D+17.6
Not yet ingested
- Civics
- —
Market trends
- HPI YoY
- ▼ -57.73%
- Current HPI
- 149.049
- Rent YoY
- —
- Metro
- —
- State GDP YoY
- ▲ 1.59%
- F500 in state
- 60
Industry mix (Fortune 500 HQ in IL)
| Industry | F500 HQs | Revenue |
|---|---|---|
| Insurance | 4 | $201B |
|
||
| Consumer Goods | 4 | $87B |
|
||
| Industrial Machinery | 3 | $64B |
|
||
| Healthcare | 2 | $55B |
|
||
| Retail / Pharmacy | 1 | $148B |
|
||
| Agriculture / Food | 1 | $86B |
|
||
Price history
2 events — show timeline
- 2026-04-24 Pending — MRED as Distributed by MLS Grid
- 2026-04-21 Listed $80,000 MRED as Distributed by MLS Grid
Property tax history
-0.2%/yrLatest (2024): $407 · -0.2% YoY. Source: county tax records.
Cash-flow waterfall
monthlySold comps — $/sqft
last 12 mo · ≤1 miLoading sold comps…