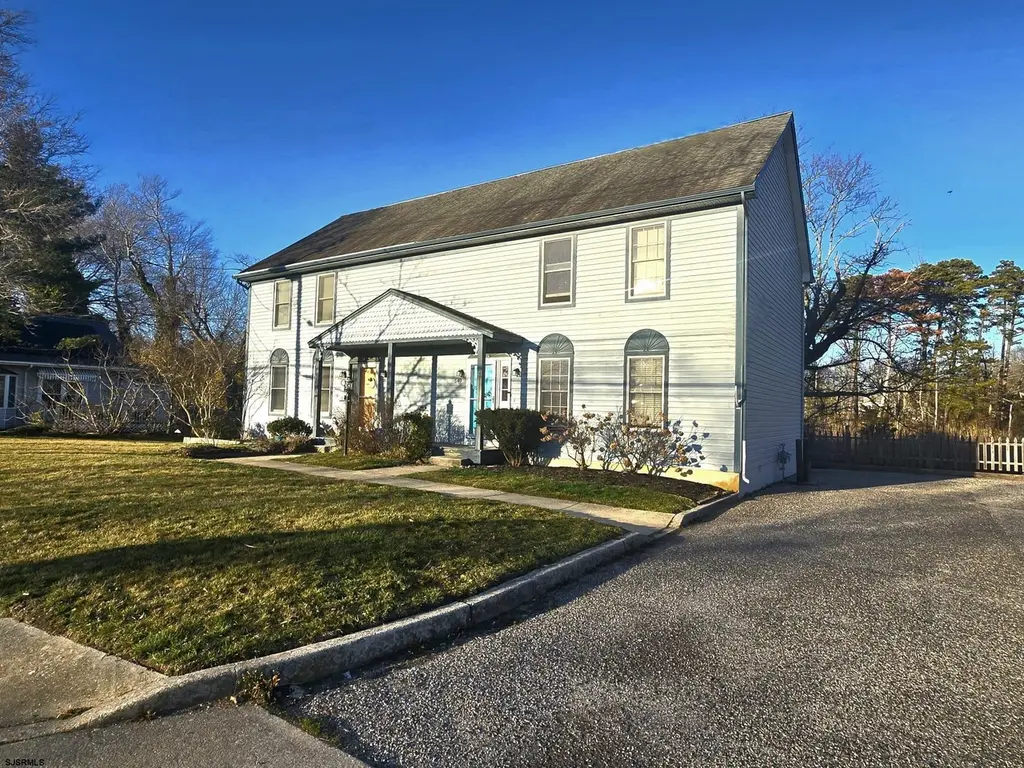
540 W Ocean Heights Ave # B Ave #540 W · Linwood, NJ
Flood risk 9/10 · Severe
- FEMA flood zone
- AE
- Chance of flooding over 30 yrs
- 0.99%
- Est. flood insurance / yr
- $1,737 – $8,500
Fire risk 4/10 · Minor
- Est. fire insurance / yr
- $526 – $976
Heat risk 8/10 · Major
- Hot days now (above 98°F)
- 7 days/yr
- Hot days in 30 yrs
- 16 days/yr
Wind risk 8/10 · Major
- Chance of severe wind over 30 yrs
- 80.0%
Air-quality risk 2/10 · Minimal
- Unhealthy air days now
- 1 days/yr
- Unhealthy air days in 30 yrs
- 2 days/yr
Risk factors via First Street. Map © Google.
Why this score? — see what drove the D+ grade
The composite is a weighted blend of 9 inputs, each scored 0–100. Each bar is that input's sub-score; the figure is the points it added to the 100-point composite (weight × sub-score).
- Cash flow +17.5/30.0
- ARV discount +7.5/15.0
- 1% rule +5.7/10.0
- DSCR +5.5/10.0
- Schools +5.0/10.0
- Livability +3.8/5.0
- Rent growth +2.5/5.0
- Condition / age +2.5/5.0
- Appreciation +0.0/10.0
$374,900
🖨 Deal sheet (PDF) 📄 Offer letter ✓ Due diligence
Listing remarks MLS
Rare opportunity to own a 3-bedroom, 2.5-bath townhome in a highly desirable mainland location. This home offers a spacious layout with comfortable living and dining areas, second-floor laundry, central air, and gas heat. Conveniently located within walking distance to shopping, dining, banks, and everyday amenities, and within a highly regarded school district. A great opportunity to enjoy comfort and convenience in a prime location. Schedule your private showing today.
Key facts
- $170 HOA
- 2 garage spots
- Listed 99 days
Property features AI
Finance
- HOA & community: Monthly association fee ($170) covering management and maintenance; Association-managed
Exterior
- Parking: Assigned exterior parking for two cars; Two-car garage
- Utilities: Public water; Public sewer; Gas water heater
- Home design: Condo unit in Linwood Mews; 2-story unit with 2 levels; Unit location: Other (see remarks)
- Construction: Cedar and vinyl exterior
- Exterior features: Cedar and vinyl siding; Deck/porch; Pets allowed; Not waterfront
Interior
- Kitchen: Gas stove; Refrigerator
- Bedrooms: All bedrooms on upper level (3 bedrooms)
- Bathrooms: Two full bathrooms; One half bathroom
- Heating & cooling: Central air (electric); Forced air heating (natural gas)
- Interior features: Kitchen center island; Master bath; Dining room; Eat-in kitchen; Storage attic
- Laundry & utility: Washer; Dryer; Laundry/utility room
Neighborhood map
What this means for you Summary
Snapshot
- This is a 3-bed/2.5-bath condo listed at $375k.
Deal economics
- At list price, monthly cash flow is $-141 ($-2k/yr) — negative.
- To cash-flow at today's rent, offer at most $350k (6.6% below list).
- Meets the 1% rule at list price ($4k rent vs $375k).
- Recommended offer: $341k (9.0% below list) — sets the bar for market timing.
- Cap rate 7.2% vs local median 1.6% in Linwood — top-decile yield for the area; either an underpriced asset or a hidden risk that comps aren't pricing in. Stress-test before assuming the spread holds.
Location & tenants
- Location reads 76/100 on livability (#139 in NJ, #3,693 nationally) — a middle-class / working-renter tenant base. Strengths: schools A+, crime A+, employment A+; Watch: amenities F, commute F, cost of living F.
- Linwood City School District (suburban): math 41% / reading 68% proficiency, ranked #90 of 472 in NJ (top 19%) — acceptable for families but not a draw, mixed tenant base, ~2y average lease; only 5% free/reduced lunch — higher-income household profile.
- Market conditions: 90 active listings in the ZIP; 1 comparable units currently listed for rent nearby; 672 units permitted in Atlantic County in 2024 (258 in 5+ unit buildings).
Forward outlook
- Local home prices are declining (-3.0%/yr); year-one equity from $3k of loan paydown is wiped out by about $11k of value loss. Plan a longer hold.
- Atlantic County population projected at -12% by 2050 — secular population decline; favor cash flow + early exit over multi-decade hold.
Negotiation context
- It's been on market 100 days — a 9% lower offer ($341k) is reasonable based on typical stale-listing flexibility.
- 2 sale attempts with the ask held roughly flat each time — persistent listings suggest the price (not the market) is what's stuck; bring a comps-based counter.
- Current owner paid $235k; list at $375k implies a 60% gain — meaningful room to come down on a strong offer.
Risks & watch-outs
- Watch-outs: flood insurance adds $427/mo.
- Climate carrying-cost: in FEMA flood zone AE (mandatory federal flood insurance); severe wind risk, 80% chance of damaging wind over 30y; extreme-heat days projected 7→16/yr by 2055 (HVAC capex compounding) — expect insurance premiums to compound above CPI over the hold.
Questions for the listing agent
- What do current leases actually rent for vs. the listed asking? Can we see a recent rent roll and the last 12 months of T-12 income?
- It's been on market 100 days. Have you received any prior offers? Is the seller open to a 9% concession, seller financing, or rate buy-down credit?
- What's the actual annual flood-insurance premium (NFIP or private), and is the property in a SFHA with mandatory coverage?
- What does the HOA fee cover, when was the last increase, and are there any pending special assessments or reserve-fund shortfalls?
- Any open or pending special assessments — roof, HVAC, plumbing, elevator, façade? What's the per-unit balance and payoff schedule, and is the seller paying it off at close or rolling it to the buyer?
- Why hasn't it sold? Are there any deal-killer items the seller is aware of (foundation, flood, title, zoning, code violations)?
- Is there a deadline driving the sale (1031 exchange, divorce, estate, relocation)? That informs how much negotiation room exists.
- Schools are A-rated — typically a magnet for longer-tenancy family renters. What's the average tenant stay here, and is there a school-zone premium baked into asking?
- The area grade is low — what's the realistic commute time and amenity access for the typical tenant pool here? Any planned neighborhood developments (good or bad) we should know about?
- What's the average days-on-market for RENTAL listings here right now (not sales)? A rising rental-DOM trend means longer vacancies and softer asking-rent achievability than the comps imply.
- What's the recent tenant-quality profile in this submarket — average credit score on applications, eviction rate, late-payment / NSF rate, and stable-employment percentage? A property-management company in the area should have these aggregated.
- How much new apartment / multifamily construction is in the pipeline within 1–3 miles? Heavy new supply (>2% of stock underway) typically softens rents 12–24 months out; light construction supports rent growth.
Investment metrics
- 1% rule
- 1.07% ✓
- Cap rate
- 7.21%
- Cash-on-cash
- 3.27%
- DSCR
- 1.15
- GRM
- 7.8
CMA / ARV
No comps found within radius.
Projected returns pro-forma
-3.0% appreciation · 3.0% rent growth · sell at horizon
- IRR
- -18.8%
- Equity multiple
- 0.34×
- Total profit
- $-69,207
- Equity at exit
- $55,899
- IRR
- -10.9%
- Equity multiple
- 0.34×
- Total profit
- $-69,777
- Equity at exit
- $32,415
Cash invested: $104,972 (down + closing). Projections, not guarantees.
Landlord ↔ Tenant lean methodology
- Overall (STATE)
- 21 Tenant-Leaning
- State New Jersey
- 21 Tenant-Leaning · D+6
- County
- — inherits STATE
- City
- — inherits STATE
ZIP-level market 08221
- Active inventory
- 90
- Price-to-rent
- 7.8×
Monthly cashflow live
- Estimated rent
- $4,000 medium interval (Pro) →
- Mortgage (P&I)
- −$1,966
- Tax from tax record
- −$582 /mo · $6,982/yr
- Insurance
- −$156
- Flood insurance flood zone
- −$427 /mo · $5,118/yr
- HOA
- −$170
- Vacancy / Maint / Mgmt
- −$840
- Net cashflow
- $-141
Break-even live
Sensitivity live
| Price | -10% $72 | -5% $-34 | +0% $-141 | +5% $-247 | +10% $-353 |
|---|---|---|---|---|---|
| Rent | -10% $-457 | -5% $-299 | +0% $-141 | +5% $17 | +10% $175 |
| Rate | -1.0pp $48 | -0.5pp $-45 | base $-141 | +0.5pp $-238 | +1.0pp $-337 |
UW: 25.0% down · 7.5% · 30yr · 1.5% tax · 5.0% vac · 8.0% maint · 8.0% mgmt
Financing live
Cash to close
- Down payment
- $93,725
- Closing costs
- $11,247
- Reserves months
- —
- Total cash needed
- —
Loan-product check · same deal, 3 products live
Conventional
25% down · 7.5% · 30yr
- Down + closing
- —
- Monthly P&I
- —
- Monthly cashflow
- —
- DSCR
- —
- Eligible?
- —
Personal DTI + credit; lowest rate.
DSCR
20% down · 8.5% · 30yr
- Down + closing
- —
- Monthly P&I
- —
- Monthly cashflow
- —
- DSCR
- —
- Eligible?
- —
No personal income docs; deal must DSCR.
Hard money
10% down · 12.0% · 12mo
- Down + closing
- —
- Monthly P&I
- —
- Monthly cashflow
- —
- DSCR
- —
- Eligible?
- —
Short-term bridge; refi at stabilization.
Rent comps 1 comps
| Address | Beds | Baths | Sqft | Rent | $/sqft | DOM | Units | Dist |
|---|---|---|---|---|---|---|---|---|
| 426 7th St Somers Point, NJ | 4.0 | 2.5 | 1620 | $4,000 | $2.47 | 21d | 1 | 0.87mi |
HOA detail condo
- Monthly dues
- $170 · $2,040/yr
- Likely covers
- gas
- Assessments
- None detected in remarks — confirm with the listing agent.
Listing history 20 events
-
2026-06-21days on market $374,900 Active 100 DOM
-
2026-06-18days on market $374,900 Active 98 DOM
-
2026-06-17days on market $374,900 Active 97 DOM
-
2026-06-16days on market $374,900 Active 96 DOM
-
2026-06-15days on market $374,900 Active 95 DOM
-
2026-06-13days on market $374,900 Active 94 DOM
-
2026-06-12days on market $374,900 Active 93 DOM
-
2026-06-09days on market $374,900 Active 90 DOM
-
2026-06-08days on market $374,900 Active 89 DOM
-
2026-06-07remarks 475-char remark
-
2026-06-07days on market $374,900 Active 88 DOM
-
2026-06-07days on market $374,900 Active 86 DOM
-
2026-06-04days on market $374,900 Active 83 DOM
-
2026-06-02days on market $374,900 Active 82 DOM
-
2026-06-01days on market $374,900 Active 81 DOM
-
2026-05-31days on market $374,900 Active 80 DOM
-
2026-03-11$374,900 Active 475-char remark
Show marketing remark (475 chars)
Rare opportunity to own a 3-bedroom, 2.5-bath townhome in a highly desirable mainland location. This home offers a spacious layout with comfortable living and dining areas, second-floor laundry, central air, and gas heat. Conveniently located within walking distance to shopping, dining, banks, and everyday amenities, and within a highly regarded school district. A great opportunity to enjoy comfort and convenience in a prime location. Schedule your private showing today.
-
2026-03-11$374,900 Active
Show marketing remark (475 chars)
Rare opportunity to own a 3-bedroom, 2.5-bath townhome in a highly desirable mainland location. This home offers a spacious layout with comfortable living and dining areas, second-floor laundry, central air, and gas heat. Conveniently located within walking distance to shopping, dining, banks, and everyday amenities, and within a highly regarded school district. A great opportunity to enjoy comfort and convenience in a prime location. Schedule your private showing today.
-
2006-04-04soldstatus $234,900
-
1998-01-08soldstatus $92,000
ⓘ Source: listings_history table (triggers on properties + properties_extension) + one-shot
backfill from property_details.listing_events for pre-trigger history.
Tax reassessment forecast NJ · Partial reset (capped growth)
- Current annual tax
- $6,982 · $582/mo
- Projected year-2 tax
- $8,158 · $680/mo
- Expected delta
- +$1,177/yr (+$98/mo · 16.9%)
ⓘ Screening estimate from a state-policy table — verify with the county assessor before closing.
Climate risk First Street
- Flood 9/10 Extreme FEMA zone AE · 99% chance over 30 yrs
- Wildfire 4/10 Moderate
- Heat 8/10 Severe 7 d/yr ≥98°F today · 16 d/yr by 30 yrs out
- Wind 8/10 Severe 80% chance of damaging wind over 30 yrs
- Air quality 2/10 Low 1 unhealthy d/yr today · 2 by 30 yrs out
Nearby sold comps map
Loading sold comps map…
Walkable amenities ~0.75 mi
Loading nearby amenities…
Taxation est. · year 1
- Rental income
- $48,000
- − Mortgage interest
- −$21,000
- − Property taxes
- −$6,982
- − Insurance
- −$6,993
- − Repairs & maintenance
- −$3,840
- − Management
- −$3,840
- − HOA
- −$2,040
- − Depreciation
- −$10,906
- Taxable loss
- −$7,601
- Est. tax savings @ 24.0%
- +$1,824
- After-tax cash flow
- $137/yr
For passive investors: Depreciation is non-cash, so a rental often shows a tax loss while cash-flowing — sheltering income. Rental losses are passive: they offset passive income freely, and up to $25,000/yr can offset ordinary (W-2) income if you actively participate and your MAGI is under $100k (phasing out to $0 by $150k); unused losses carry forward. On sale, claimed depreciation is recaptured at up to 25%, and gains may owe capital-gains tax (a 1031 exchange can defer both). Figures are a year-1 estimate at your 24.0% rate — not tax advice; consult a CPA.
Schools (NCES district)
- District
- Linwood City School District
- NCES district ID
- 3408670
- Math proficiency
- 41% ▼ -27.00%
- Reading proficiency
- 68% ▼ -13.00%
- Median HH income
- $86,484
- Composite
- 49.9/100
- National rank
- #1942
- State rank
- #90 of 472 in NJ
Livability — Linwood
- Score
- 76/100
- State rank
- #139
- US rank
- #3693
Category grades
Schools grade is shown separately in the Schools card above.
Census & demographics
- Census place
- Linwood, NJ
- City population
- 6,954
- Population (ZIP)
- 6,954
Population outlook (Atlantic County) Hauer SSP2
- Today (2025)
- 268,948 people
- By 2030
- 264,497 · -1.7%
- By 2040
- 252,261 · -6.2%
- By 2050
- 237,846 · -11.6%
- By 2075
- 210,650 · -21.7%
- By 2100
- 180,234 · -33.0%
Race, ethnicity, and origin ACS 2023
- Neighborhood character
- Predominantly White (81%)
- Race & ethnicity
- White 81% Two or more races 7% Hispanic / Latino 6% Asian 5% Black 2%
- Hispanic origin (detail)
- Mexican 3%
- Common ancestry
- Romanian 7% Scotch-Irish 6% Italian 2%
- Foreign-born
- 10% · Canada, China, South Korea
- Languages at home
- 87% English-only · Spanish 5% Other Indo-European 3% Russian/Polish/Slavic 1%
Political lean MEDSL · Atlantic
- 2024 margin
- Toss-up / Even · D 47.7% · R 50.7% · Other 1.6%
- 2008→2024 swing
- -18.1pp toward R · 2008: 15.1pp · 2024: -3.0pp
- All cycles
- 2024: R+3.0 2020: D+6.7 2016: D+6.2 2012: D+17.2 2008: D+15.1
Not yet ingested
- Civics
- —
Market trends
- HPI YoY
- ▼ -275.39%
- Current HPI
- 280.1544
- Rent YoY
- —
- Metro
- —
- State GDP YoY
- ▲ 2.05%
- F500 in state
- 34
Industry mix (Fortune 500 HQ in NJ)
| Industry | F500 HQs | Revenue |
|---|---|---|
| Consumer Goods | 3 | $31B |
|
||
| Pharmaceuticals | 2 | $153B |
|
||
| Technology | 2 | $21B |
|
||
| Insurance | 2 | $20B |
|
||
| Healthcare | 2 | $19B |
|
||
| Financial Services | 1 | $70B |
|
||
Price history
+307.5% since first listed4 events — show timeline
- 2026-03-11 Listed $374,900 SJSRMLS
- 2026-03-11 Listed $374,900 SJSRMLS
- 2006-04-04 Sold (Public Records) $234,900 Public Records
- 1998-01-08 Sold (Public Records) $92,000 Public Records
Property tax history
+2.2%/yrLatest (2025): $6,982 · +3.0% YoY. Source: county tax records.
Cash-flow waterfall
monthlySold comps — $/sqft
last 12 mo · ≤1 miLoading sold comps…