 🔨 Auction
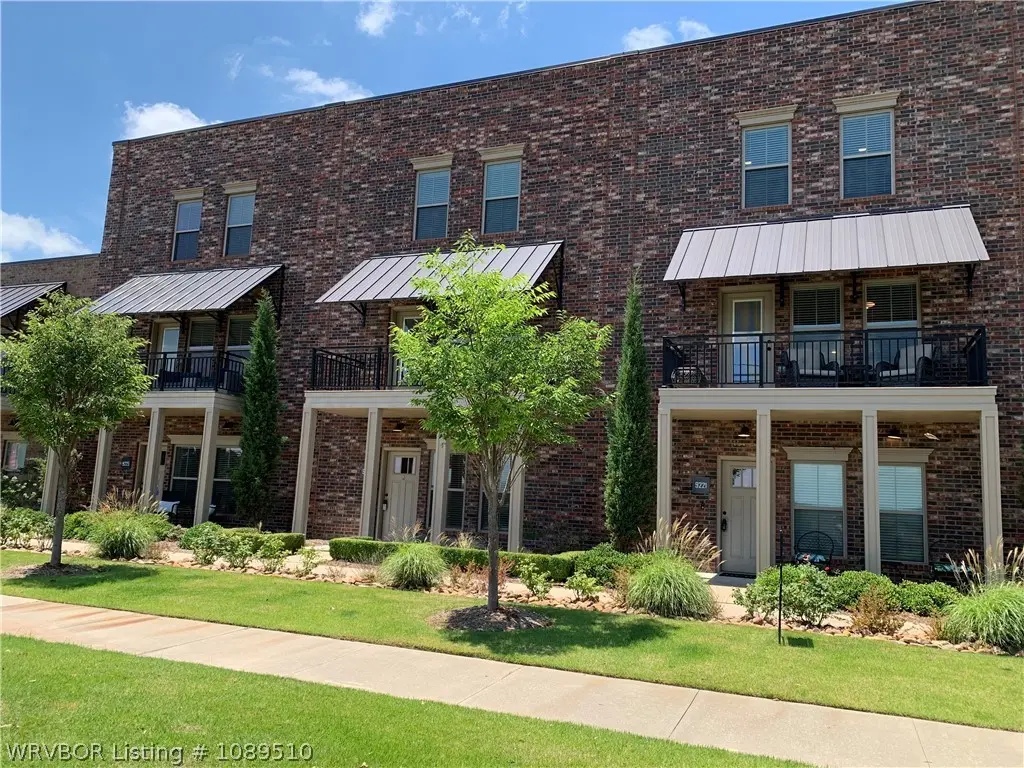
9223 Ra Young Jr Dr · Fort Smith, AR
Flood risk 1/10 · Minimal
- FEMA flood zone
- X (unshaded)
- Chance of flooding over 30 yrs
- 0.0%
- Est. flood insurance / yr
- $507 – $1,088
Fire risk 3/10 · Minor
- Est. fire insurance / yr
- $1,499 – $2,785
Heat risk 6/10 · Moderate
- Hot days now (above 111°F)
- 7 days/yr
- Hot days in 30 yrs
- 19 days/yr
Wind risk 2/10 · Minimal
- Chance of severe wind over 30 yrs
- 2.0%
Air-quality risk 2/10 · Minimal
- Unhealthy air days now
- 0 days/yr
- Unhealthy air days in 30 yrs
- 1 days/yr
Risk factors via First Street. Map © Google.
Why this score? — see what drove the F grade
The composite is a weighted blend of 9 inputs, each scored 0–100. Each bar is that input's sub-score; the figure is the points it added to the 100-point composite (weight × sub-score).
- ARV discount +7.5/15.0
- Livability +3.2/5.0
- Schools +3.1/10.0
- Cash flow +2.9/30.0
- Rent growth +2.5/5.0
- Condition / age +2.5/5.0
- Appreciation +0.2/10.0
- 1% rule +0.0/10.0
- DSCR +0.0/10.0
$1
🖨 Deal sheet (PDF) 📄 Offer letter ✓ Due diligence
Listing remarks
Auction 7/8/2026 @ 11 am. Welcome to this gorgeous, three-story upscale townhome where modern design meets high-end comfort. Perfect for anyone who loves quality, this beautiful home features top-tier finishes and thoughtful details throughout all three levels. The stunning kitchen is a chef’s dream, featuring premium granite countertops, stainless steel appliances, and beautiful designer lighting. For the ultimate convenience, a private in-unit elevator effortlessly takes you between floors, making everyday living incredibly easy. Outside your door, you will enjoy direct access to the popular Fort Smith Master Trail System, making it simple to step out for fresh air and exercise. Thi
Key facts
- Three story townhome
- $67 HOA
- Garage
Tags
Property features AI
Finance
- Other: Accessible entrance; Accessible elevator installed; Subdivision: The Hub At Providence
- HOA & community: Homeowners association; Annual association fee of $800 (approximately $66.67/month); Association fee includes grounds maintenance
Exterior
- Parking: Attached garage with 2 covered spaces; Concrete driveway; Garage door opener
- Security: Smoke detectors
- Utilities: Public water; Electricity available; Natural gas available; Water available
- Home design: Townhouse; Residential property; Three or more levels
- Construction: Brick construction; Slab foundation
- Exterior features: Balcony; Landscaped lot; Paved road access; Publicly maintained road
Interior
- Kitchen: Dishwasher; Disposal; Oven; Refrigerator; Range hood; Plumbed for ice maker
- Flooring: Vinyl
- Bathrooms: 3 full bathrooms; 1 half bathroom
- Heating & cooling: Central heating; Central air; Ceiling fans
- Interior features: Ceiling fans; Eat-in kitchen; Granite countertops; Pantry; Walk-in closets; Blinds; Gas-log fireplace (1)
- Laundry & utility: Washer hookup; Electric dryer hookup; Gas water heater
Neighborhood map
What this means for you Summary
Snapshot
- This is a 3-bed/3.5-bath townhouse listed at $1.
Deal economics
- At list price, monthly cash flow is $-1k ($-14k/yr) — negative.
- The deal already cash-flows at list — no discount required.
- Meets the 1% rule at list price ($2k rent vs $1).
- Cap rate 2.3% vs local median 4.3% in Fort Smith — below-typical yield; the buyer is paying a premium for something (appreciation thesis, condition, location) that the cap rate doesn't capture.
Location & tenants
- Location reads 65/100 on livability (#151 in AR) — a middle-class / working-renter tenant base. Strengths: cost of living A+, housing A+, health & safety A+; Watch: crime F, amenities F, commute F.
- Fort Smith School District (urban): math 35% / reading 39% proficiency, ranked #106 of 238 in AR (top 44%) — families likely to look elsewhere, expect single-tenant / working-renter base with shorter leases; 64% free/reduced lunch — lower-income household profile, screen leases tightly.
- Zoned schools: John P. Woods Elem. School (math 64% / reading 61%, grade B, #30 of 454 statewide, top 6%, 487 students, 43% FRL); L. A. Chaffin Jr. High School (math 53% / reading 65%, grade B, #13 of 201 statewide, top 7%, 725 students, 54% FRL); Southside High School (math 36% / reading 53%, grade F, #31 of 292 statewide, top 12%, 1,956 students, 47% FRL) — zoned schools average 48% FRL vs 64% district-wide (16 pts lower); this property's tenant base skews higher-income than the district average.
- Zoned-school proficiency averages 55% at this address vs 37% district-wide (+18 pts) — the actual schools serving this property are materially stronger than the Fort Smith School District average implies; a family-tenant draw the district grade alone would hide.
- Market conditions: 72 active listings in the ZIP; 2 comparable units currently listed for rent nearby; 388 units permitted in Sebastian County in 2024 (16 in 5+ unit buildings).
- This rent runs 37% of the median local income ($54k/yr) — at the standard rent-burdened threshold; future hikes will face affordability resistance.
Forward outlook
- Local home prices are declining (-3.0%/yr); year-one equity from $2k of loan paydown is wiped out by about $10k of value loss. Plan a longer hold.
- Sebastian County population projected at +7% by 2050 — modest demand growth; plan on rents tracking national, not racing it.
Negotiation context
- It's been on market 16 days — a 2% lower offer ($0) is reasonable based on typical stale-listing flexibility.
Risks & watch-outs
- Watch-outs: property tax is 517104.0% of price.
- Climate carrying-cost: extreme-heat days projected 7→19/yr by 2055 (HVAC capex compounding) — expect insurance premiums to compound above CPI over the hold.
Questions for the listing agent
- What do current leases actually rent for vs. the listed asking? Can we see a recent rent roll and the last 12 months of T-12 income?
- Property tax is high relative to price — has the assessment been appealed recently, and will the sale trigger a re-assessment?
- What does the HOA fee cover, when was the last increase, and are there any pending special assessments or reserve-fund shortfalls?
- Is there a deadline driving the sale (1031 exchange, divorce, estate, relocation)? That informs how much negotiation room exists.
- Schools are D-rated, which usually means shorter tenancies and higher turnover. Who's the typical renter profile here, and what's been the actual vacancy rate?
- Crime grade is F in this area — have there been break-ins, vandalism, or insurance claims at this property in the last 3 years? What carrier currently insures it and at what premium?
- The area grade is low — what's the realistic commute time and amenity access for the typical tenant pool here? Any planned neighborhood developments (good or bad) we should know about?
- What's the average days-on-market for RENTAL listings here right now (not sales)? A rising rental-DOM trend means longer vacancies and softer asking-rent achievability than the comps imply.
- What's the recent tenant-quality profile in this submarket — average credit score on applications, eviction rate, late-payment / NSF rate, and stable-employment percentage? A property-management company in the area should have these aggregated.
- How much new for-sale + rental construction is in the pipeline within 1–3 miles? Heavy new supply typically softens prices + rents 12–24 months out; constrained supply supports both.
Investment metrics
- 1% rule
- 0.48% ✗
- Cap rate
- 2.32%
- Cash-on-cash
- -14.18%
- DSCR
- 0.37
- GRM
- 17.3
CMA / ARV
- ARV (on-the-fly)
- $344,736
- Comps found
- 1
Show comp detail 1 sale within ~0.75 mi
| Address | Dist | Beds/Ba | Sqft | Sold | Price | $/sf | Match |
|---|---|---|---|---|---|---|---|
| 9217 R. A. Young Jr. Dr | 0.02mi | 2/2.5 (-1) | 2,413 (-12%) | 8mo | $303,318 | $126 | 64 |
Match score weights: distance 35% · size 25% · config 20% · recency 20%. Top-matched comps best support the ARV.
Projected returns pro-forma
-3.0% appreciation · 3.0% rent growth · sell at horizon
- IRR
- -43.2%
- Equity multiple
- -0.33×
- Total profit
- $-128,429
- Equity at exit
- $51,401
- IRR
- -75.1%
- Equity multiple
- -1.12×
- Total profit
- $-205,091
- Equity at exit
- $29,806
Cash invested: $96,526 (down + closing). Projections, not guarantees.
Landlord ↔ Tenant lean methodology
- Overall (STATE)
- 92 Strongly Landlord-Friendly
- State Arkansas
- 92 Strongly Landlord-Friendly · R+14
- County
- — inherits STATE
- City
- — inherits STATE
ZIP-level market 72923
- Home prices YoY
- -4.3%
- Active inventory
- 72
Monthly cashflow live
- Estimated rent
- $1,657 medium interval (Pro) →
- Mortgage (P&I)
- −$1,808
- Tax est. 1.5%
- −$431 /mo · $5,171/yr
- Insurance
- −$144
- HOA
- −$67
- Vacancy / Maint / Mgmt
- −$348
- Net cashflow
- $-1,140
Break-even live
Sensitivity live
| Price | -10% $-902 | -5% $-1,021 | +0% $-1,140 | +5% $-1,260 | +10% $-1,379 |
|---|---|---|---|---|---|
| Rent | -10% $-1,271 | -5% $-1,206 | +0% $-1,140 | +5% $-1,075 | +10% $-1,010 |
| Rate | -1.0pp $-967 | -0.5pp $-1,053 | base $-1,140 | +0.5pp $-1,230 | +1.0pp $-1,321 |
UW: 25.0% down · 7.5% · 30yr · 1.5% tax · 5.0% vac · 8.0% maint · 8.0% mgmt
Financing live
Cash to close
- Down payment
- $86,184
- Closing costs
- $10,342
- Reserves months
- —
- Total cash needed
- —
Loan-product check · same deal, 3 products live
Conventional
25% down · 7.5% · 30yr
- Down + closing
- —
- Monthly P&I
- —
- Monthly cashflow
- —
- DSCR
- —
- Eligible?
- —
Personal DTI + credit; lowest rate.
DSCR
20% down · 8.5% · 30yr
- Down + closing
- —
- Monthly P&I
- —
- Monthly cashflow
- —
- DSCR
- —
- Eligible?
- —
No personal income docs; deal must DSCR.
Hard money
10% down · 12.0% · 12mo
- Down + closing
- —
- Monthly P&I
- —
- Monthly cashflow
- —
- DSCR
- —
- Eligible?
- —
Short-term bridge; refi at stabilization.
Rent comps 2 comps
| Address | Beds | Baths | Sqft | Rent | $/sqft | DOM | Units | Dist |
|---|---|---|---|---|---|---|---|---|
| 9023 Mayswood Pl Fort Smith, AR | 3.0 | 2.5 | 1910 | $2,300 | $1.20 | 44d | 1 | 0.69mi |
| 8808 Timberlyn Way Fort Smith, AR | 3.0 | 2.0 | 1945 | $1,595 | $0.82 | 13d | 1 | 0.96mi |
HOA detail
- Monthly dues
- $67 · $804/yr
Listing history 13 events
-
2026-06-19days on market $1 Active 16 DOM
-
2026-06-18days on market $1 Active 15 DOM
-
2026-06-17days on market $1 Active 14 DOM
-
2026-06-16days on market $1 Active 13 DOM
-
2026-06-15days on market $1 Active 12 DOM
-
2026-06-14days on market $1 Active 10 DOM
-
2026-06-13days on market $1 Active 9 DOM
-
2026-06-10days on market $1 Active 7 DOM
-
2026-06-09days on market $1 Active 6 DOM
-
2026-06-08days on market $1 Active 5 DOM
-
2026-06-07days on market $1 Active 4 DOM
-
2026-06-05remarks 693-char remark
-
2026-06-05$1 Active 1 DOM
ⓘ Source: listings_history table (triggers on properties + properties_extension) + one-shot
backfill from property_details.listing_events for pre-trigger history.
Climate risk First Street
- Flood 1/10 Low FEMA zone X (unshaded) · 0% chance over 30 yrs
- Wildfire 3/10 Moderate
- Heat 6/10 Major 7 d/yr ≥111°F today · 19 d/yr by 30 yrs out
- Wind 2/10 Low 2% chance of damaging wind over 30 yrs
- Air quality 2/10 Low 0 unhealthy d/yr today · 1 by 30 yrs out
Nearby sold comps map
Loading sold comps map…
Walkable amenities ~0.75 mi
Loading nearby amenities…
Taxation est. · year 1
- Rental income
- $19,883
- − Mortgage interest
- −$19,311
- − Property taxes
- −$5,171
- − Insurance
- −$1,724
- − Repairs & maintenance
- −$1,591
- − Management
- −$1,591
- − HOA
- −$804
- − Depreciation
- −$10,029
- Taxable loss
- −$20,336
- Est. tax savings @ 24.0%
- +$4,881
- After-tax cash flow
- $-8,804/yr
For passive investors: Depreciation is non-cash, so a rental often shows a tax loss while cash-flowing — sheltering income. Rental losses are passive: they offset passive income freely, and up to $25,000/yr can offset ordinary (W-2) income if you actively participate and your MAGI is under $100k (phasing out to $0 by $150k); unused losses carry forward. On sale, claimed depreciation is recaptured at up to 25%, and gains may owe capital-gains tax (a 1031 exchange can defer both). Figures are a year-1 estimate at your 24.0% rate — not tax advice; consult a CPA.
Schools (NCES district)
- District
- Fort Smith School District
- NCES district ID
- 0506330
- Math proficiency
- 35% ▼ -11.00%
- Reading proficiency
- 39% ▼ -7.00%
- Median HH income
- $36,066
- Composite
- 30.66/100
- National rank
- #6183
- State rank
- #106 of 238 in AR
Livability — Fort Smith
- Score
- 65/100
- State rank
- #151
- US rank
- #13185
Category grades
Schools grade is shown separately in the Schools card above.
Census & demographics
- Census place
- Fort Smith, AR
- County
- Sebastian County · 99,312 people
- City population
- 94,356
- Metro
- Fort Smith, AR-OK
- Population (ZIP)
- 4,956
- Household income
- $54,157
- Rent vs Own
- Severe rent burden
- 109.0
Population outlook (Sebastian County) Hauer SSP2
- Today (2025)
- 133,992 people
- By 2030
- 136,620 · +2.0%
- By 2040
- 140,832 · +5.1%
- By 2050
- 143,301 · +6.9%
- By 2075
- 147,964 · +10.4%
- By 2100
- 145,848 · +8.8%
Race, ethnicity, and origin ACS 2023
- Neighborhood character
- Predominantly White (77%)
- Race & ethnicity
- White 77% Hispanic / Latino 11% Asian 7% Two or more races 4% Black 2%
- Hispanic origin (detail)
- Mexican 10%
- Common ancestry
- Lithuanian 7% Serbian 2% Italian 1%
- Foreign-born
- 7% · Canada, Vietnam
- Languages at home
- 88% English-only · Spanish 6% Vietnamese 4% Other Asian/Pacific 2%
Political lean MEDSL · Sebastian
- 2024 margin
- Solid R (+37.5) · D 30.0% · R 67.6% · Other 2.4%
- 2008→2024 swing
- -2.9pp toward R · 2008: -34.6pp · 2024: -37.5pp
- All cycles
- 2024: R+37.5 2020: R+35.5 2016: R+38.1 2012: R+37.1 2008: R+34.6
Not yet ingested
- Civics
- —
Market trends
- HPI YoY
- ▼ -9.56%
- Current HPI
- 212.4585
- Rent YoY
- —
- Metro
- Fort Smith, AR-OK
- State GDP YoY
- ▲ 3.80%
- F500 in state
- 10
Industry mix (Fortune 500 HQ in AR)
| Industry | F500 HQs | Revenue |
|---|---|---|
| Retail | 1 | $681B |
|
||
| Food / Agriculture | 1 | $53B |
|
||
| Retail / Energy | 1 | $22B |
|
||
| Transportation / Logistics | 1 | $12B |
|
||
| Energy | 1 | $4B |
|
||
Property tax history
+45.9%/yrLatest (2025): $3,272 · +8.9% YoY. Source: county tax records.
Cash-flow waterfall
monthlySold comps — $/sqft
last 12 mo · ≤1 miLoading sold comps…