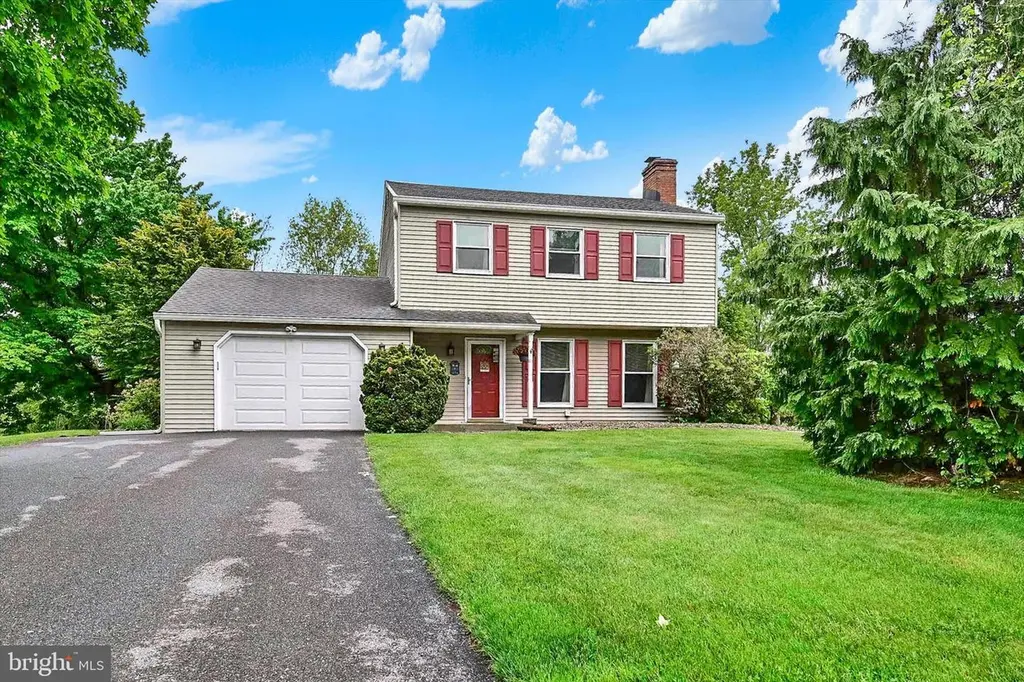
2000 Elm St · Marysville, PA
Flood risk 1/10 · Minimal
- FEMA flood zone
- X (unshaded)
- Chance of flooding over 30 yrs
- 0.0%
- Est. flood insurance / yr
- $507 – $1,088
Fire risk 3/10 · Minor
- Est. fire insurance / yr
- $511 – $949
Heat risk 5/10 · Moderate
- Hot days now (above 99°F)
- 7 days/yr
- Hot days in 30 yrs
- 16 days/yr
Wind risk 2/10 · Minimal
- Chance of severe wind over 30 yrs
- 4.0%
Air-quality risk 2/10 · Minimal
- Unhealthy air days now
- 1 days/yr
- Unhealthy air days in 30 yrs
- 3 days/yr
Risk factors via First Street. Map © Google.
Why this score? — see what drove the C- grade
The composite is a weighted blend of 9 inputs, each scored 0–100. Each bar is that input's sub-score; the figure is the points it added to the 100-point composite (weight × sub-score).
- ARV discount +15.0/15.0
- Cash flow +14.6/30.0
- DSCR +4.5/10.0
- Schools +3.8/10.0
- Livability +3.7/5.0
- 1% rule +3.5/10.0
- Rent growth +2.5/5.0
- Condition / age +2.5/5.0
- Appreciation +0.0/10.0
$257,500
🖨 Deal sheet (PDF) 📄 Offer letter ✓ Due diligence
Listing remarks
Welcome home to this charming 3-bedroom, 1.5-bath two-story located on a beautiful corner lot in Marysville! Featuring a traditional floor plan with comfortable living spaces, this home offers the perfect blend of character and functionality. A newer roof provides added peace of mind, while the spacious 1-car garage and backyard shed offer plenty of storage for vehicles, tools, and gardening equipment. Other improvements include a new garage door (2024), replacement windows (2012), re-bath shower (2021), gutters (2021) and more! Enjoy convenient access to Route 15, Harrisburg, Mechanicsburg, shopping, dining, and everything the surrounding area has to offer. Don’t miss this great opp
Key facts
- Newer roof
- Re-bath shower
- Spacious garage
Tags
Property features AI
Finance
- Other: Ownership: Fee simple; Total below-grade finished area: 200; Above-grade finished area: 1,300; Year built source: Assessor
Exterior
- Parking: Attached garage with one garage space and a garage door opener
- Utilities: Public water; On-site septic; Electric hot water
- Home design: Detached single-family home; Architectural shingle roof
- Construction: Foundation: Other; Above-grade finished area reported by assessor; Below-grade finished area (basement) reported as estimated
- Exterior features: Detached shed on the property; Not in a federal flood zone
Interior
- Bedrooms: Three bedrooms on the upper level
- Bathrooms: One full bathroom on the upper level; One half bathroom on the main level
- Heating & cooling: Baseboard electric heating; Window air conditioning units (electric)
- Interior features: Fully finished basement; Living area reported as estimated
Neighborhood map
What this means for you Summary
Snapshot
- This is a 3-bed/1.5-bath single-family listed at $258k.
Deal economics
- At list price, monthly cash flow is $62 ($749/yr) — positive.
- The deal already cash-flows at list — no discount required.
- To meet the 1% rule (rent ≥ 1% of price), the offer needs to be $219k (14.9% below list).
- Recommended offer: $219k (14.9% below list) — sets the bar for 1% rule.
- Cap rate 6.6% vs local median 0.6% in Marysville — top-decile yield for the area; either an underpriced asset or a hidden risk that comps aren't pricing in. Stress-test before assuming the spread holds.
Location & tenants
- Location reads 73/100 on livability (#564 in PA) — a middle-class / working-renter tenant base. Strengths: crime A+, cost of living A+, housing A+; Watch: employment C-, amenities F, commute F.
- Susquenita SD (rural): math 34% / reading 53% proficiency, ranked #275 of 539 in PA (top 51%) — families likely to look elsewhere, expect single-tenant / working-renter base with shorter leases.
- Zoned schools: Susquenita El Sch (math 43% / reading 59%, grade C-, #636 of 1,518 statewide, top 42%, 694 students, 44% FRL); Susquenita Ms (math 26% / reading 50%, grade F, #283 of 512 statewide, top 57%, 569 students, 38% FRL); Susquenita Hs (math 64%, 503 students, 31% FRL).
- Market conditions: 72 active listings in the ZIP; 2 comparable units currently listed for rent nearby; 107 units permitted in Perry County in 2024 (0 in 5+ unit buildings).
Forward outlook
- Local home prices are declining (-3.0%/yr); year-one equity from $2k of loan paydown is wiped out by about $8k of value loss. Plan a longer hold.
- Perry County population projected at -19% by 2050 — secular population decline; favor cash flow + early exit over multi-decade hold.
Negotiation context
- Only 1 days on market — expect competitive offers; lowballing is unlikely to land.
- Current owner paid $163k; list at $258k implies a 58% gain — meaningful room to come down on a strong offer.
Risks & watch-outs
- Climate carrying-cost: extreme-heat days projected 7→16/yr by 2055 (HVAC capex compounding) — expect insurance premiums to compound above CPI over the hold.
Questions for the listing agent
- Built in 1979 — when were the roof, HVAC, electrical panel, plumbing, and water heater last replaced?
- Is there a deadline driving the sale (1031 exchange, divorce, estate, relocation)? That informs how much negotiation room exists.
- Schools are F-rated, which usually means shorter tenancies and higher turnover. Who's the typical renter profile here, and what's been the actual vacancy rate?
- What's the average days-on-market for RENTAL listings here right now (not sales)? A rising rental-DOM trend means longer vacancies and softer asking-rent achievability than the comps imply.
- What's the recent tenant-quality profile in this submarket — average credit score on applications, eviction rate, late-payment / NSF rate, and stable-employment percentage? A property-management company in the area should have these aggregated.
- How much new for-sale + rental construction is in the pipeline within 1–3 miles? Heavy new supply typically softens prices + rents 12–24 months out; constrained supply supports both.
Investment metrics
- 1% rule
- 0.85% ✗
- Cap rate
- 6.58%
- Cash-on-cash
- 1.04%
- DSCR
- 1.05
- GRM
- 9.8
CMA / ARV
- ARV (on-the-fly)
- $314,600
- Comps found
- 1
Show comp detail 1 sale within ~0.75 mi
| Address | Dist | Beds/Ba | Sqft | Sold | Price | $/sf | Match |
|---|---|---|---|---|---|---|---|
| 105 Tower Rd | 0.61mi | 3/2.0 | 1,232 (-5%) | 12mo | $298,000 | $242 | 51 |
Match score weights: distance 35% · size 25% · config 20% · recency 20%. Top-matched comps best support the ARV.
Projected returns pro-forma
-3.0% appreciation · 3.0% rent growth · sell at horizon
- IRR
- -14.7%
- Equity multiple
- 0.48×
- Total profit
- $-37,784
- Equity at exit
- $38,394
- IRR
- -6.0%
- Equity multiple
- 0.61×
- Total profit
- $-27,924
- Equity at exit
- $22,264
Cash invested: $72,100 (down + closing). Projections, not guarantees.
Landlord ↔ Tenant lean methodology
- Overall (STATE)
- 62 Landlord-Friendly
- State Pennsylvania
- 62 Landlord-Friendly · EVEN
- County
- — inherits STATE
- City
- — inherits STATE
ZIP-level market 17053
- Active inventory
- 72
- Price-to-rent
- 9.8×
Monthly cashflow live
- Estimated rent
- $2,191 medium interval (Pro) →
- Mortgage (P&I)
- −$1,350
- Tax from tax record
- −$211 /mo · $2,530/yr
- Insurance
- −$107
- HOA
- −$0
- Vacancy / Maint / Mgmt
- −$460
- Net cashflow
- $62
Break-even live
Sensitivity live
| Price | -10% $208 | -5% $135 | +0% $62 | +5% $-10 | +10% $-83 |
|---|---|---|---|---|---|
| Rent | -10% $-111 | -5% $-24 | +0% $62 | +5% $149 | +10% $236 |
| Rate | -1.0pp $192 | -0.5pp $128 | base $62 | +0.5pp $-4 | +1.0pp $-72 |
UW: 25.0% down · 7.5% · 30yr · 1.5% tax · 5.0% vac · 8.0% maint · 8.0% mgmt
Financing live
Cash to close
- Down payment
- $64,375
- Closing costs
- $7,725
- Reserves months
- —
- Total cash needed
- —
Loan-product check · same deal, 3 products live
Conventional
25% down · 7.5% · 30yr
- Down + closing
- —
- Monthly P&I
- —
- Monthly cashflow
- —
- DSCR
- —
- Eligible?
- —
Personal DTI + credit; lowest rate.
DSCR
20% down · 8.5% · 30yr
- Down + closing
- —
- Monthly P&I
- —
- Monthly cashflow
- —
- DSCR
- —
- Eligible?
- —
No personal income docs; deal must DSCR.
Hard money
10% down · 12.0% · 12mo
- Down + closing
- —
- Monthly P&I
- —
- Monthly cashflow
- —
- DSCR
- —
- Eligible?
- —
Short-term bridge; refi at stabilization.
Rent comps 2 comps
| Address | Beds | Baths | Sqft | Rent | $/sqft | DOM | Units | Dist |
|---|---|---|---|---|---|---|---|---|
| 45 Hill Rd East Pennsboro Township, PA | 1.0–3.0 | 1.0–2.0 | 1031 | $2,295 | $2.22 | 16d | 4 | 1.21mi |
| 2300 Hadley Blvd Enola, PA | 1.0–4.0 | 1.0–2.5 | 1210 | $2,102 | $1.74 | 16d | 20 | 1.21mi |
Listing history 8 events
-
2026-05-28status Pending
-
2026-05-27$257,500 Active
-
2008-09-22soldstatus $163,000
-
1999-02-23soldstatus $114,000
-
1986-07-07soldstatus $71,500
-
1983-06-02soldstatus $59,000
-
1978-10-26soldstatus $51,000
-
1978-07-13soldstatus $8,250
ⓘ Source: listings_history table (triggers on properties + properties_extension) + one-shot
backfill from property_details.listing_events for pre-trigger history.
Tax reassessment forecast PA · Partial reset (capped growth)
- Current annual tax
- $2,530 · $211/mo
- Projected year-2 tax
- $3,299 · $275/mo
- Expected delta
- +$769/yr (+$64/mo · 30.4%)
ⓘ Screening estimate from a state-policy table — verify with the county assessor before closing.
Climate risk First Street
- Flood 1/10 Low FEMA zone X (unshaded) · 0% chance over 30 yrs
- Wildfire 3/10 Moderate
- Heat 5/10 Major 7 d/yr ≥99°F today · 16 d/yr by 30 yrs out
- Wind 2/10 Low 4% chance of damaging wind over 30 yrs
- Air quality 2/10 Low 1 unhealthy d/yr today · 3 by 30 yrs out
Nearby sold comps map
Loading sold comps map…
Walkable amenities ~0.75 mi
Loading nearby amenities…
Taxation est. · year 1
- Rental income
- $26,292
- − Mortgage interest
- −$14,424
- − Property taxes
- −$2,530
- − Insurance
- −$1,288
- − Repairs & maintenance
- −$2,103
- − Management
- −$2,103
- − Depreciation
- −$7,491
- Taxable loss
- −$3,647
- Est. tax savings @ 24.0%
- +$875
- After-tax cash flow
- $1,625/yr
For passive investors: Depreciation is non-cash, so a rental often shows a tax loss while cash-flowing — sheltering income. Rental losses are passive: they offset passive income freely, and up to $25,000/yr can offset ordinary (W-2) income if you actively participate and your MAGI is under $100k (phasing out to $0 by $150k); unused losses carry forward. On sale, claimed depreciation is recaptured at up to 25%, and gains may owe capital-gains tax (a 1031 exchange can defer both). Figures are a year-1 estimate at your 24.0% rate — not tax advice; consult a CPA.
Schools (NCES district)
- District
- Susquenita SD
- NCES district ID
- 4223040
- Math proficiency
- 34% ▼ -5.00%
- Reading proficiency
- 53% ▼ -8.00%
- Median HH income
- $59,765
- Composite
- 38.26/100
- National rank
- #4240
- State rank
- #275 of 539 in PA
Livability — Marysville
- Score
- 73/100
- State rank
- #564
- US rank
- #5305
Category grades
Schools grade is shown separately in the Schools card above.
Census & demographics
- Population (ZIP)
- 5,109
Population outlook (Perry County) Hauer SSP2
- Today (2025)
- 44,250 people
- By 2030
- 42,862 · -3.1%
- By 2040
- 39,574 · -10.6%
- By 2050
- 36,001 · -18.6%
- By 2075
- 27,991 · -36.7%
- By 2100
- 20,936 · -52.7%
Race, ethnicity, and origin ACS 2023
- Neighborhood character
- Predominantly White (92%)
- Race & ethnicity
- White 92% Two or more races 5% Hispanic / Latino 4%
- Common ancestry
- Romanian 9% Polish 4% Lithuanian 3%
- Foreign-born
- 2% · Canada
- Languages at home
- 95% English-only · Spanish 2% Other Asian/Pacific 1% Russian/Polish/Slavic 1%
Political lean MEDSL · Perry
- 2024 margin
- Solid R (+49.3) · D 24.8% · R 74.1% · Other 1.0%
- 2008→2024 swing
- -15.6pp toward R · 2008: -33.7pp · 2024: -49.3pp
- All cycles
- 2024: R+49.3 2020: R+50.1 2016: R+51.9 2012: R+38.8 2008: R+33.7
Not yet ingested
- Civics
- —
Market trends
- HPI YoY
- ▼ -124.88%
- Current HPI
- 167.873
- Rent YoY
- —
- Metro
- —
- State GDP YoY
- ▲ 1.68%
- F500 in state
- 34
Industry mix (Fortune 500 HQ in PA)
| Industry | F500 HQs | Revenue |
|---|---|---|
| Healthcare | 2 | $309B |
|
||
| Insurance | 2 | $27B |
|
||
| Telecommunications / Media | 1 | $124B |
|
||
| Industrial Distribution | 1 | $22B |
|
||
| Financial Services | 1 | $20B |
|
||
| Chemicals / Materials | 1 | $18B |
|
||
Price history
+3021.2% since first listed8 events — show timeline
- 2026-05-28 Pending — BRIGHT MLS
- 2026-05-27 Listed $257,500 BRIGHT MLS
- 2008-09-22 Sold (Public Records) $163,000 Public Records
- 1999-02-23 Sold (Public Records) $114,000 Public Records
- 1986-07-07 Sold (Public Records) $71,500 Public Records
- 1983-06-02 Sold (Public Records) $59,000 Public Records
- 1978-10-26 Sold (Public Records) $51,000 Public Records
- 1978-07-13 Sold (Public Records) $8,250 Public Records
Property tax history
+0.0%/yrLatest (2026): $2,530 · -12.6% YoY. Source: county tax records.
Cash-flow waterfall
monthlySold comps — $/sqft
last 12 mo · ≤1 miLoading sold comps…