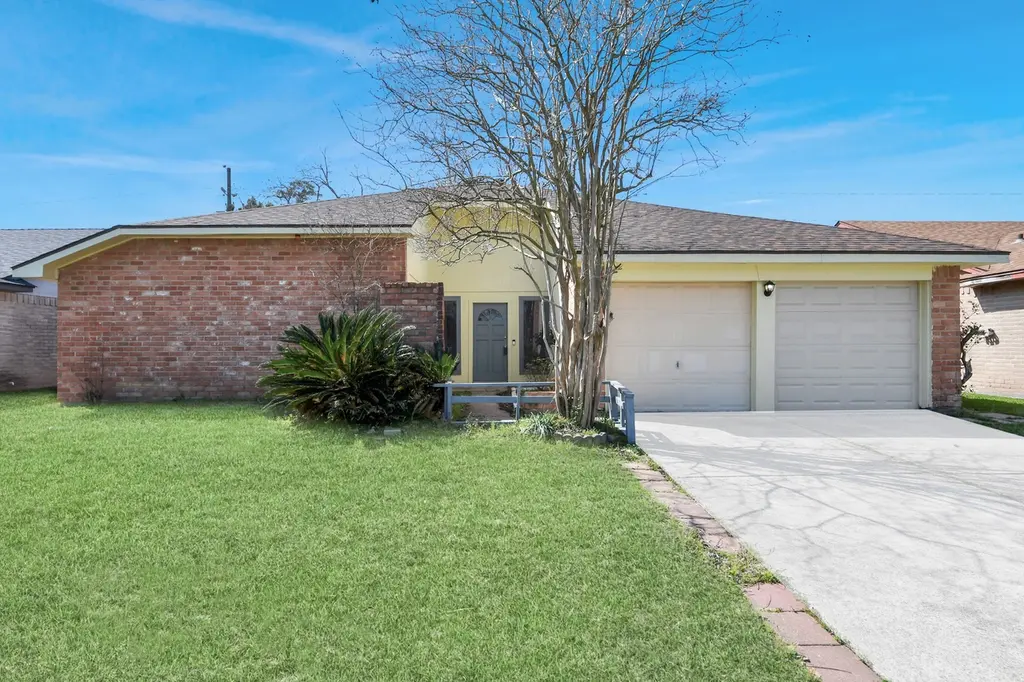
20121 Cottonglade Ln · Houston, TX
Flood risk 4/10 · Minor
- FEMA flood zone
- X (unshaded)
- Chance of flooding over 30 yrs
- 0.2%
- Est. flood insurance / yr
- $507 – $1,088
Fire risk 3/10 · Minor
- Est. fire insurance / yr
- $1,222 – $2,270
Heat risk 9/10 · Severe
- Hot days now (above 110°F)
- 7 days/yr
- Hot days in 30 yrs
- 25 days/yr
Wind risk 9/10 · Severe
- Chance of severe wind over 30 yrs
- 99.0%
Air-quality risk 3/10 · Minor
- Unhealthy air days now
- 3 days/yr
- Unhealthy air days in 30 yrs
- 3 days/yr
Risk factors via First Street. Map © Google.
Why this score? — see what drove the D- grade
The composite is a weighted blend of 9 inputs, each scored 0–100. Each bar is that input's sub-score; the figure is the points it added to the 100-point composite (weight × sub-score).
- Cash flow +9.8/30.0
- ARV discount +7.1/15.0
- Appreciation +4.6/10.0
- 1% rule +3.9/10.0
- Livability +3.7/5.0
- Rent growth +3.0/5.0
- DSCR +2.8/10.0
- Condition / age +2.5/5.0
- Schools +1.5/10.0
$210,000
🖨 Deal sheet (PDF) 📄 Offer letter ✓ Due diligence
Listing remarks MLS
Perfect for first-time homebuyers or savvy investors, this charming 3-bedroom, 2-bath home features a functional layout with a spacious living area and an attached two-car garage. Situated on a generous 6,600 sq. ft. lot, the backyard offers plenty of space to create your ideal outdoor retreat. With the A/C and roof recently replaced, some of the major updates are already complete—giving you a strong head start. Located in the established Kenswick community, residents enjoy easy access to major highways, schools, and shopping. Whether you’re looking to personalize your next home or expand your investment portfolio, this property presents an excellent opportunity. Schedule your private showing today!
Key facts
- Generous lot
- Spacious living area
- Functional layout
Tags
Neighborhood map
What this means for you Summary
Snapshot
- This is a 3-bed/2.0-bath single-family listed at $210k.
Deal economics
- At list price, monthly cash flow is $-134 ($-2k/yr) — negative.
- To cash-flow at today's rent, offer at most $186k (11.2% below list).
- To meet the 1% rule (rent ≥ 1% of price), the offer needs to be $187k (10.9% below list).
- Recommended offer: $186k (11.2% below list) — sets the bar for cash-flow.
- Cap rate 5.5% vs local median 3.2% in Houston — top-decile yield for the area; either an underpriced asset or a hidden risk that comps aren't pricing in. Stress-test before assuming the spread holds.
Location & tenants
- Location reads 74/100 on livability (#184 in TX, #4,771 nationally) — a middle-class / working-renter tenant base. Strengths: amenities A+, cost of living A+, housing A+; Watch: crime F.
- Aldine ISD (suburban): math 16% / reading 21% proficiency, ranked #790 of 826 in TX (top 96%) — low school quality limits family demand, transient renter base, plan for 1-2y turnover; 79% free/reduced lunch — lower-income household profile, screen leases tightly.
- Zoned schools: Jones Ec/Pk/K (779 students, 92% FRL); Teague Middle (math 14% / reading 22%, grade F, #1,491 of 1,662 statewide, top 91%, 1,180 students, 87% FRL); Nimitz H S (math 17% / reading 25%, grade F, #1,385 of 1,632 statewide, top 85%, 2,772 students, 85% FRL).
- Market conditions: Rents rising (+2.2%/yr); 312 active listings in the ZIP; 22 comparable units currently listed for rent nearby; rentals at typical pace (median 26d on market — plan ~3-4 weeks tenant-placement turnaround); 29,883 units permitted in Harris County in 2024 (8,621 in 5+ unit buildings).
- This rent runs 35% of the median local income ($65k/yr) — at the standard rent-burdened threshold; future hikes will face affordability resistance.
Forward outlook
- Local home prices are declining (-0.8%/yr); year-one equity from $1k of loan paydown is wiped out by about $2k of value loss. Plan a longer hold.
- Harris County population projected at +47% by 2050 — long-run rental-demand tailwind backs the buy-and-hold thesis.
Negotiation context
- It's been on market 91 days — a 9% lower offer ($191k) is reasonable based on typical stale-listing flexibility.
- 3 sale attempts since 23y ago with the ask held roughly flat each time — persistent listings suggest the price (not the market) is what's stuck; bring a comps-based counter.
- Current owner paid $46k; list at $210k implies a 356% gain — meaningful room to come down on a strong offer.
Risks & watch-outs
- Climate carrying-cost: severe wind risk, 99% chance of damaging wind over 30y; extreme-heat days projected 7→25/yr by 2055 (HVAC capex compounding) — expect insurance premiums to compound above CPI over the hold.
Questions for the listing agent
- What do current leases actually rent for vs. the listed asking? Can we see a recent rent roll and the last 12 months of T-12 income?
- It's been on market 91 days. Have you received any prior offers? Is the seller open to a 11% concession, seller financing, or rate buy-down credit?
- Built in 1979 — when were the roof, HVAC, electrical panel, plumbing, and water heater last replaced?
- What does the HOA fee cover, when was the last increase, and are there any pending special assessments or reserve-fund shortfalls?
- Why hasn't it sold? Are there any deal-killer items the seller is aware of (foundation, flood, title, zoning, code violations)?
- Is there a deadline driving the sale (1031 exchange, divorce, estate, relocation)? That informs how much negotiation room exists.
- Schools are D-rated, which usually means shorter tenancies and higher turnover. Who's the typical renter profile here, and what's been the actual vacancy rate?
- Crime grade is F in this area — have there been break-ins, vandalism, or insurance claims at this property in the last 3 years? What carrier currently insures it and at what premium?
- The area grade is low — what's the realistic commute time and amenity access for the typical tenant pool here? Any planned neighborhood developments (good or bad) we should know about?
- What's the average days-on-market for RENTAL listings here right now (not sales)? A rising rental-DOM trend means longer vacancies and softer asking-rent achievability than the comps imply.
- What's the recent tenant-quality profile in this submarket — average credit score on applications, eviction rate, late-payment / NSF rate, and stable-employment percentage? A property-management company in the area should have these aggregated.
- How much new for-sale + rental construction is in the pipeline within 1–3 miles? Heavy new supply typically softens prices + rents 12–24 months out; constrained supply supports both.
Investment metrics
- 1% rule
- 0.89% ✗
- Cap rate
- 5.53%
- Cash-on-cash
- -2.73%
- DSCR
- 0.88
- GRM
- 9.4
CMA / ARV
- ARV (median comp)
- $208,308
- List price
- $210,000
- Delta
- 0.81%
- Verdict
- FAIR
- Comps
- 20 within 1.0 mi
Show comp detail 12 sales within ~0.75 mi
| Address | Dist | Beds/Ba | Sqft | Sold | Price | $/sf | Match |
|---|---|---|---|---|---|---|---|
| 20014 Bishops Gate Ln | 0.21mi | 3/2.0 | 1,472 (-4%) | 2mo | $190,995 | $130 | 82 |
| 8226 Forest Point Dr | 0.24mi | 3/2.0 | 1,481 (-4%) | 2mo | $169,680 | $115 | 81 |
| 8302 Opalwood Ln | 0.27mi | 3/2.0 | 1,690 (+10%) | 2mo | $214,999 | $127 | 70 |
| 8127 White Arbor Ct | 0.55mi | 3/2.0 | 1,475 (-4%) | 1mo | $209,500 | $142 | 66 |
| 19907 Lions Gate Dr | 0.49mi | 3/2.0 | 1,428 (-7%) | 1mo | $209,000 | $146 | 64 |
| 20011 Lions Gate Dr | 0.45mi | 3/2.0 | 1,394 (-10%) | 2mo | $205,900 | $148 | 62 |
| 21126 Sprouse Cir | 0.63mi | 4/2.5 (+1) | 1,577 (+2%) | 2mo | $226,400 | $144 | 58 |
| 20219 Fox Grove Ln | 0.74mi | 3/2.0 | 1,595 (+4%) | 2mo | $195,000 | $122 | 58 |
| 19922 Bridgedale Ln | 0.62mi | 3/2.0 | 1,656 (+8%) | 1mo | $246,000 | $149 | 58 |
| 19834 Lions Gate Ct | 0.53mi | 3/2.0 | 1,348 (-12%) | 1mo | $204,900 | $152 | 54 |
| 20215 Fox Grove Ln | 0.73mi | 3/2.0 | 1,684 (+9%) | 2mo | $215,000 | $128 | 49 |
| 7315 Foxside Ln | 0.66mi | 4/2.0 (+1) | 1,677 (+9%) | 2mo | $185,000 | $110 | 47 |
Match score weights: distance 35% · size 25% · config 20% · recency 20%. Top-matched comps best support the ARV.
Projected returns pro-forma
-0.77% appreciation · 2.17% rent growth · sell at horizon
- IRR
- -9.2%
- Equity multiple
- 0.60×
- Total profit
- $-23,597
- Equity at exit
- $52,970
- IRR
- -3.3%
- Equity multiple
- 0.70×
- Total profit
- $-17,900
- Equity at exit
- $57,589
Cash invested: $58,800 (down + closing). Projections, not guarantees.
Landlord ↔ Tenant lean methodology
- Overall (STATE)
- 87 Strongly Landlord-Friendly
- State Texas
- 87 Strongly Landlord-Friendly · R+5
- County
- — inherits STATE
- City
- — inherits STATE
ZIP-level market 77338
- Home prices YoY
- -0.3%
- Rents YoY
- 2.2%
- Active inventory
- 312
- Price-to-rent
- 9.4×
Monthly cashflow live
- Estimated rent
- $1,870 high interval (Pro) →
- Mortgage (P&I)
- −$1,101
- Tax from tax record
- −$401 /mo · $4,816/yr
- Insurance
- −$88
- HOA
- −$21
- Vacancy / Maint / Mgmt
- −$393
- Net cashflow
- $-134
Break-even live
Sensitivity live
| Price | -10% $-15 | -5% $-74 | +0% $-134 | +5% $-193 | +10% $-252 |
|---|---|---|---|---|---|
| Rent | -10% $-281 | -5% $-207 | +0% $-134 | +5% $-60 | +10% $14 |
| Rate | -1.0pp $-28 | -0.5pp $-80 | base $-134 | +0.5pp $-188 | +1.0pp $-243 |
UW: 25.0% down · 7.5% · 30yr · 1.5% tax · 5.0% vac · 8.0% maint · 8.0% mgmt
Financing live
Cash to close
- Down payment
- $52,500
- Closing costs
- $6,300
- Reserves months
- —
- Total cash needed
- —
Loan-product check · same deal, 3 products live
Conventional
25% down · 7.5% · 30yr
- Down + closing
- —
- Monthly P&I
- —
- Monthly cashflow
- —
- DSCR
- —
- Eligible?
- —
Personal DTI + credit; lowest rate.
DSCR
20% down · 8.5% · 30yr
- Down + closing
- —
- Monthly P&I
- —
- Monthly cashflow
- —
- DSCR
- —
- Eligible?
- —
No personal income docs; deal must DSCR.
Hard money
10% down · 12.0% · 12mo
- Down + closing
- —
- Monthly P&I
- —
- Monthly cashflow
- —
- DSCR
- —
- Eligible?
- —
Short-term bridge; refi at stabilization.
Rent comps 22 comps
| Address | Beds | Baths | Sqft | Rent | $/sqft | DOM | Units | Dist |
|---|---|---|---|---|---|---|---|---|
| 20126 Chipplegate Ln Humble, TX | 3.0 | 2.0 | 1348 | $1,800 | $1.34 | 45d | 1 | 0.09mi |
| 20211 Cottonglade Ln Humble, TX | 3.0 | 2.0 | 1348 | $1,699 | $1.26 | 45d | 1 | 0.11mi |
| 20211 Cottonglade Ln Humble, TX | 3.0 | 2.0 | 1348 | $1,699 | $1.26 | 0d | 1 | 0.11mi |
| 19902 Bishops Gate Ln Humble, TX | 3.0 | 2.0 | 1570 | $1,825 | $1.16 | 26d | 1 | 0.28mi |
| 7810 Birchbark Dr Humble, TX | 3.0 | 2.0 | 1663 | $1,899 | $1.14 | 26d | 1 | 0.38mi |
| 8419 Opalwood Ln Unit Main Humble, TX | 3.0 | 2.0 | 2084 | $2,482 | $1.19 | 20d | 1 | 0.45mi |
| 20327 Bridgedale Ln Humble, TX | 3.0 | 2.0 | 1226 | $1,736 | $1.42 | 1d | 1 | 0.55mi |
| 19815 Kenswick Dr Humble, TX | 1.0–2.0 | 1.0–2.0 | 935 | $1,756 | $1.88 | 0d | 62 | 0.55mi |
| 20102 Bridgedale Ln Humble, TX | 3.0 | 2.0 | 1635 | $1,999 | $1.22 | 45d | 1 | 0.58mi |
| 21235 Grand Field Ct Humble, TX | 4.0 | 3.0 | 1750 | $1,800 | $1.03 | 45d | 1 | 0.63mi |
| 7318 Foxway Ln Humble, TX | 3.0 | 2.0 | 1750 | $1,759 | $1.01 | 26d | 1 | 0.65mi |
| 20418 Red Canyon Creek Ln Humble, TX | 4.0 | 2.0 | 1731 | $2,000 | $1.16 | 23d | 1 | 0.66mi |
| 7214 Foxbend Ln Humble, TX | 3.0 | 2.0 | 1591 | $1,975 | $1.24 | 1d | 1 | 0.72mi |
| 7507 Kennemer Dr Humble, TX | 3.0 | 2.5 | 1596 | $1,766 | $1.11 | 13d | 1 | 0.76mi |
| 7010 Foxmont Ln Humble, TX | 3.0 | 2.0 | 1722 | $1,735 | $1.01 | 46d | 1 | 0.94mi |
| 8902 Snapping Turtle Dr Humble, TX | 3.0 | 2.0 | 1414 | $1,729 | $1.22 | 8d | 1 | 0.94mi |
| 7010 Foxmar Ln Humble, TX | 2.0 | 2.0 | 1330 | $1,750 | $1.32 | 45d | 1 | 0.97mi |
| 20527 Faith Millstream Dr Humble, TX | 4.0 | 3.0 | 2178 | $2,100 | $0.96 | 45d | 1 | 1.09mi |
| 20538 Faith Millstream Dr Humble, TX | 4.0 | 2.0 | 1627 | $1,931 | $1.19 | 23d | 1 | 1.13mi |
| 9393 Farm to Market 1960 Bypass Rd W Humble, TX | 1.0–3.0 | 1.0–2.0 | 1033 | $1,931 | $1.87 | 1d | 28 | 1.16mi |
| 19106 Sears Dr Unit B Humble, TX | 3.0 | 2.5 | 1228 | $1,895 | $1.54 | 8d | 1 | 1.34mi |
| 19710 Townsen Blvd Humble, TX | 2.0 | 2.0 | 1174 | $1,697 | $1.45 | 26d | 1 | 1.47mi |
HOA detail
- Monthly dues
- $21 · $252/yr
Listing history 10 events
-
2026-06-01days on market $210,000 Active 91 DOM
-
2026-05-31days on market $210,000 Active 90 DOM
-
2026-03-02$210,000 Active 723-char remark
Show marketing remark (723 chars)
Perfect for first-time homebuyers or savvy investors, this charming 3-bedroom, 2-bath home features a functional layout with a spacious living area and an attached two-car garage. Situated on a generous 6,600 sq. ft. lot, the backyard offers plenty of space to create your ideal outdoor retreat. With the A/C and roof recently replaced, some of the major updates are already complete—giving you a strong head start. Located in the established Kenswick community, residents enjoy easy access to major highways, schools, and shopping. Whether you’re looking to personalize your next home or expand your investment portfolio, this property presents an excellent opportunity. Schedule your private showing today!
-
2026-02-27historical
-
2025-11-01$220,000 Active
-
2004-05-27soldstatus
-
2003-12-31historical
-
2003-05-01$85,000
-
1999-05-19soldstatus
-
1993-06-01soldstatus $46,100
ⓘ Source: listings_history table (triggers on properties + properties_extension) + one-shot
backfill from property_details.listing_events for pre-trigger history.
Tax reassessment forecast TX · Resets to sale price
- Current annual tax
- $4,816 · $401/mo
- Projected year-2 tax
- $4,816 · $401/mo
- Expected delta
- $0/yr ($0/mo · 0.0%)
ⓘ Screening estimate from a state-policy table — verify with the county assessor before closing.
Climate risk First Street
- Flood 4/10 Moderate FEMA zone X (unshaded) · 20% chance over 30 yrs
- Wildfire 3/10 Moderate
- Heat 9/10 Extreme 7 d/yr ≥110°F today · 25 d/yr by 30 yrs out
- Wind 9/10 Extreme 99% chance of damaging wind over 30 yrs
- Air quality 3/10 Moderate 3 unhealthy d/yr today · 3 by 30 yrs out
Nearby sold comps map
Loading sold comps map…
Walkable amenities ~0.75 mi
Loading nearby amenities…
Taxation est. · year 1
- Rental income
- $22,444
- − Mortgage interest
- −$11,763
- − Property taxes
- −$4,816
- − Insurance
- −$1,050
- − Repairs & maintenance
- −$1,796
- − Management
- −$1,796
- − HOA
- −$252
- − Depreciation
- −$6,109
- Taxable loss
- −$5,137
- Est. tax savings @ 24.0%
- +$1,233
- After-tax cash flow
- $-369/yr
For passive investors: Depreciation is non-cash, so a rental often shows a tax loss while cash-flowing — sheltering income. Rental losses are passive: they offset passive income freely, and up to $25,000/yr can offset ordinary (W-2) income if you actively participate and your MAGI is under $100k (phasing out to $0 by $150k); unused losses carry forward. On sale, claimed depreciation is recaptured at up to 25%, and gains may owe capital-gains tax (a 1031 exchange can defer both). Figures are a year-1 estimate at your 24.0% rate — not tax advice; consult a CPA.
Schools (NCES district)
- District
- Aldine ISD
- NCES district ID
- 4807710
- Math proficiency
- 16% ▼ -23.00%
- Reading proficiency
- 21% ▼ -11.00%
- Median HH income
- $37,081
- Composite
- 15.42/100
- National rank
- #9317
- State rank
- #790 of 826 in TX
Livability — Houston
- Score
- 74/100
- State rank
- #184
- US rank
- #4771
Category grades
Schools grade is shown separately in the Schools card above.
Census & demographics
- County
- Harris County · 4,702,590 people
- City population
- 3,226,434
- Metro
- Houston-The Woodlands-Sugar Land, TX
- Population (ZIP)
- 48,031
- Household income
- $64,755
- Rent vs Own
- Severe rent burden
- 2620.0
Population outlook (Harris County) Hauer SSP2
- Today (2025)
- 5,571,493 people
- By 2030
- 6,089,821 · +9.3%
- By 2040
- 7,142,806 · +28.2%
- By 2050
- 8,185,864 · +46.9%
- By 2075
- 10,574,329 · +89.8%
- By 2100
- 12,109,958 · +117.4%
Race, ethnicity, and origin ACS 2023
- Neighborhood character
- Diverse neighborhood (Simpson 0.69)
- Race & ethnicity
- Hispanic / Latino 41% Black 34% Two or more races 18% White 16% Asian 3%
- Hispanic origin (detail)
- Mexican 29% Puerto Rican 1%
- Common ancestry
- Lithuanian 4% Armenian 1% Serbian 1%
- Foreign-born
- 17% · Canada, Jamaica
- Languages at home
- 60% English-only · Spanish 35% Arabic 1% Other Indo-European 1%
Political lean MEDSL · Harris
- 2024 margin
- Lean D (+5.5) · D 52.0% · R 46.4% · Other 1.6%
- 2008→2024 swing
- +3.9pp toward D · 2008: 1.6pp · 2024: 5.5pp
- All cycles
- 2024: D+5.5 2020: D+13.3 2016: D+12.4 2012: D+0.1 2008: D+1.6
Not yet ingested
- Civics
- —
Market trends
- HPI YoY
- ▼ -0.77%
- Current HPI
- 245.7087
- Rent YoY
- ▲ 2.17%
- Metro
- Houston-The Woodlands-Sugar Land, TX
- State GDP YoY
- ▲ 3.95%
- F500 in state
- 110
Industry mix (Fortune 500 HQ in TX)
| Industry | F500 HQs | Revenue |
|---|---|---|
| Energy | 16 | $1,198B |
|
||
| Technology | 5 | $198B |
|
||
| Engineering / Construction | 4 | $72B |
|
||
| Energy Services | 3 | $60B |
|
||
| Utilities | 3 | $41B |
|
||
| Healthcare | 2 | $330B |
|
||
Price history
+355.5% since first listed8 events — show timeline
- 2026-03-02 Listed $210,000 HARMLS
- 2026-02-27 Listing Removed — HARMLS
- 2025-11-01 Listed $220,000 HARMLS
- 2004-05-27 Sold (Public Records) — Public Records
- 2003-12-31 Listing Removed — HARMLS
- 2003-05-01 Listed $85,000 HARMLS
- 1999-05-19 Sold (Public Records) — Public Records
- 1993-06-01 Sold (Public Records) $46,100 Public Records
Property tax history
+4.3%/yrLatest (2025): $4,816 · +0.8% YoY. Source: county tax records.
Cash-flow waterfall
monthlySold comps — $/sqft
last 12 mo · ≤1 miLoading sold comps…