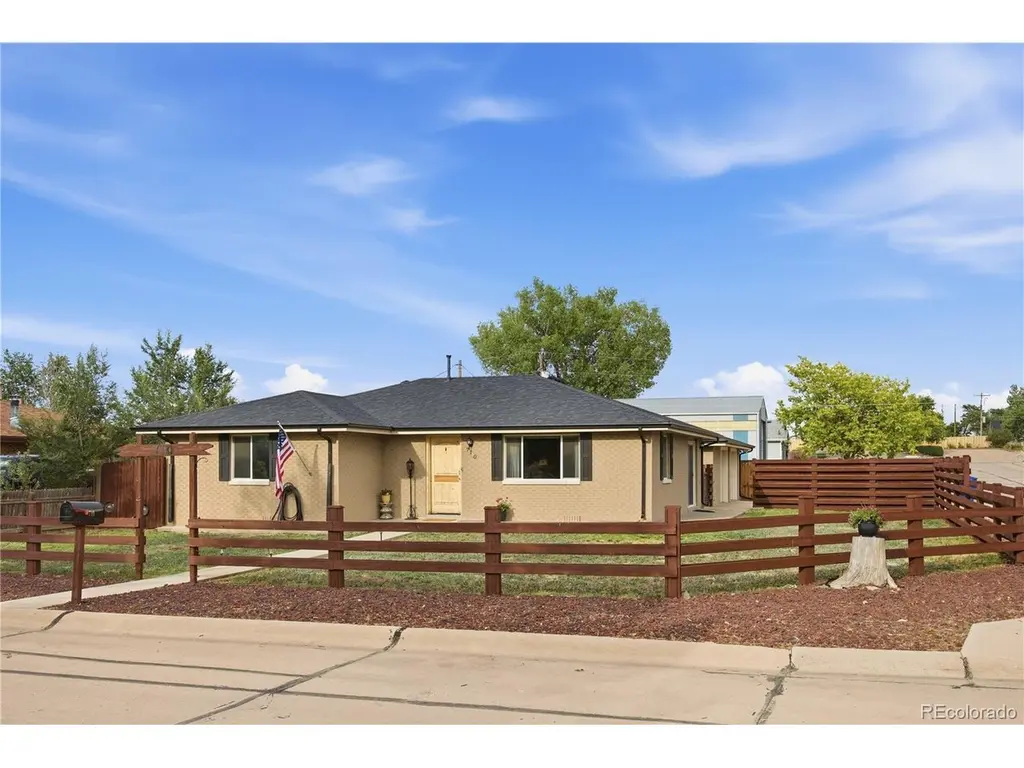
710 4th St · Bennett, CO
Flood risk 1/10 · Minimal
- FEMA flood zone
- X (unshaded)
- Chance of flooding over 30 yrs
- 0.0%
- Est. flood insurance / yr
- $507 – $1,088
Fire risk 5/10 · Moderate
- Est. fire insurance / yr
- $939 – $1,743
Heat risk 3/10 · Minor
- Hot days now (above 93°F)
- 5 days/yr
- Hot days in 30 yrs
- 13 days/yr
Wind risk 2/10 · Minimal
- Chance of severe wind over 30 yrs
- —
Air-quality risk 2/10 · Minimal
- Unhealthy air days now
- 1 days/yr
- Unhealthy air days in 30 yrs
- 2 days/yr
Risk factors via First Street. Map © Google.
Why this score? — see what drove the F grade
The composite is a weighted blend of 9 inputs, each scored 0–100. Each bar is that input's sub-score; the figure is the points it added to the 100-point composite (weight × sub-score).
- Appreciation +10.0/10.0
- Cash flow +9.1/30.0
- Livability +3.0/5.0
- DSCR +2.5/10.0
- Rent growth +2.5/5.0
- Condition / age +2.5/5.0
- Schools +2.1/10.0
- 1% rule +1.7/10.0
- ARV discount +0.6/15.0
$445,000
🖨 Deal sheet 📄 Offer letter ✓ Due diligence
Listing remarks MLS
Do not miss the opportunity to own this charming and well maintained 3 bed, 2 bath home situated on a generous 0.23-acre corner lot in the heart of Bennett. This property offers exceptional versatility, outdoor space, and valuable upgrades-perfect for homeowners, investors, or anyone seeking room to grow. Inside, you'll find a bright and comfortable layout with laminate flooring, real hardwood doors, and a welcoming living area ideal for everyday living. The kitchen features newer appliances, ample cabinet space, and easy access to the backyard. A new washer and dryer are also included for added convenience. The oversized detached 2 car garage is a standout feature-offering abundant storage, workshop potential, or the opportunity to convert it into an additional dwelling unit (ADU) if desired. With alley access and a spacious lot, the possibilities are wide open. Recent improvements include a new roof, giving buyers peace of mind and long-term value. The large, fenced yard provides plenty of room for gardening, pets, outdoor entertainment, or future expansion. Best of all, there's no HOA Located just minutes from schools, parks, local shops, and quick access to I 70, this home combines small town living with easy commuting. A rare opportunity to own a flexible, well cared for property on one of Bennett's larger lots.
Key facts
- Fenced yard
- Newer appliances
- Outdoor space
Tags
Property features AI
Exterior
- Parking: 2 total parking spaces; 2-car garage; Concrete driveway; Oversized parking
- Utilities: Public water; Public sewer; Electricity connected; Wired internet available; Natural gas available
- Home design: Single-family residence; One story; Updated/remodeled; Unattached property; Individual ownership; Facing public street
- Construction: Brick and frame construction; Shingle roof; Built as a house (structure type: house)
- Exterior features: Patio; Full yard fencing; Corner lot; Paved public road frontage
Interior
- Kitchen: Dishwasher; Microwave; Range; Refrigerator
- Bedrooms: 3 bedrooms (all on the main level)
- Flooring: Laminate flooring
- Bathrooms: 2 full bathrooms (both on the main level)
- Heating & cooling: Forced air heating; Attic fan for cooling
- Interior features: Laminate countertops; Unfurnished
- Laundry & utility: Washer and dryer in unit
Neighborhood map
What this means for you Summary
Snapshot
- This is a 3-bed/2.0-bath single-family listed at $445k.
Deal economics
- At list price, monthly cash flow is $-342 ($-4k/yr) — negative.
- To cash-flow at today's rent, offer at most $385k (13.6% below list).
- To meet the 1% rule (rent ≥ 1% of price), the offer needs to be $300k (32.6% below list).
- Recommended offer: $300k (32.6% below list) — sets the bar for 1% rule.
Location & tenants
- Location reads 59/100 on livability (#263 in CO) — a working-class tenant base; expect higher turnover. Strengths: housing A+, crime A-; Watch: cost of living D+, amenities F, commute F.
- Bennett School District No. 29J (rural): math 13% / reading 31% proficiency, ranked #69 of 86 in CO (top 80%) — low school quality limits family demand, transient renter base, plan for 1-2y turnover.
- Zoned schools: Bennett Preschool (71 students, 11% FRL); Bennett Middle School (math 8% / reading 42%, grade F, #168 of 270 statewide, top 63%, 304 students, 38% FRL); Bennett High School (math 22% / reading 47%, grade F, #209 of 381 statewide, top 56%, 427 students, 25% FRL) — zoned schools at 25% FRL track the district average.
- Market conditions: 212 active listings in the ZIP; 1 comparable units currently listed for rent nearby; 2,299 units permitted in Adams County in 2024 (343 in 5+ unit buildings).
Forward outlook
- In year one you build about $48k of equity ($3k loan paydown + $44k appreciation (10.0% local appreciation)).
- Adams County population projected at +44% by 2050 — long-run rental-demand tailwind backs the buy-and-hold thesis.
- By year 2, paydown + projected appreciation supports a ~$76k cash-out refi (75% LTV) — recoverable capital for the next deal without selling this one.
Negotiation context
- Only 6 days on market — expect competitive offers; lowballing is unlikely to land.
- 14 sale attempts since 13y ago with the ask held roughly flat each time — persistent listings suggest the price (not the market) is what's stuck; bring a comps-based counter.
Risks & watch-outs
- Climate carrying-cost: moderate wildfire risk — expect insurance premiums to compound above CPI over the hold.
Questions for the listing agent
- What do current leases actually rent for vs. the listed asking? Can we see a recent rent roll and the last 12 months of T-12 income?
- Built in 1978 — when were the roof, HVAC, electrical panel, plumbing, and water heater last replaced?
- Is there a deadline driving the sale (1031 exchange, divorce, estate, relocation)? That informs how much negotiation room exists.
- Schools are F-rated, which usually means shorter tenancies and higher turnover. Who's the typical renter profile here, and what's been the actual vacancy rate?
- The area grade is low — what's the realistic commute time and amenity access for the typical tenant pool here? Any planned neighborhood developments (good or bad) we should know about?
- What's the average days-on-market for RENTAL listings here right now (not sales)? A rising rental-DOM trend means longer vacancies and softer asking-rent achievability than the comps imply.
- What's the recent tenant-quality profile in this submarket — average credit score on applications, eviction rate, late-payment / NSF rate, and stable-employment percentage? A property-management company in the area should have these aggregated.
- How much new for-sale + rental construction is in the pipeline within 1–3 miles? Heavy new supply typically softens prices + rents 12–24 months out; constrained supply supports both.
Investment metrics
- 1% rule
- 0.67% ✗
- Cap rate
- 5.37%
- Cash-on-cash
- -3.29%
- DSCR
- 0.85
- GRM
- 12.4
CMA / ARV
- ARV (on-the-fly)
- $385,575
- Comps found
- 12
Show comp detail 12 sales within ~0.75 mi
| Address | Dist | Beds/Ba | Sqft | Sold | Price | $/sf | Match |
|---|---|---|---|---|---|---|---|
| 750 4th St | 0.05mi | 3/1.0 | 1,440 (+9%) | 15mo | $399,500 | $277 | 67 |
| 48280 Shetland Dr | 0.59mi | 3/2.0 | 1,285 (-3%) | 6mo | $439,900 | $342 | 63 |
| 48265 Shetland Dr | 0.58mi | 3/2.0 | 1,285 (-3%) | 8mo | $449,900 | $350 | 61 |
| 845 Madison Way | 0.73mi | 3/2.0 | 1,380 (+4%) | 4mo | $378,900 | $275 | 55 |
| 470 Kiowa Ave | 0.52mi | 3/3.0 | 1,390 (+5%) | 13mo | $404,000 | $291 | 53 |
| 704 Madison Way | 0.68mi | 3/2.0 | 1,210 (-9%) | 4mo | $410,000 | $339 | 51 |
| 47385 Lily Ave | 0.72mi | 3/2.0 | 1,490 (+12%) | 4mo | $397,500 | $267 | 42 |
| 47349 Lily Ave | 0.72mi | 3/2.0 | 1,490 (+12%) | 4mo | $415,000 | $279 | 42 |
| 485 Bennett Ave | 0.63mi | 3/3.0 | 1,467 (+11%) | 12mo | $426,000 | $290 | 39 |
| 280 Birch St | 0.62mi | 3/2.0 | 1,152 (-13%) | 13mo | $379,900 | $330 | 38 |
| 316 Maple St | 0.71mi | 3/2.0 | 1,490 (+12%) | 10mo | $390,000 | $262 | 37 |
| 309 Spruce St | 0.71mi | 3/2.0 | 1,490 (+12%) | 13mo | $435,000 | $292 | 35 |
Match score weights: distance 35% · size 25% · config 20% · recency 20%. Top-matched comps best support the ARV.
Projected returns pro-forma
10.0% appreciation · 3.0% rent growth · sell at horizon
- IRR
- 21.9%
- Equity multiple
- 2.77×
- Total profit
- $220,392
- Equity at exit
- $400,891
- IRR
- 19.7%
- Equity multiple
- 6.34×
- Total profit
- $665,799
- Equity at exit
- $864,537
Cash invested: $124,600 (down + closing). Projections, not guarantees.
Landlord ↔ Tenant lean methodology
- Overall (STATE)
- 38 Tenant-Leaning
- State Colorado
- 38 Tenant-Leaning · D+4
- County
- — inherits STATE
- City
- — inherits STATE
ZIP-level market 80102
- Home prices YoY
- 3.1%
- Active inventory
- 212
- Price-to-rent
- 12.4×
Monthly cashflow live
- Estimated rent
- $3,000 medium interval (Pro) →
- Mortgage (P&I)
- −$2,334
- Tax from tax record
- −$193 /mo · $2,317/yr
- Insurance
- −$185
- HOA
- −$0
- Vacancy / Maint / Mgmt
- −$630
- Net cashflow
- $-342
Break-even live
UW: 25.0% down · 7.5% · 30yr · 1.5% tax · 5.0% vac · 8.0% maint · 8.0% mgmt
Financing live
Cash to close
- Down payment
- $111,250
- Closing costs
- $13,350
- Reserves months
- —
- Total cash needed
- —
Loan-product check · same deal, 3 products live
Conventional
25% down · 7.5% · 30yr
- Down + closing
- —
- Monthly P&I
- —
- Monthly cashflow
- —
- DSCR
- —
- Eligible?
- —
Personal DTI + credit; lowest rate.
DSCR
20% down · 8.5% · 30yr
- Down + closing
- —
- Monthly P&I
- —
- Monthly cashflow
- —
- DSCR
- —
- Eligible?
- —
No personal income docs; deal must DSCR.
Hard money
10% down · 12.0% · 12mo
- Down + closing
- —
- Monthly P&I
- —
- Monthly cashflow
- —
- DSCR
- —
- Eligible?
- —
Short-term bridge; refi at stabilization.
Rent comps 1 comps
| Address | Beds | Baths | Sqft | Rent | $/sqft | DOM | Units | Dist |
|---|---|---|---|---|---|---|---|---|
| 239 Adams St Bennett, CO | 3.0 | 2.5 | 1653 | $3,000 | $1.81 | 24d | 1 | 0.58mi |
Listing history 6 events
-
2026-06-18days on market $445,000 Coming Soon 6 DOM
-
2026-06-17days on market $445,000 Coming Soon 5 DOM
-
2026-06-16days on market $445,000 Coming Soon 4 DOM
-
2026-06-15days on market $445,000 Coming Soon 3 DOM
-
2026-06-13remarks 681-char remark
-
2026-06-13$445,000 Coming Soon 1 DOM
ⓘ Source: listings_history table (triggers on properties + properties_extension) + one-shot
backfill from property_details.listing_events for pre-trigger history.
Tax reassessment forecast CO · Resets to sale price
- Current annual tax
- $2,317 · $193/mo
- Projected year-2 tax
- $2,448 · $204/mo
- Expected delta
- +$131/yr (+$11/mo · 5.6%)
ⓘ Screening estimate from a state-policy table — verify with the county assessor before closing.
Climate risk First Street
- Flood 1/10 Low FEMA zone X (unshaded) · 0% chance over 30 yrs
- Wildfire 5/10 Major
- Heat 3/10 Moderate 5 d/yr ≥93°F today · 13 d/yr by 30 yrs out
- Wind 2/10 Low
- Air quality 2/10 Low 1 unhealthy d/yr today · 2 by 30 yrs out
Nearby sold comps map
Loading sold comps map…
Walkable amenities ~0.75 mi
Loading nearby amenities…
Taxation est. · year 1
- Rental income
- $36,000
- − Mortgage interest
- −$24,927
- − Property taxes
- −$2,317
- − Insurance
- −$2,225
- − Repairs & maintenance
- −$2,880
- − Management
- −$2,880
- − Depreciation
- −$12,945
- Taxable loss
- −$12,174
- Est. tax savings @ 24.0%
- +$2,922
- After-tax cash flow
- $-1,183/yr
For passive investors: Depreciation is non-cash, so a rental often shows a tax loss while cash-flowing — sheltering income. Rental losses are passive: they offset passive income freely, and up to $25,000/yr can offset ordinary (W-2) income if you actively participate and your MAGI is under $100k (phasing out to $0 by $150k); unused losses carry forward. On sale, claimed depreciation is recaptured at up to 25%, and gains may owe capital-gains tax (a 1031 exchange can defer both). Figures are a year-1 estimate at your 24.0% rate — not tax advice; consult a CPA.
Schools (NCES district)
- District
- Bennett School District No. 29J
- NCES district ID
- 0802430
- Math proficiency
- 13% ▼ -10.00%
- Reading proficiency
- 31% ▼ -9.00%
- Median HH income
- $69,795
- Composite
- 21.39/100
- National rank
- #8353
- State rank
- #69 of 86 in CO
Livability — Bennett
- Score
- 59/100
- State rank
- #263
- US rank
- #19691
Category grades
Schools grade is shown separately in the Schools card above.
Census & demographics
- Census place
- Bennett, CO
- City population
- 5,994
- Population (ZIP)
- 5,994
Population outlook (Adams County) Hauer SSP2
- Today (2025)
- 598,184 people
- By 2030
- 651,880 · +9.0%
- By 2040
- 759,778 · +27.0%
- By 2050
- 862,889 · +44.3%
- By 2075
- 1,085,994 · +81.5%
- By 2100
- 1,211,318 · +102.5%
Race, ethnicity, and origin ACS 2023
- Neighborhood character
- Predominantly White (72%)
- Race & ethnicity
- White 72% Hispanic / Latino 21% Two or more races 11% Black 2%
- Hispanic origin (detail)
- Mexican 17% Puerto Rican 1%
- Common ancestry
- Serbian 4% Italian 3% Lithuanian 2%
- Foreign-born
- 6% · Canada, China
- Languages at home
- 87% English-only · Spanish 10% German/W. Germanic 1% Chinese 1%
Political lean MEDSL · Adams
- 2024 margin
- Lean D (+9.0) · D 53.2% · R 44.1% · Other 2.7%
- 2008→2024 swing
- -9.3pp toward R · 2008: 18.4pp · 2024: 9.0pp
- All cycles
- 2024: D+9.0 2020: D+16.3 2016: D+7.2 2012: D+15.1 2008: D+18.4
Not yet ingested
- Civics
- —
Market trends
- HPI YoY
- ▲ 14.94%
- Current HPI
- 494.39
- Rent YoY
- —
- Metro
- —
- State GDP YoY
- ▲ 1.95%
- F500 in state
- 14
Industry mix (Fortune 500 HQ in CO)
| Industry | F500 HQs | Revenue |
|---|---|---|
| Technology Distribution | 1 | $31B |
|
||
| Food / Agriculture | 1 | $18B |
|
||
| Packaging | 1 | $14B |
|
||
| Healthcare | 1 | $13B |
|
||
| Energy | 1 | $10B |
|
||
| Technology | 1 | $4B |
|
||
Price history
+694.6% since first listed48 events — show timeline
- 2026-06-12 Coming Soon $445,000 IRES
- 2026-06-12 Coming Soon $445,000 REColorado as Distributed by MLS Grid
- 2026-06-11 Listed $445,000 IRES
- 2026-06-11 Listed $445,000 REColorado as Distributed by MLS Grid
- 2026-06-11 Listing Removed — REColorado as Distributed by MLS Grid
- 2026-06-11 Listing Removed — IRES
- 2026-06-11 Coming Soon — IRES
- 2026-06-11 Coming Soon — REColorado as Distributed by MLS Grid
- 2025-09-12 Listing Removed — REColorado as Distributed by MLS Grid
- 2025-09-06 Relisted — IRES
- 2025-09-06 Relisted — REColorado as Distributed by MLS Grid
- 2025-09-02 Pending — IRES
- 2025-09-02 Pending — REColorado as Distributed by MLS Grid
- 2025-09-02 Listing Removed — IRES
- 2025-08-18 Rental Removed $2,150 TURBOTENANT
- 2025-08-06 Price Changed $2,150 TURBOTENANT
- 2025-08-01 Listed for Rent $2,250 TURBOTENANT
- 2025-06-26 Price Changed $459,900 IRES
- 2025-06-26 Price Changed $459,900 REColorado as Distributed by MLS Grid
- 2025-05-15 Listed $465,000 IRES
- 2025-05-15 Listed $465,000 REColorado as Distributed by MLS Grid
- 2025-05-10 Coming Soon — IRES
- 2025-05-10 Coming Soon — REColorado as Distributed by MLS Grid
- 2025-01-30 Listing Removed — IRES
- 2025-01-30 Listing Removed — REColorado as Distributed by MLS Grid
- 2024-09-30 Rental Removed $2,400 TURBOTENANT
- 2024-09-25 Listed $479,900 IRES
- 2024-09-25 Listed $479,900 REColorado as Distributed by MLS Grid
- 2024-09-11 Price Changed $2,400 TURBOTENANT
- 2024-09-11 Listed for Rent $2,450 TURBOTENANT
- 2023-06-28 Rental Removed — TURBOTENANT
- 2022-04-28 Sold (MLS) $470,000 REColorado as Distributed by MLS Grid
- 2022-04-28 Sold (MLS) $470,000 IRES
- 2022-03-29 Pending — REColorado as Distributed by MLS Grid
- 2022-03-24 Listed $415,000 REColorado as Distributed by MLS Grid
- 2022-03-24 Listed $415,000 IRES
- 2022-03-22 Coming Soon $415,000 REColorado as Distributed by MLS Grid
- 2016-03-15 Sold (Public Records) $228,000 Public Records
- 2016-03-14 Sold (MLS) $228,000 REColorado as Distributed by MLS Grid
- 2016-02-14 Pending — REColorado as Distributed by MLS Grid
- 2016-02-11 Listed $219,999 REColorado as Distributed by MLS Grid
- 2014-03-10 Sold (Public Records) $154,500 Public Records
- 2014-03-07 Sold (MLS) $154,500 REColorado as Distributed by MLS Grid
- 2014-01-25 Pending — REColorado as Distributed by MLS Grid
- 2013-12-27 Listed $159,973 REColorado as Distributed by MLS Grid
- 1997-08-29 Sold (Public Records) $119,950 Public Records
- 1993-12-27 Sold (Public Records) $68,000 Public Records
- 1987-10-21 Sold (Public Records) $56,000 Public Records
Property tax history
+4.4%/yrLatest (2025): $2,317 · -2.5% YoY. Source: county tax records.
Cash-flow waterfall
monthlySold comps — $/sqft
last 12 mo · ≤1 miLoading sold comps…